Educational Nonprofits Dashboard play a powerful role in transforming communities by improving literacy, supporting students, and expanding access to quality education. However, managing nonprofit operations requires handling large volumes of financial, operational, and impact-related data every day. Leaders must simultaneously track donations, grants, program expenses, operating costs, regional performance, and student satisfaction — which becomes difficult when information is spread across multiple spreadsheets.
The Educational Nonprofits Dashboard in Power BI is a ready-to-use, interactive analytics solution designed to convert complex nonprofit data into clear and actionable insights. Instead of manually compiling reports, nonprofit leaders can monitor performance through a centralized dashboard that presents key metrics using dynamic visuals, KPI cards, and interactive filters.
Built using Microsoft Power BI, this dashboard enables organizations to analyze funding utilization, evaluate program effectiveness, monitor regional performance, and track operational trends in real time. Because Power BI automatically updates visuals when filters are applied or datasets are refreshed, decision-makers gain instant clarity and make faster strategic decisions.
Whether your organization manages scholarships, training programs, community education initiatives, or global nonprofit projects, this dashboard helps shift operations from reactive reporting to proactive impact management.
🚀 Key Feature of Educational Nonprofits Dashboard in Power BI
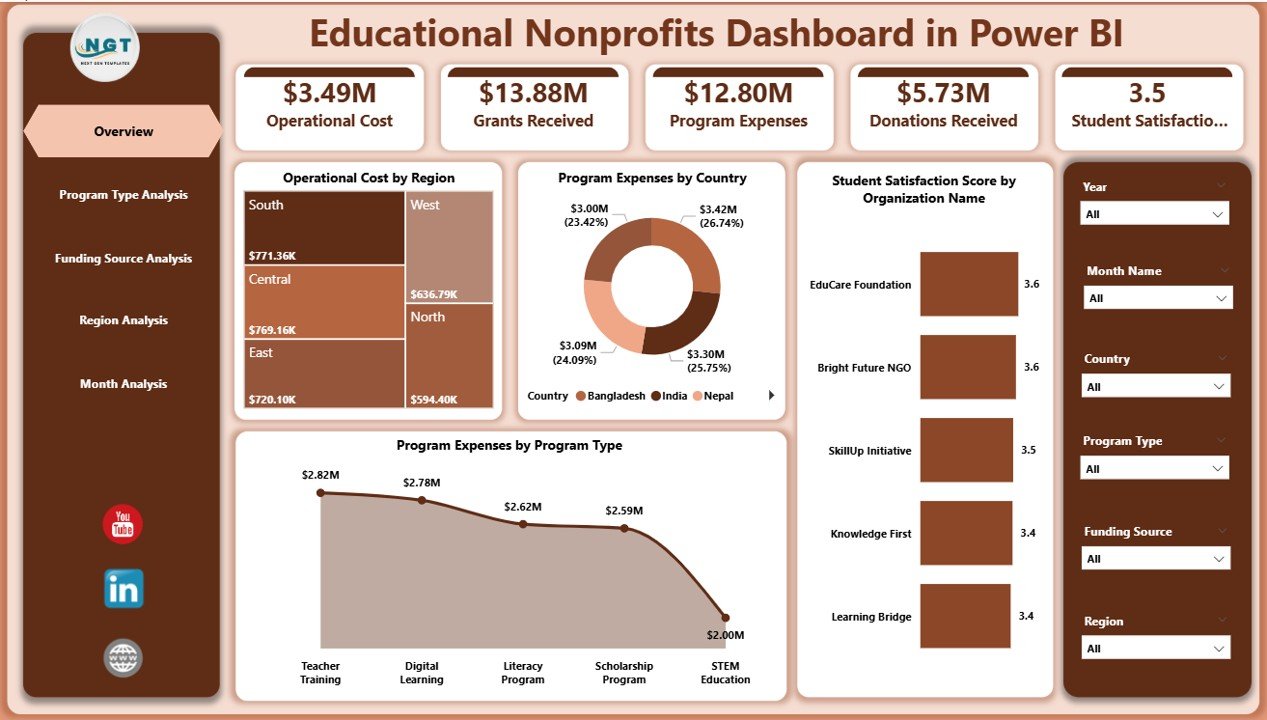
📊 Centralized Nonprofit Performance Monitoring
Track donations, grants, expenses, and satisfaction metrics from one unified analytics platform.
🎯 Interactive Overview Dashboard
View KPI cards and high-level visuals that summarize organizational performance instantly.
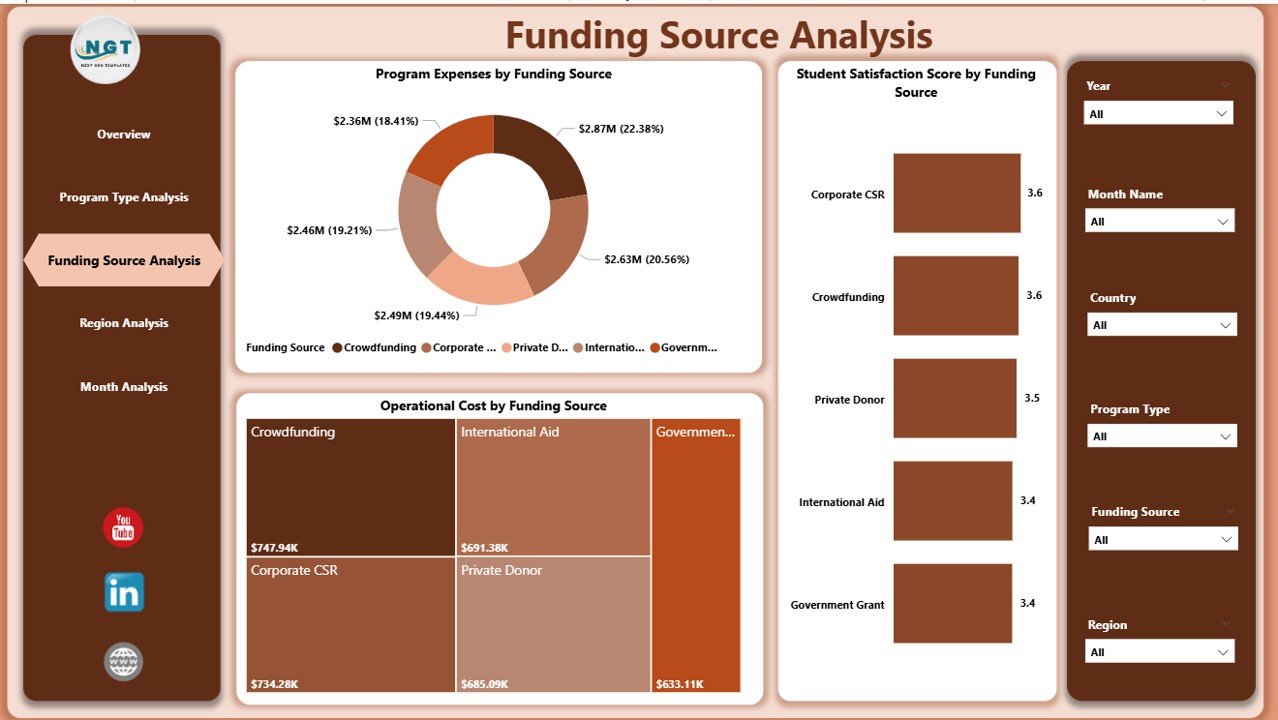
💰 Funding Source Performance Analysis
Understand how grants and donations contribute to program outcomes and operational efficiency.
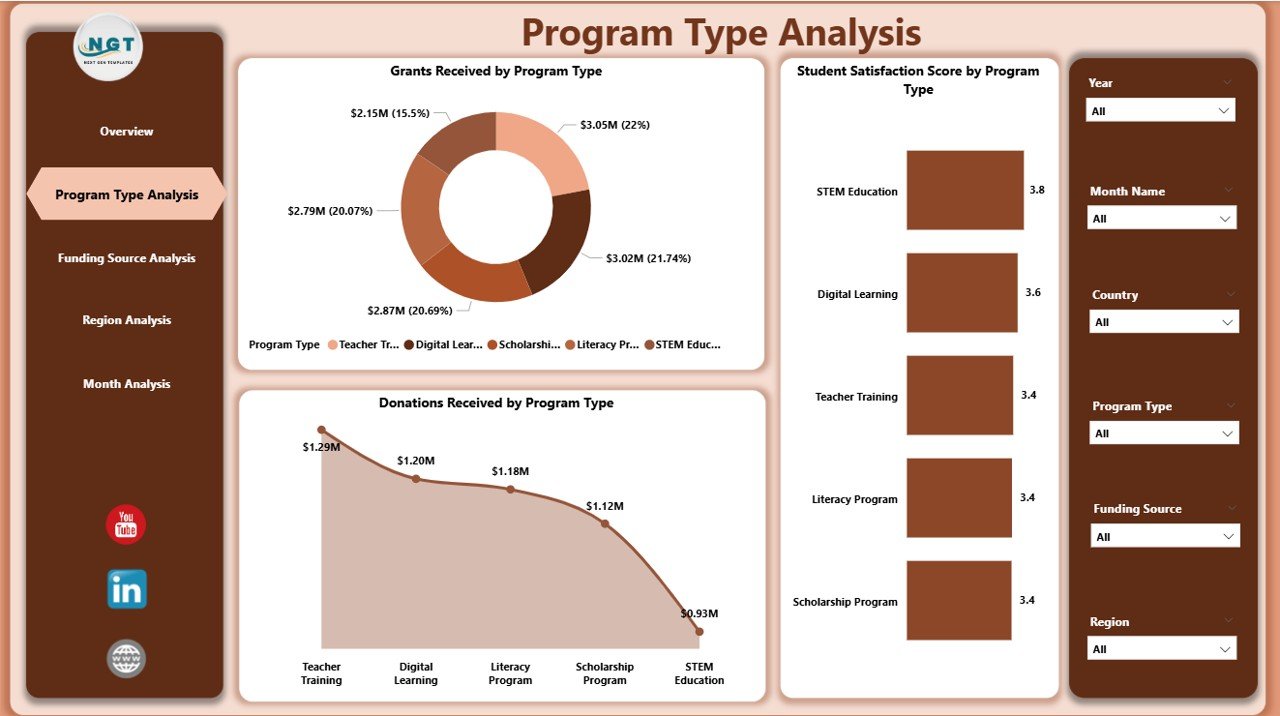
📈 Program Type Effectiveness Insights
Compare educational initiatives to identify high-impact programs.
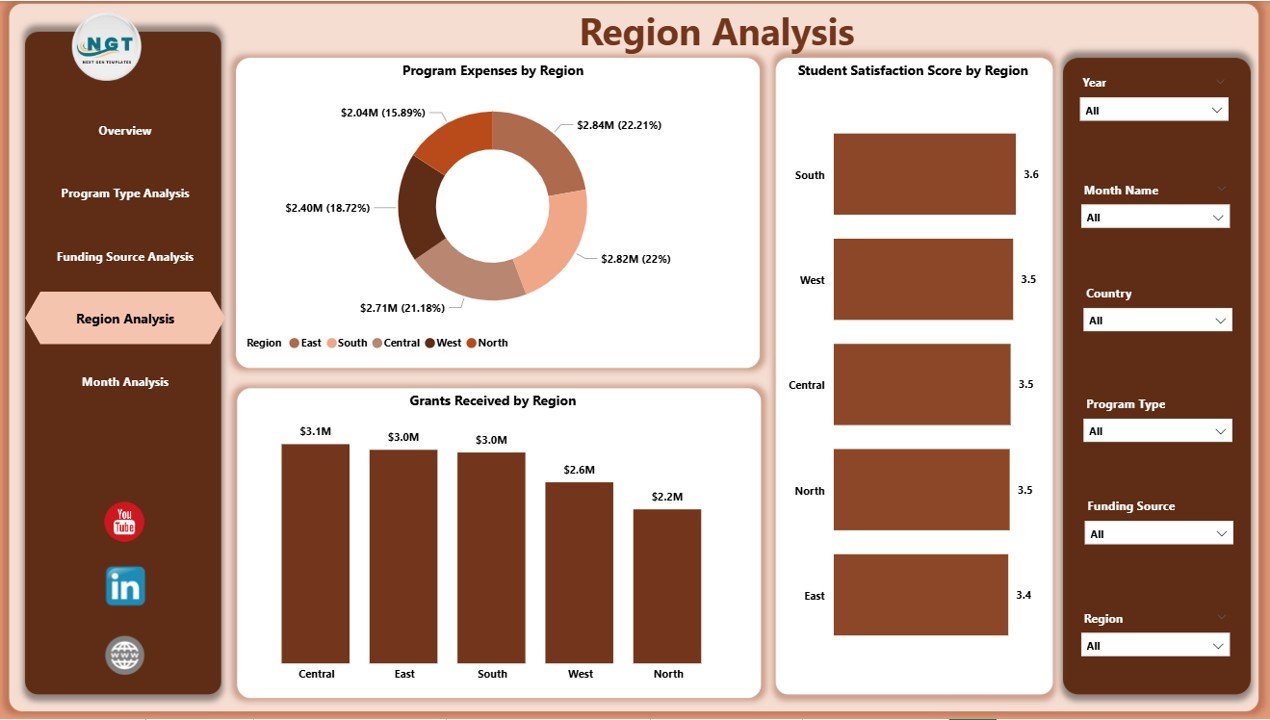
🌍 Region-Based Performance Monitoring
Evaluate geographic performance differences and allocate resources strategically.
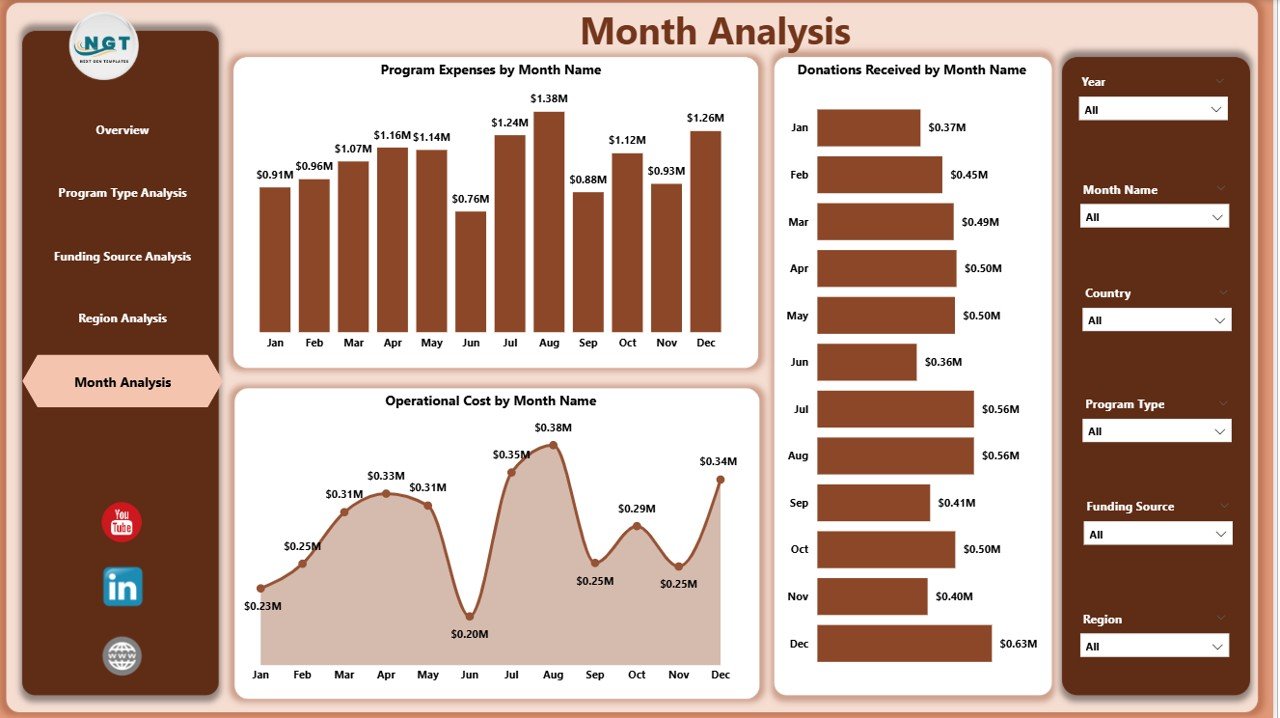
📅 Monthly Trend Analysis
Track expenses, donations, and operating costs over time for better budgeting.
🔎 Dynamic Slicers & Filters
Analyze data instantly across regions, programs, and funding categories.
⚡ Automated Power BI Visual Updates
Refresh datasets and dashboards update automatically.
📦 What’s Inside the Educational Nonprofits Dashboard in Power BI
This ready-to-use dashboard includes a complete nonprofit analytics framework:
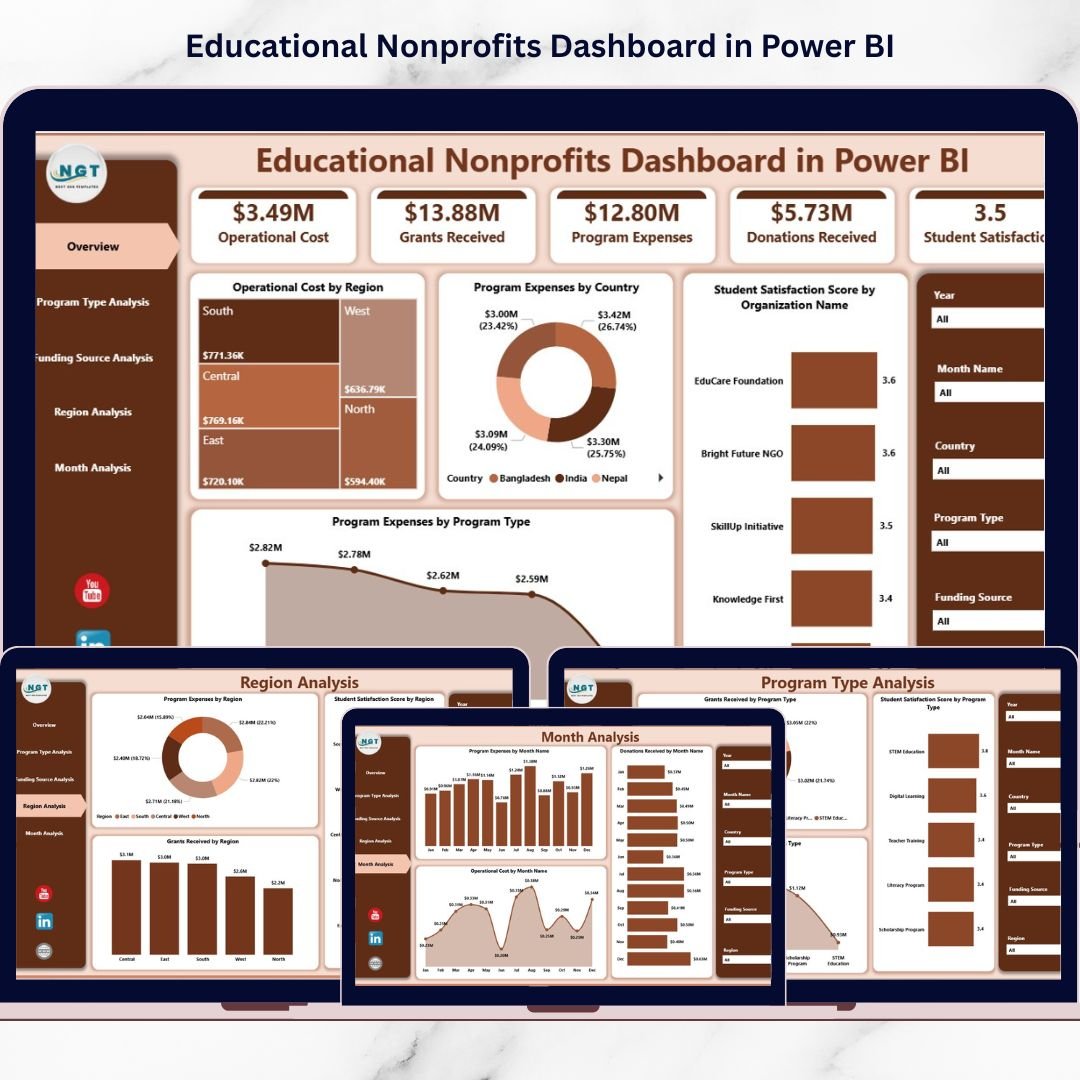
✅ Five Interactive Dashboard Pages
-
Overview Page
-
Program Type Analysis
-
Funding Source Analysis
-
Region Analysis
-
Month Analysis
✅ Interactive KPI Cards & Visual Reports
✅ Dynamic Slicers for Deep Analysis
✅ Professional Nonprofit Reporting Layout
✅ Ready-to-Use Power BI Dashboard File
✅ Structured Data Model for Easy Integration
Simply connect your nonprofit data and start analyzing immediately.
🛠️ How to Use the Educational Nonprofits Dashboard in Power BI
The dashboard is designed for easy adoption:
1️⃣ Import nonprofit data into Power BI.
2️⃣ Refresh datasets to update visuals automatically.
3️⃣ Use slicers to filter by region, program type, or funding source.
4️⃣ Navigate analytical pages for deeper insights.
5️⃣ Review KPI cards and charts to evaluate performance.
6️⃣ Share dashboards securely with stakeholders and donors.
Even non-technical users can explore insights easily through interactive visuals.
👥 Who Can Benefit from This Educational Nonprofits Dashboard in Power BI
This dashboard is ideal for organizations across the nonprofit education ecosystem:
🎓 Nonprofit Executive Leaders
📊 Program Managers & Coordinators
💰 Finance & Grant Management Teams
🌍 International Education Organizations
🤝 Donors & Funding Partners
📈 Data Analysts & Reporting Teams
From small nonprofits to large global organizations, this dashboard provides clear operational visibility.
By implementing this dashboard, organizations improve transparency, strengthen donor confidence, reduce reporting time, and enable data-driven decision-making. Instead of managing multiple reports manually, teams gain a single source of truth for nonprofit performance and impact measurement.
### Click here to read the Detailed blog post
Visit our YouTube channel to learn step-by-step video tutorials:
👉 https://youtube.com/@PKAnExcelExpert


