Managing derivatives trading data without a clear structure can quickly turn into chaos. With multiple instruments, counterparties, margin requirements, and risk metrics, even small delays or miscalculations can lead to costly decisions. That is exactly why the Derivatives Trading Dashboard in Excel is designed—to give you clarity, control, and confidence over your derivatives portfolio.
This professionally designed Excel dashboard converts complex derivatives data into clean visuals, actionable KPIs, and interactive insights. Instead of juggling multiple spreadsheets, static reports, or manual calculations, you get a single, centralized dashboard that shows exposure, risk, margin, and performance at a glance.
Built for real-world trading environments, this dashboard helps traders, risk managers, treasury teams, and financial leaders see the full picture instantly and respond faster to market movements.
Key Features of Derivatives Trading Dashboard in Excel 📊
🚀 Interactive Page Navigator
Quickly switch between dashboard pages without searching through worksheets, making analysis faster and presentations smoother.
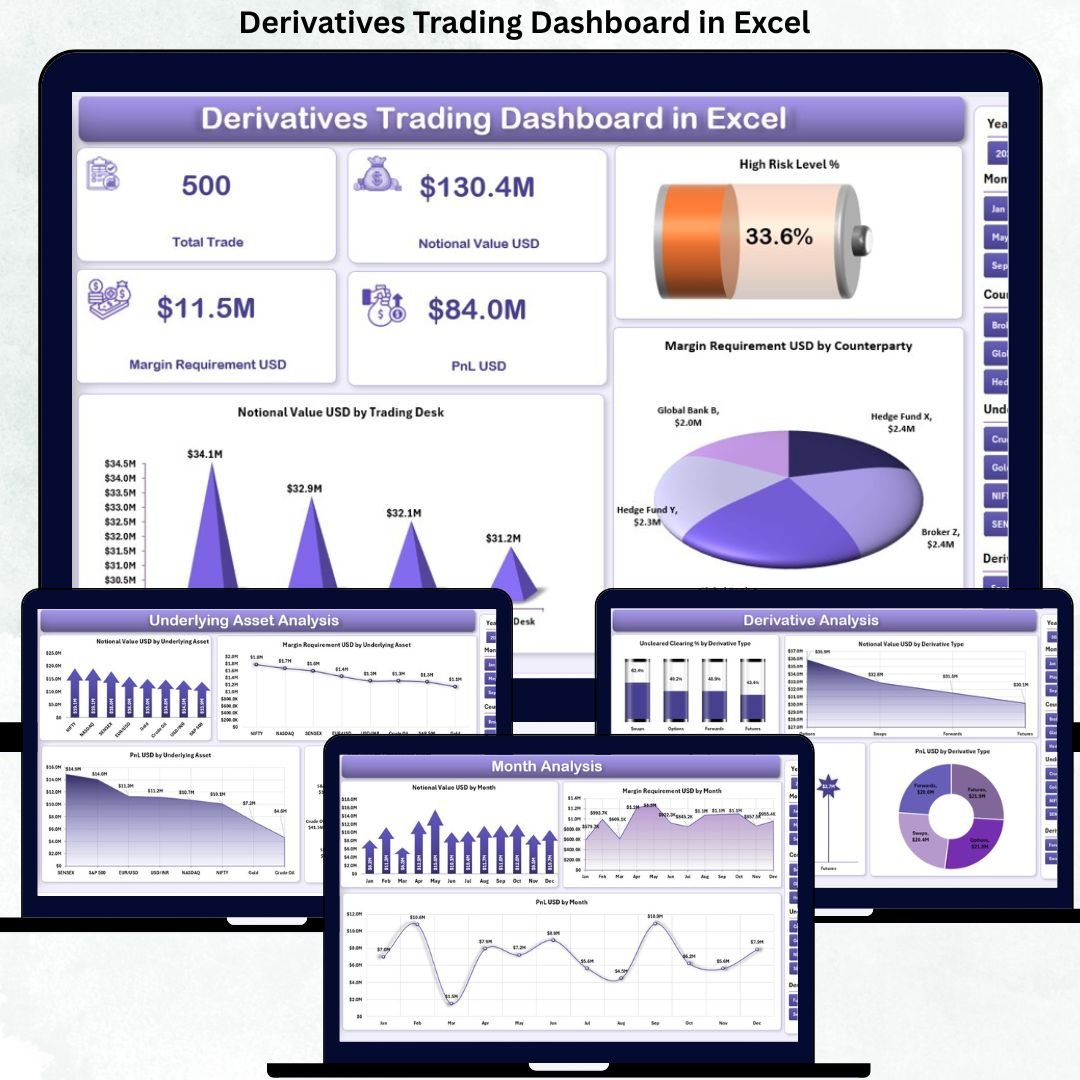
📈 Comprehensive Overview Page
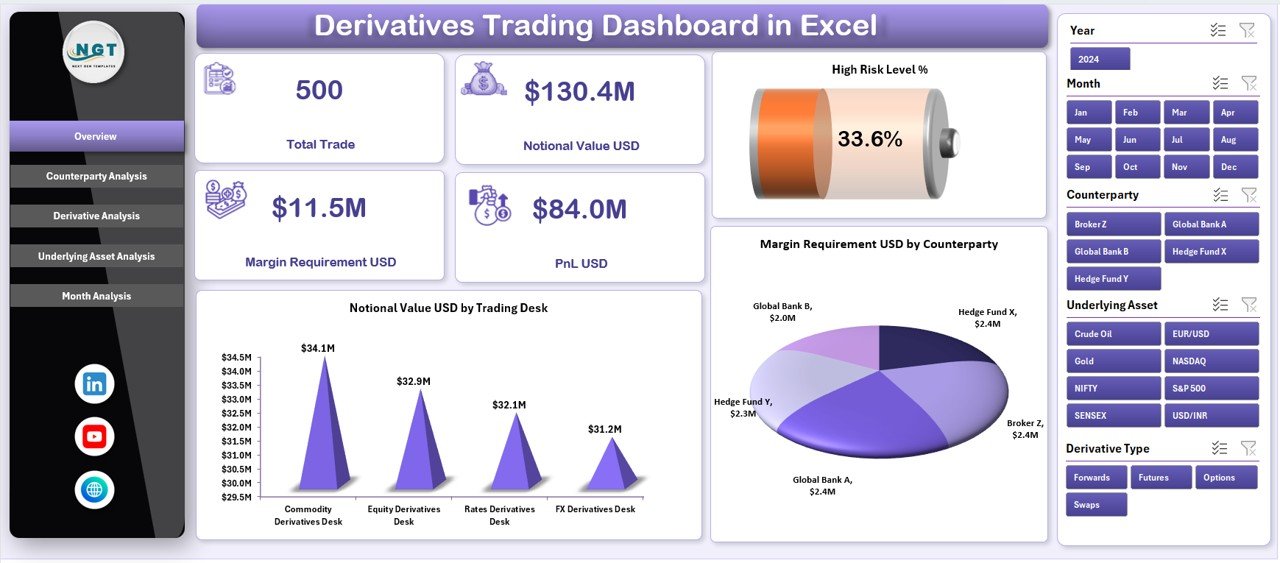
Get instant visibility into high-risk exposure, notional value by trading desk, and margin requirements using KPI cards and charts.
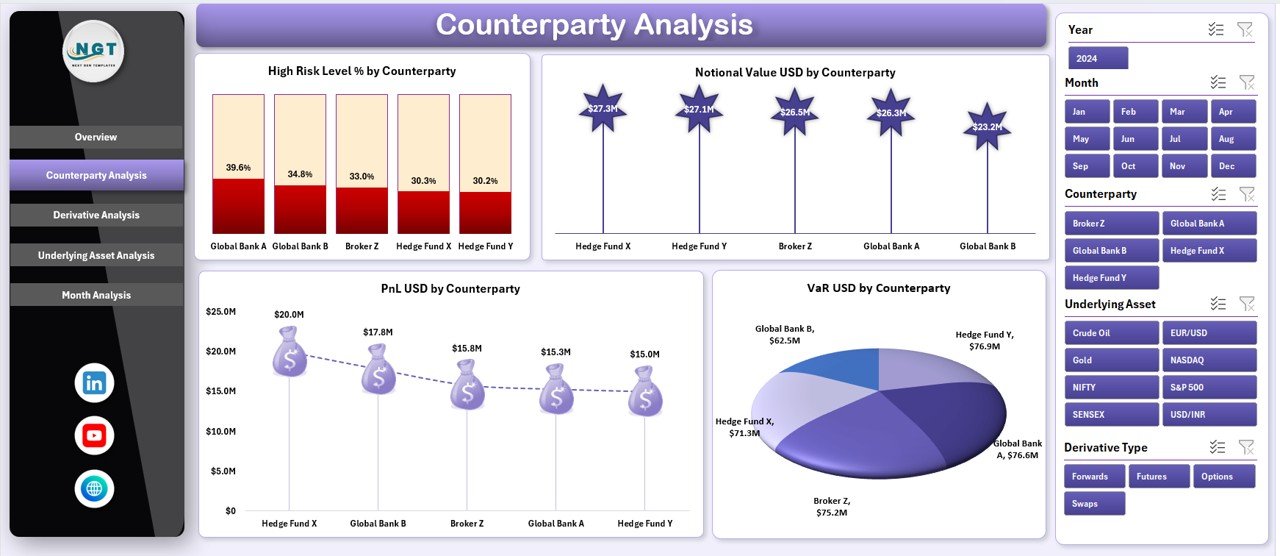
⚠️ Advanced Counterparty Risk Analysis
Track high-risk levels, PnL, VaR, and exposure concentration by counterparty to manage limits and reduce credit risk.
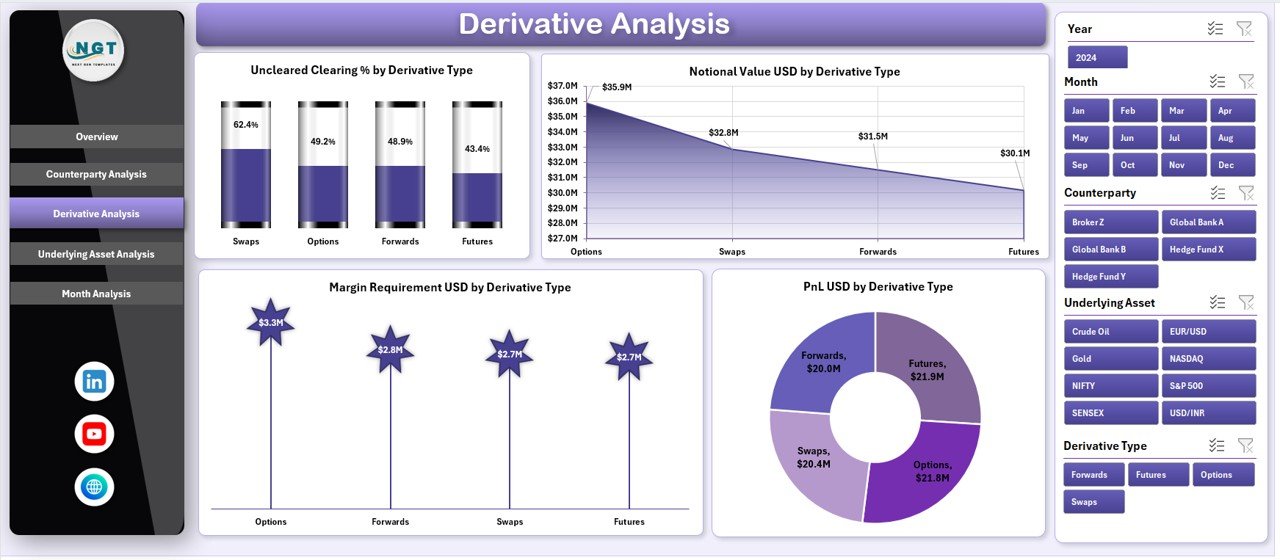
📉 Derivative Type Performance Analysis
Analyze swaps, options, futures, and forwards with instrument-level insights into margin, profitability, and clearing status.
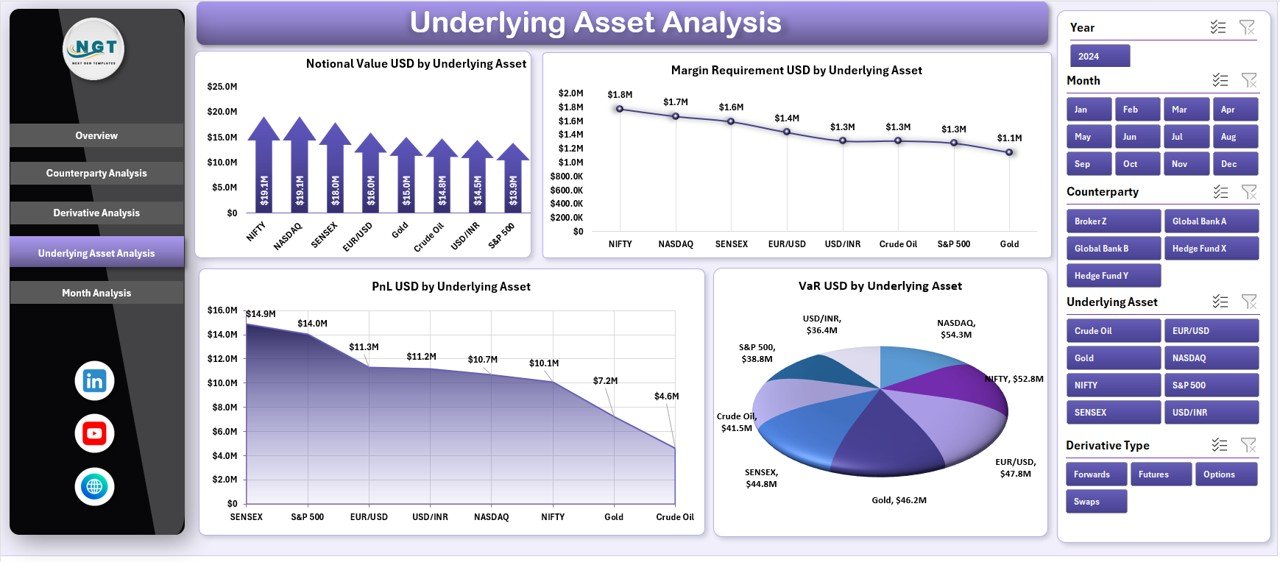
🌍 Underlying Asset Exposure Tracking
Understand exposure, risk, and profitability across interest rates, currencies, commodities, and equities.
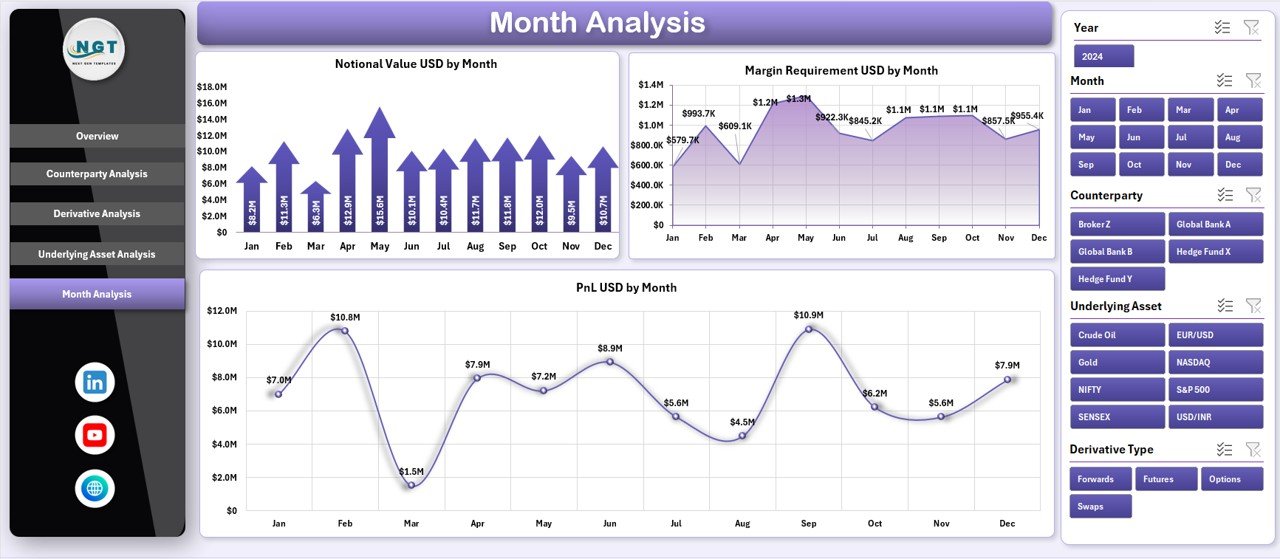
📆 Month-wise Trend Analysis
Monitor how notional value, margin requirements, and PnL evolve over time for better strategic planning.
🔄 Auto-Refresh with Data Updates
Update the data sheet, and all visuals refresh automatically—no manual recalculations required.
What’s Inside the Derivatives Trading Dashboard in Excel 📂
📌 Multiple Analysis Pages
Overview, Counterparty Analysis, Derivative Analysis, Underlying Asset Analysis, and Month Analysis pages.
📌 Structured Data Sheet
Transaction-level data fields such as trade date, counterparty, derivative type, notional value, margin, PnL, and risk classification.
📌 Support & Calculation Sheet
Pre-built helper columns, risk logic, lookup tables, and mappings for consistent and reliable analysis.
📌 Interactive Slicers & Filters
Filter results by month, counterparty, derivative type, or asset within seconds.
📌 Presentation-Ready Design
Clean layout, professional visuals, and executive-friendly insights.
How to Use the Derivatives Trading Dashboard in Excel 🧭
1️⃣ Enter or paste your derivatives trading data into the Data Sheet
2️⃣ Review calculations and mappings in the Support Sheet
3️⃣ Use slicers to filter data by month, counterparty, or instrument
4️⃣ Analyze KPIs, trends, and risk visuals across dashboard pages
5️⃣ Use insights for trading decisions, risk reviews, or management reporting
No advanced Excel skills are required. If you can update data, you can use this dashboard confidently.
Who Can Benefit from This Derivatives Trading Dashboard in Excel 👥
✔ Traders and Trading Desk Heads
✔ Risk Management Teams
✔ Treasury and Finance Departments
✔ Portfolio and Asset Managers
✔ Compliance and Audit Teams
✔ CFOs, CROs, and Senior Leadership
Whether you manage a small derivatives book or a complex multi-asset portfolio, this dashboard adapts to your needs.
Click here to read the Detailed Blog Post
🔗 Visit our YouTube channel to learn step-by-step video tutorials
Visit our YouTube channel to learn step-by-step video tutorials


Reviews
There are no reviews yet.