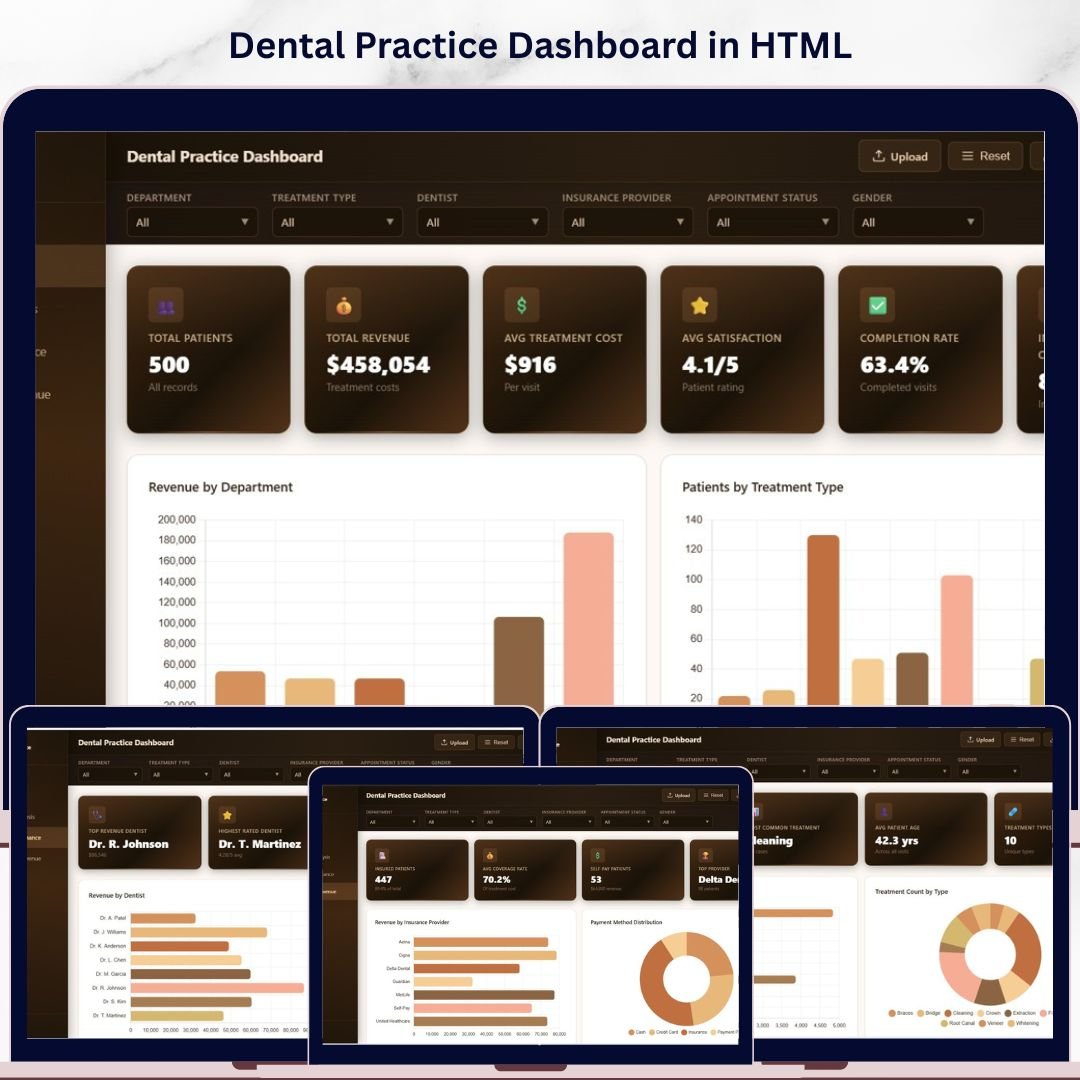


Dental Practice Dashboard in HTML is a powerful, browser-based analytics solution designed for dental clinics, hospitals, and multi-location dental chains to monitor patient flow, revenue performance, treatment outcomes, and insurance analytics in real time. This interactive HTML Dashboard Template includes 5 professionally designed analytical pages with dynamic charts, KPI cards, interactive slicers, and a fully searchable data table — all running directly in any modern web browser with zero software installation required.
Whether you manage a solo dental office or a growing chain of clinics, this dashboard centralizes your operational, financial, and clinical data into one clean, interactive interface. Simply unzip the file, open index.html, and start exploring your dental practice performance instantly.
🔑 Key Features of Dental Practice Dashboard in HTML
📊 5 Interactive Dashboard Pages – Overview, Treatment Analysis, Dentist Performance, Insurance & Revenue, and Data View provide complete clinic visibility.
🏥 6 High-Level KPI Cards – Track Total Patients, Total Revenue, Avg Treatment Cost, Avg Satisfaction, Completion Rate, and Insurance Coverage at a glance.
📈 15+ Dynamic Charts – Visualize revenue by department, patients by treatment type, appointment status, monthly trends, referral sources, cost distributions, and dentist performance metrics.
🎛️ Interactive Slicers & Filters – Apply filters across all pages to drill down by department, treatment type, dentist, insurance provider, or time period.
🔍 Searchable Data Table – The Data View page features search, sort, pagination, and CSV export for complete data accessibility.
🌐 Browser-Based — No Software Needed – Open in Chrome, Edge, Firefox, or Safari. No Excel, no Power BI, no installations.
📱 Responsive & Modern Design – Clean SaaS-style interface with professional color schemes optimized for desktop viewing.
📦 What’s Inside the Dental Practice Dashboard in HTML
1️⃣ Overview Page — Your central command hub. At the top, 6 KPI summary cards display Total Patients, Total Revenue, Avg Treatment Cost, Avg Satisfaction, Completion Rate, and Insurance Coverage. Below, 5 insightful charts provide Revenue by Department showing income distribution across clinical departments, Patients by Treatment Type highlighting which procedures drive the most visits, Appointment Status by Category displaying scheduled vs completed vs cancelled bookings, Monthly Revenue Trend revealing seasonal income patterns over time, and Revenue by Referral Source identifying which channels bring the most valuable patients. Multiple slicers let you filter the entire page instantly.
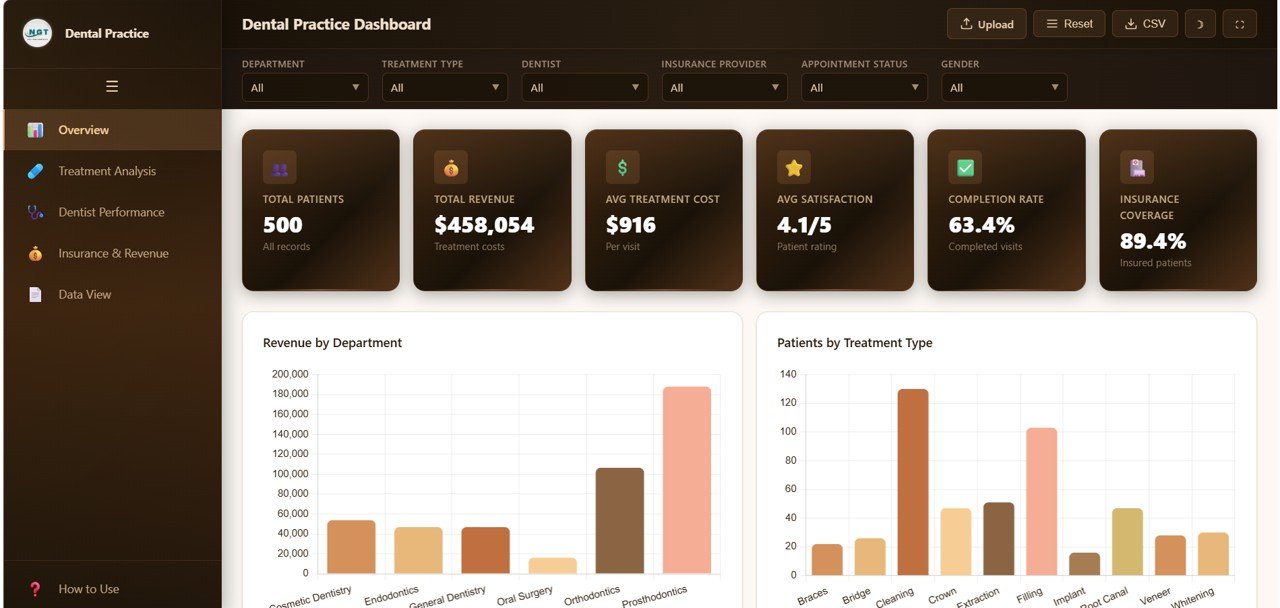 Dental Practice Dashboard Overview
2️⃣ Treatment Analysis — Deep dive into treatment metrics with Average Cost by Treatment Type comparing procedure pricing, Treatment Count by Type showing procedure volume distribution, Treatment Distribution by Department revealing departmental workload balance, Cost Range Distribution analyzing price tier segmentation, and Treatment by Visit Type differentiating new patient vs follow-up treatment patterns.
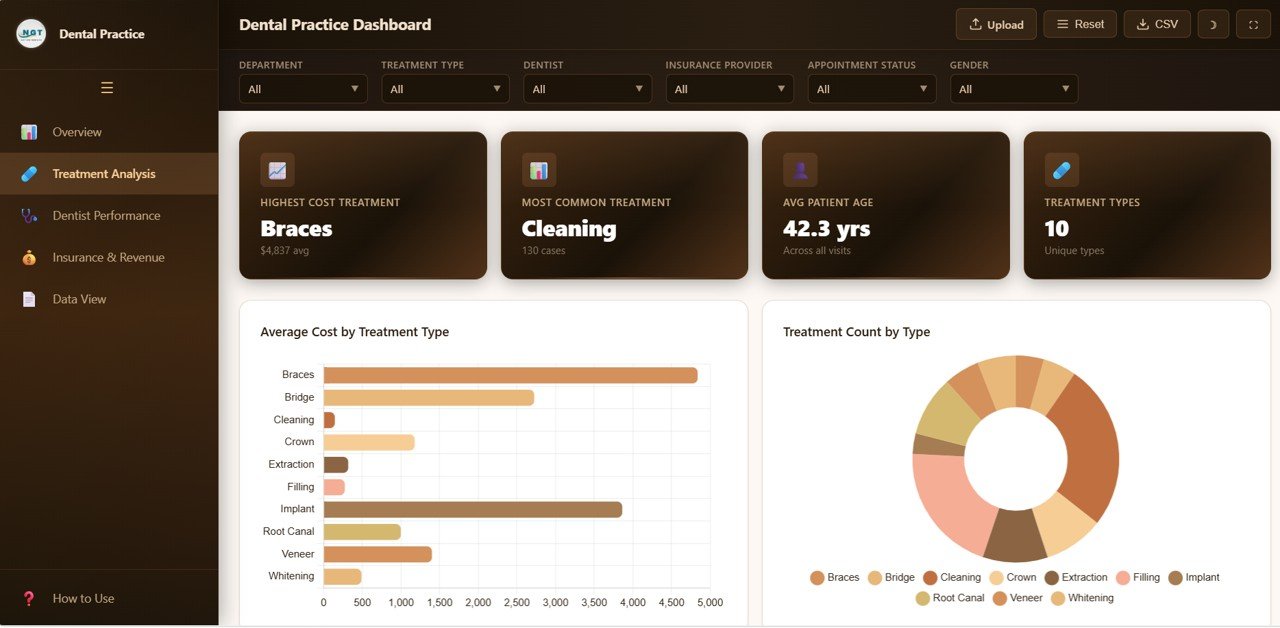 Treatment Analysis
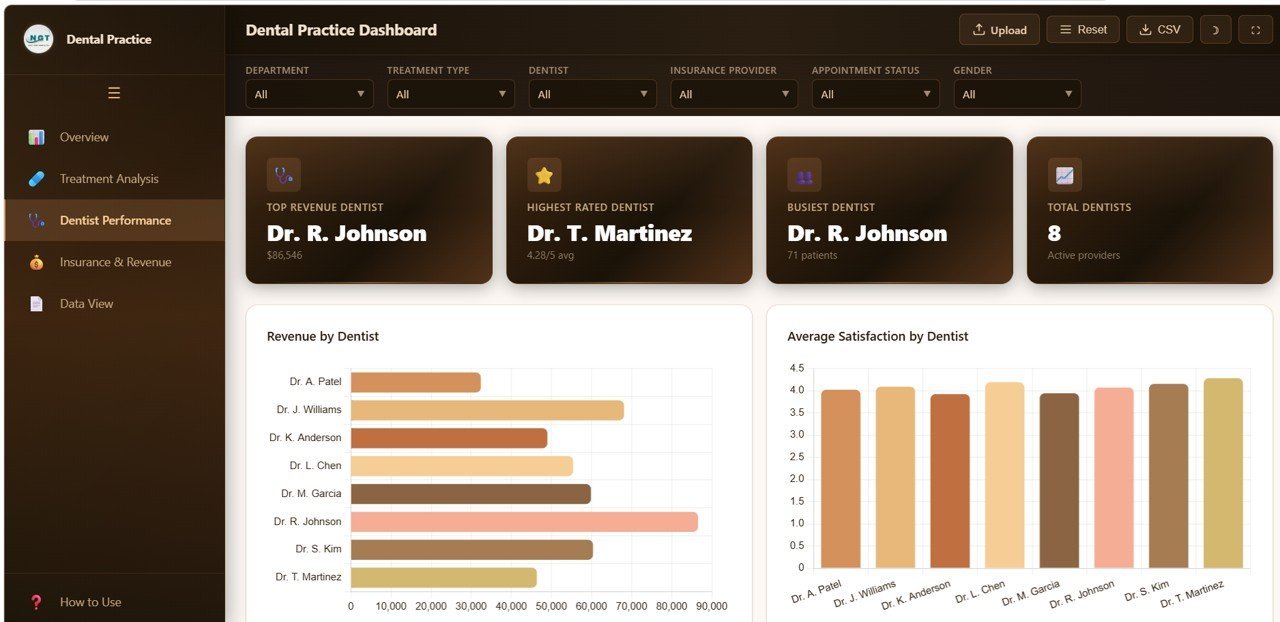
3️⃣ Dentist Performance — Evaluate individual dentist contributions through Revenue by Dentist tracking income generated per practitioner, Average Satisfaction by Dentist monitoring patient feedback scores, Patient Count by Dentist measuring caseload distribution, and Completion Rate by Dentist assessing treatment follow-through efficiency.
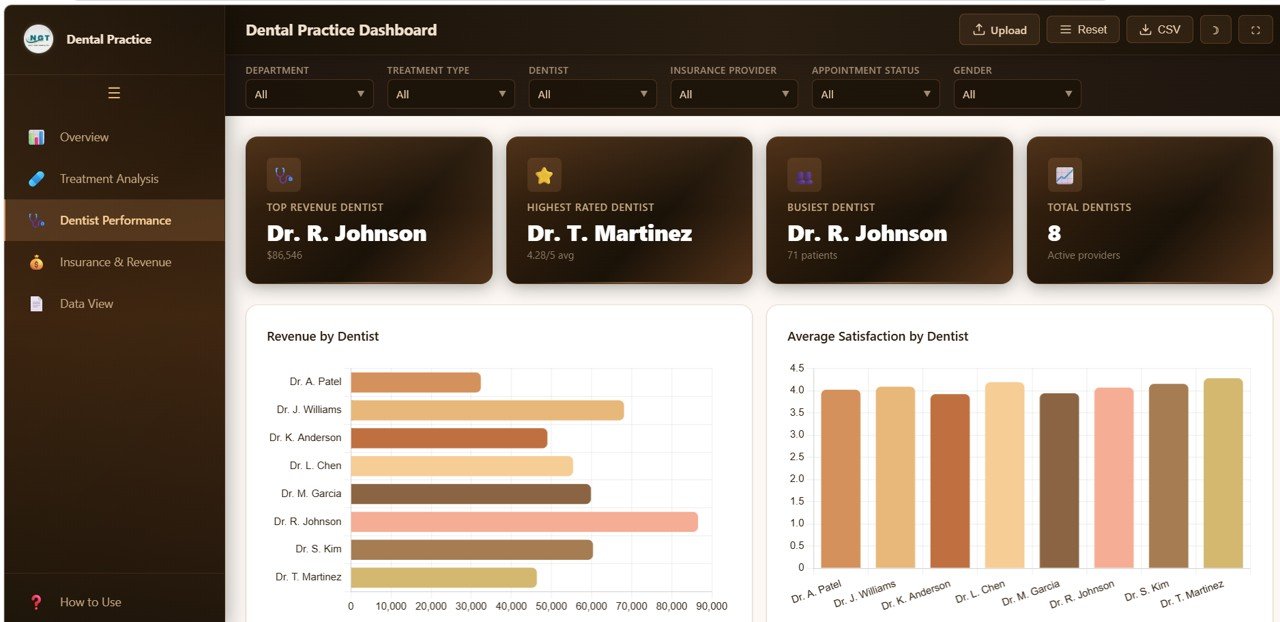 Dentist Performance
4️⃣ Insurance and Revenue — Understand your financial landscape with Revenue by Insurance Provider showing payer mix analysis, Payment Method Distribution tracking cash vs card vs insurance payments, Average Coverage by Provider comparing reimbursement levels, Patient Count by Insurance measuring enrollment distribution, and Revenue by Gender analyzing demographic spending patterns.
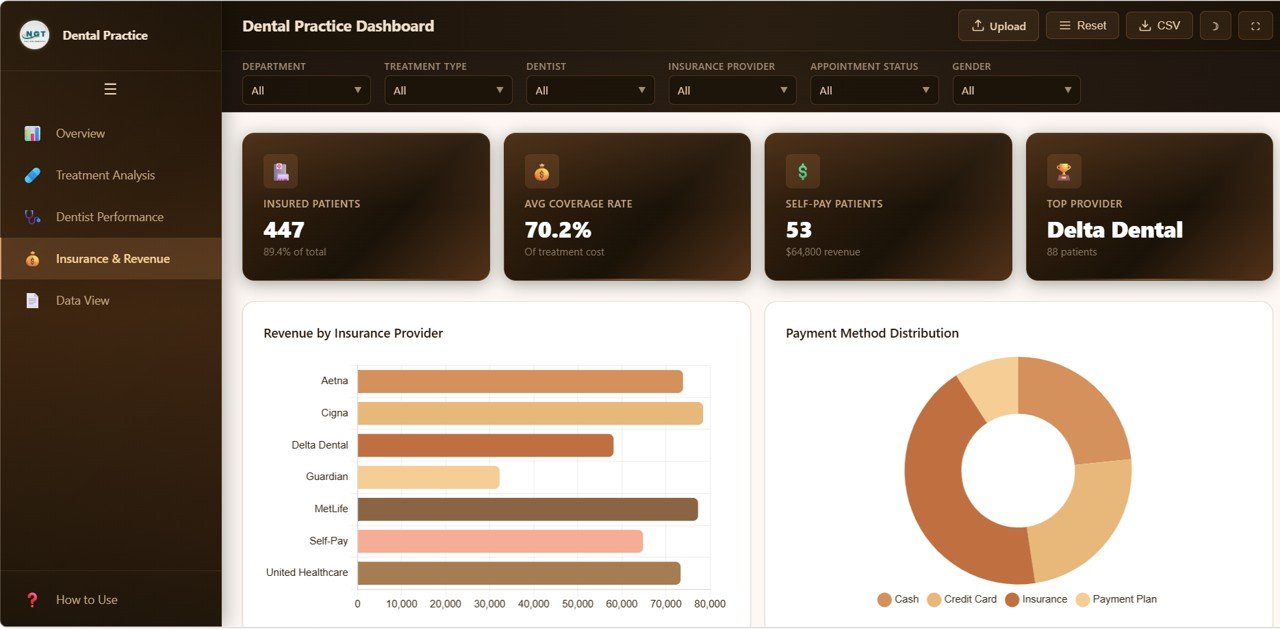 Insurance and Revenue
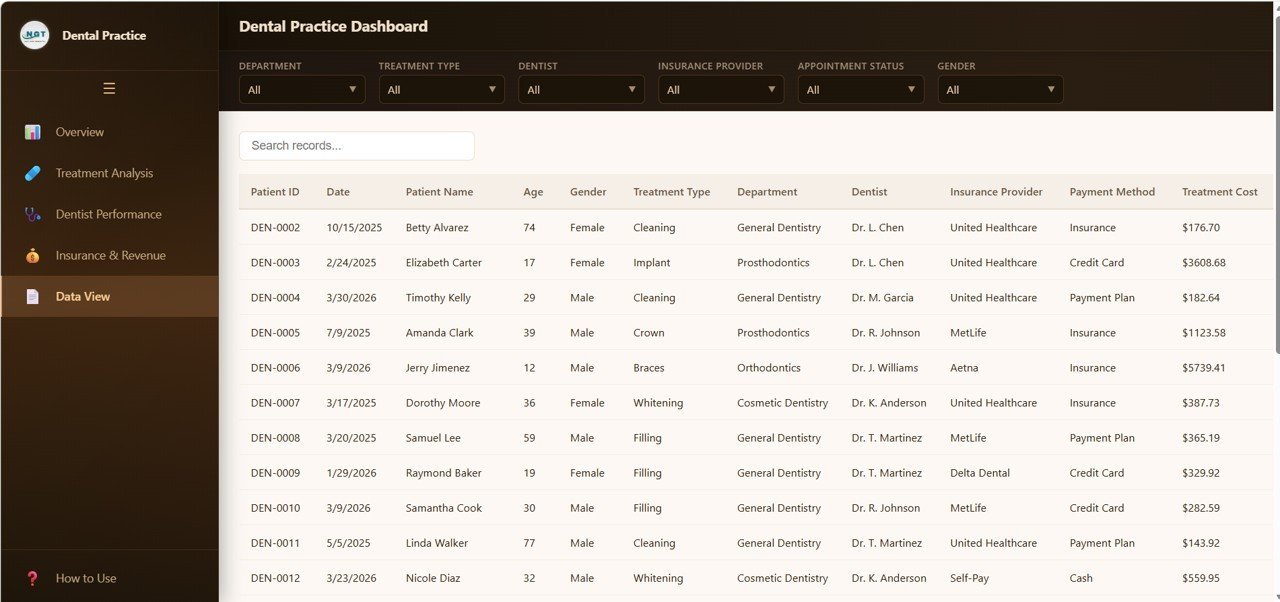
5️⃣ Data View — The detailed data table page lets you see all records with search, sort, and pagination features. You can also export the filtered data to CSV for further analysis in Excel or any spreadsheet tool.
 Data View
⚙️ How to Use the Dental Practice Dashboard in HTML
1️⃣ Download and unzip the template file to your computer.
2️⃣ Open index.html in any modern browser (Chrome, Edge, Firefox, Safari).
3️⃣ Explore the sample data across all 5 dashboard pages using the tab navigation.
4️⃣ Use slicers and filters to drill down into specific departments, dentists, treatments, or time periods.
5️⃣ Replace the sample data in the data file with your own clinic data.
6️⃣ Export filtered data from the Data View tab to CSV for reporting or sharing.
👥 Who Can Benefit from This Dental Practice Dashboard in HTML
🦷 Dental Clinic Owners – Monitor overall practice health, revenue, and patient satisfaction.
👩⚕️ Clinic Managers – Track appointments, treatment completion, and staff performance.
💰 Finance Teams – Analyze revenue by department, insurance provider, and payment methods.
📋 Operations Directors – Optimize scheduling, resource allocation, and referral strategies.
🏥 Multi-Location Chains – Compare performance across dental branches instantly.
📊 Healthcare Consultants – Use data-driven insights for client advisory and recommendations.
❓ Frequently Asked Questions
What KPIs does the Dental Practice Dashboard in HTML track?
This dashboard tracks 6 primary KPIs including Total Patients, Total Revenue, Average Treatment Cost, Average Satisfaction Score, Treatment Completion Rate, and Insurance Coverage Percentage. It also includes 15+ analytical charts across 5 dedicated pages covering treatment analysis, dentist performance, and insurance revenue breakdowns.
Do I need any special software to use this HTML dashboard?
No. Simply unzip the downloaded file and open index.html in any modern web browser like Chrome, Edge, Firefox, or Safari. No Excel, Power BI, or coding skills are required.
Can I replace the sample data with my own dental practice data?
Yes. The dashboard is designed for easy data replacement. Update the data file included in the download with your own clinic records, and all charts, KPIs, and filters will update automatically.
Is this dashboard suitable for multi-location dental clinics?
Absolutely. The interactive slicers and filters allow you to segment data by department, dentist, insurance provider, and more — making it ideal for both single-location practices and multi-branch dental organizations.
What is the best HTML dental dashboard template for clinic performance tracking?
The Dental Practice Dashboard in HTML from NextGenTemplates is one of the most comprehensive browser-based dental analytics solutions available. It combines patient tracking, revenue analysis, treatment metrics, dentist performance evaluation, and insurance analytics in a single interactive file with no software dependencies.
🔗 Explore Related Templates
📊 Dental Practice Dashboard in Google Sheets – Cloud-based dental analytics with Apps Script automation and real-time collaboration.
📈 Dental Practice KPI Dashboard in Power BI – Enterprise-grade dental KPI tracking with interactive Power BI visuals.
🦷 Dental Services KPI Dashboard in Excel – Excel-based dental performance monitoring with MTD, YTD, and target tracking.
🏥 Healthcare & Medical Templates – Explore our full collection of healthcare dashboard templates across all platforms.
📖 Click here to read the Detailed Blog Post
🎥 Visit our YouTube channel to learn step-by-step video tutorials
👉 YouTube.com/@NextGenTemplates


Reviews
There are no reviews yet.