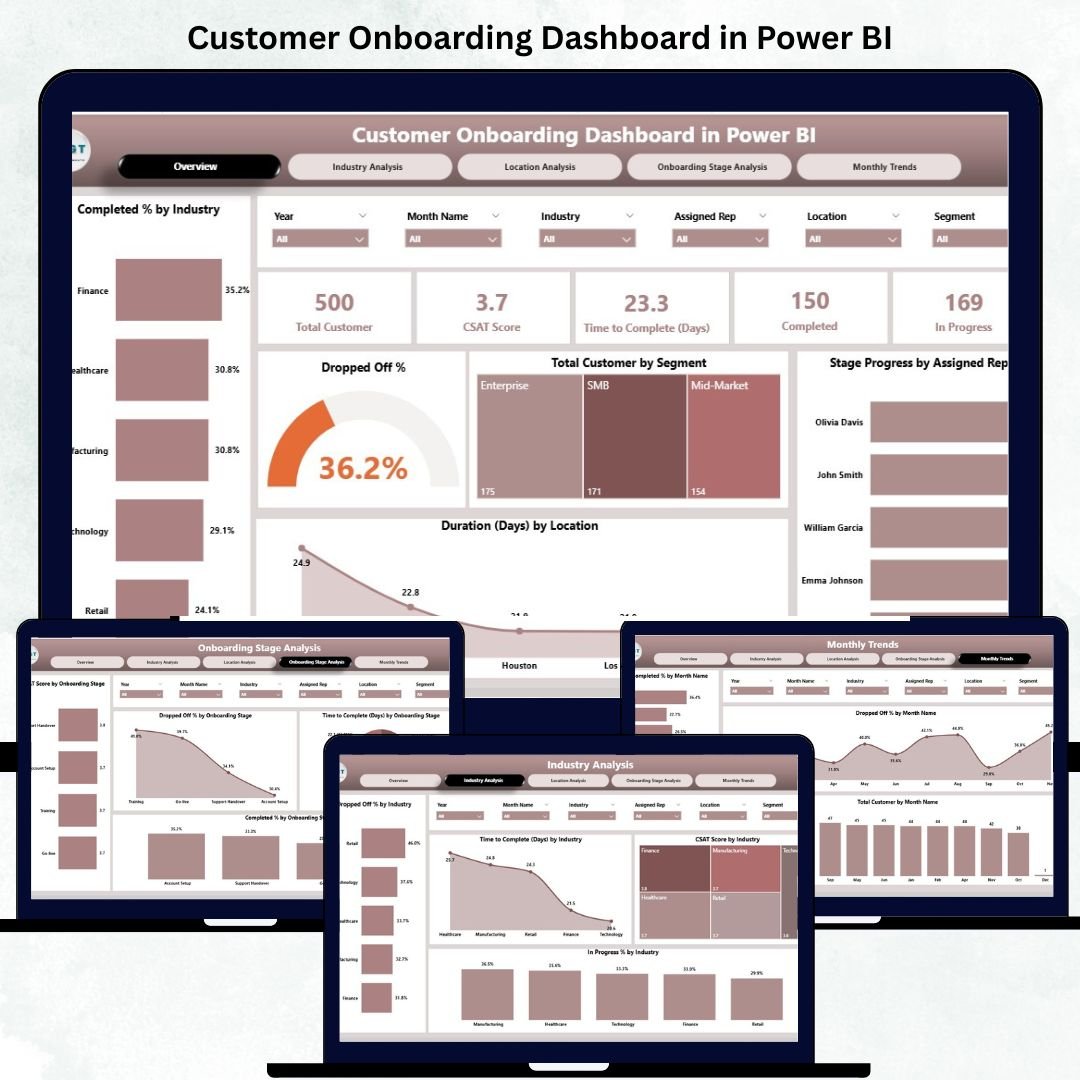

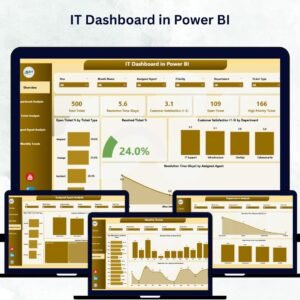
The Customer Onboarding Dashboard in Power BI is your all-in-one analytics companion for tracking, optimizing, and improving the customer onboarding experience. From first signup to final activation, this dashboard helps businesses visualize every stage of onboarding through interactive charts, KPIs, and time-based performance trends.
Whether you manage a SaaS product, retail client onboarding, or enterprise implementation, this Power BI dashboard transforms complex data into meaningful insights — helping you reduce drop-offs, shorten onboarding time, and boost customer satisfaction.
Built on Microsoft Power BI and connected to Excel or CRM systems, it’s a ready-to-use solution that brings clarity, accountability, and real-time visibility to your onboarding operations.
✨ Key Features of the Customer Onboarding Dashboard in Power BI
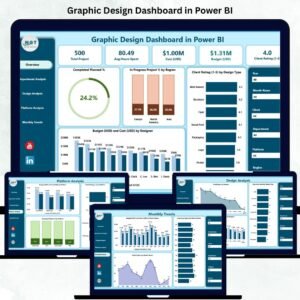
✅ 📊 Overview Page – The Central Performance Hub
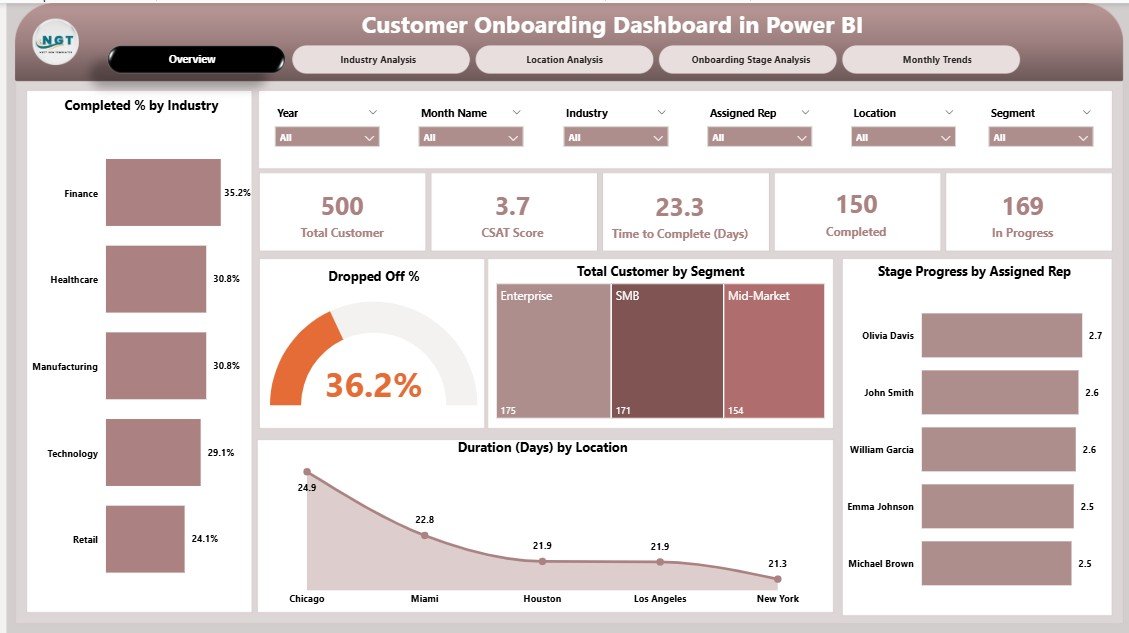
Get a real-time overview of the entire onboarding journey.
Includes:
-
5 KPI Cards: Total Customers Onboarded, In-Progress Customers, Completion Rate (%), Drop-Off Rate (%), and Average Onboarding Duration (Days).
-
Visuals: Completed % by Industry, Drop-Off %, Total Customers by Segment, Stage Progress by Representative, and Duration by Location.
🎯 Instantly identify which industries, reps, or regions deliver smooth onboarding and which require attention.
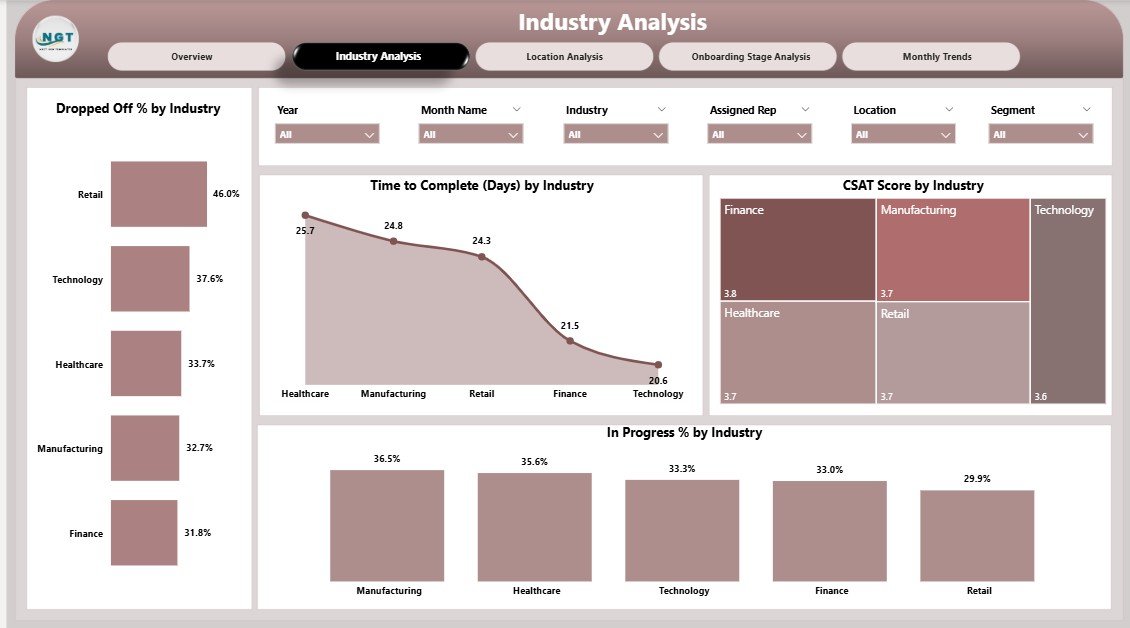
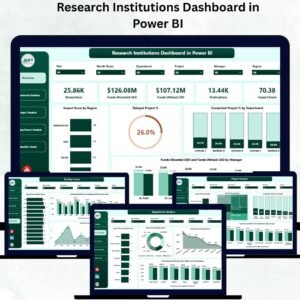
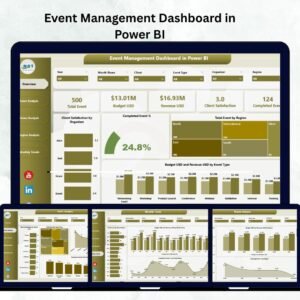
✅ 🏭 Industry Analysis Page – Compare Sectors Efficiently
Drill down into onboarding performance by industry.
Charts include:
-
Dropped-Off % by Industry
-
Time to Complete (Days) by Industry
-
CSAT (Customer Satisfaction) by Industry
💡 Helps you pinpoint industries that face bottlenecks or take longer to onboard.
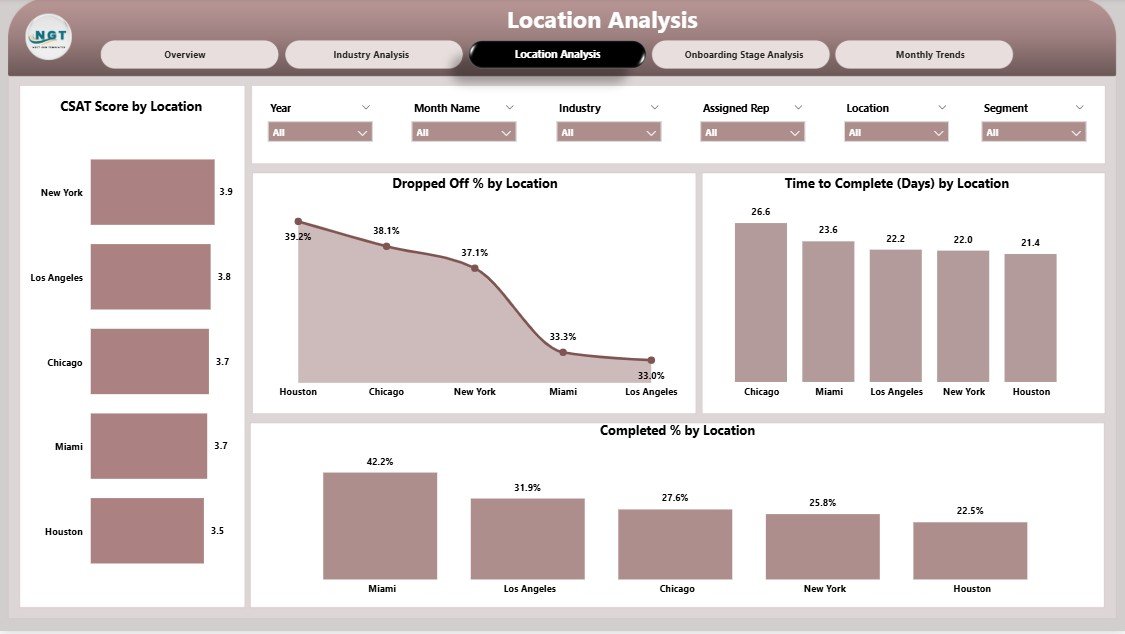
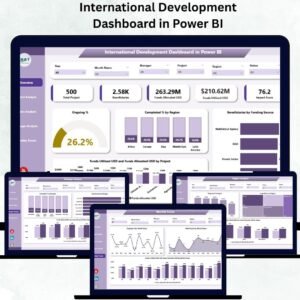
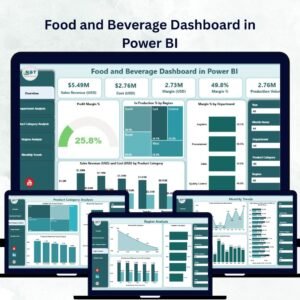
✅ 🌍 Location Analysis Page – Measure Global Efficiency
Analyze how onboarding differs by geography.
Includes visuals for Dropped-Off %, Completion %, Duration, and CSAT Score by Location.
Perfect for global teams tracking performance across branches, countries, or time zones.
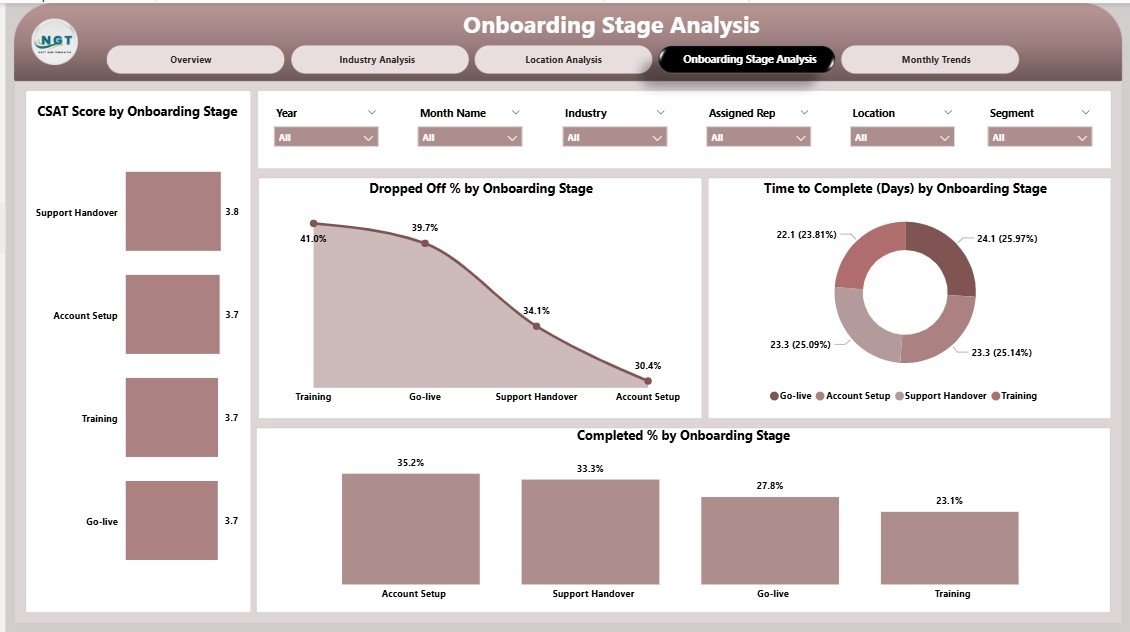
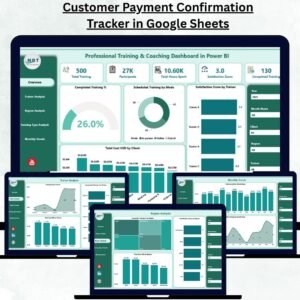
✅ 🧭 Onboarding Stage Analysis Page – Monitor Every Step
View onboarding performance stage by stage (Registration → Verification → Training → Go-Live).
Visuals include:
-
Dropped-Off % by Stage
-
Time to Complete (Days) by Stage
-
CSAT by Stage
-
Completion % by Stage
📈 Quickly identify where customers drop off or face delays and take targeted action.
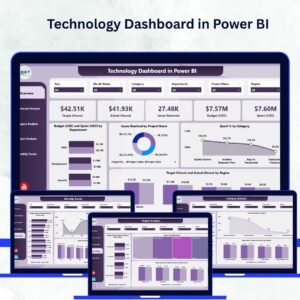
✅ 📅 Monthly Trends Page – Spot Time-Based Patterns
Understand onboarding performance across months.
Visuals: Dropped-Off %, Completed %, and Total Customers by Month.
🔄 Track how new strategies or process improvements impact onboarding efficiency over time.
✅ 🔗 CRM & Excel Integration – Connect data directly from Salesforce, HubSpot, or Excel.
✅ 💡 Interactive Filters – Filter by Month, Industry, Location, or Representative.
✅ 📈 Real-Time Monitoring – Refresh data anytime for up-to-date insights.
✅ 🧩 Fully Customizable – Add new KPIs or visuals effortlessly.
📦 What’s Inside the Customer Onboarding Dashboard
📁 Five Analytical Pages:
1️⃣ Overview Page – Quick KPIs and progress snapshot.
2️⃣ Industry Analysis Page – Compare onboarding by business sector.
3️⃣ Location Analysis Page – Measure performance across regions.
4️⃣ Stage Analysis Page – Detect bottlenecks in specific onboarding steps.
5️⃣ Monthly Trends Page – Evaluate time-based trends and improvements.
🎯 Core KPIs Tracked:
-
Completion Rate (%)
-
Drop-Off Rate (%)
-
Average Onboarding Duration (Days)
-
CSAT (Customer Satisfaction) Score
-
Stage Progress by Representative
📊 Design Highlights:
-
Clean visuals for quick insights.
-
Smart color coding (🟢 good, 🔴 needs improvement).
-
Left-side page navigator for smooth movement.
-
DAX-powered calculations for accuracy.
⚙️ How to Use the Customer Onboarding Dashboard
1️⃣ Connect Data: Import onboarding data from Excel, CRM, or ERP.
2️⃣ Navigate Pages: Start with the Overview Page for high-level KPIs.
3️⃣ Filter Results: Use slicers for Month, Industry, or Location.
4️⃣ Analyze Details: Drill down to industry or stage-level insights.
5️⃣ Spot Trends: Review monthly and yearly performance changes.
6️⃣ Share Insights: Publish the dashboard to Power BI Service for collaboration.
💡 Pro Tip: Set up automatic refreshes to always see live onboarding performance!
👥 Who Can Benefit from This Dashboard
🎯 Customer Success Teams – Track where customers drop off and act fast.
💬 Sales Teams – Understand activation timelines and improve follow-ups.
🧭 Operations & Onboarding Managers – Monitor rep-wise productivity.
📈 Executives & Decision-Makers – Get complete onboarding visibility for strategy.
🧠 Data Analysts – Visualize complex onboarding data instantly.
🏢 Enterprises & Startups – Align cross-departmental onboarding efforts.
From SaaS and finance to education and healthcare — any industry with customer activation workflows can gain from this dashboard.


Reviews
There are no reviews yet.