


Higher-education institutions handle thousands of data points daily — from tuition collections and faculty ratings to student satisfaction scores and placement results. Managing it all manually is exhausting. That’s why the Colleges & Universities Dashboard in Excel is your one-stop, ready-to-use analytics solution. 📊✨
Built entirely in Microsoft Excel, this dynamic template helps administrators, deans, and finance teams visualize, monitor, and analyze academic & operational performance in real time — no coding, no complex setup.
With interactive charts, slicers, and KPI cards, it transforms raw academic data into clear, actionable insights — helping institutions make data-driven decisions that enhance both teaching quality and financial health.
🌟 Key Features of the Colleges & Universities Dashboard
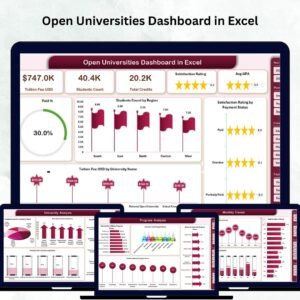
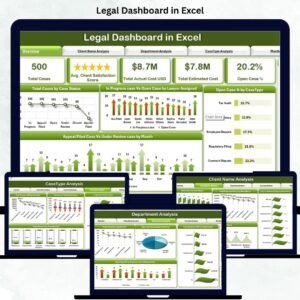
🏠 1️⃣ Overview Page – Institution-Wide Snapshot

The main dashboard brings everything together in one view.
Includes:
-
🎯 Five KPI Cards showing faculty rating, fee collection %, placement %, and more.
-
📊 Four Interactive Charts:
-
Faculty Rating by Program
-
Tuition Fee (USD) by College Type
-
High Placement Likelihood (%)
-
Fee Paid vs Fee Due by College Name
-
-
🧭 Left-Side Navigator for quick page switching.
💡 Purpose: Give leaders an instant overview of institutional health.
🏫 2️⃣ Department Analysis – Micro-Level Visibility
Evaluate departmental performance across teaching and finance.
Visuals Include:
-
Faculty Rating by Department
-
Tuition Fee Collected vs Due by Department
🎓 Benefit: Pinpoint strong and weak departments for targeted improvements.
🎓 3️⃣ College Analysis – Cross-Campus Comparison
Compare different colleges or branches under the same university.
Charts:
-
Faculty Rating by College Type
-
Tuition Fee (USD) by College Type
-
Fee Paid vs Fee Due (USD) by College Type
📈 Outcome: Detect trends in engagement and fee efficiency across campuses.
👩🏫 4️⃣ Designation Analysis – Faculty Performance Insights
Assess how faculty roles affect student outcomes.
Displays:
-
Student Satisfaction by Designation
-
Faculty Rating by Designation
-
Marks Scored by Designation
💬 Purpose: Recognize top performers and address training needs effectively.
📅 5️⃣ Month Analysis – Trend Monitoring Over Time
Track monthly patterns for academic and financial metrics.
Charts Featured:
-
Tuition Fee (USD) by Month
-
Fee Paid vs Fee Due by Month
📆 Use Case: Spot seasonal changes and forecast cash flow accurately.
📚 Support & Data Sheets – Back-End Automation
-
Support Sheet: Stores dropdowns and lookup lists for seamless interactivity.
-
Data Sheet: Holds raw data for students, faculty, and finances.
💾 Update the data and watch all charts refresh automatically!
💡 Advantages of Using This Dashboard
✅ Centralized Academic Data — Faculty, student, and finance metrics in one file.
✅ Data-Driven Decisions — See real trends and act with confidence.
✅ Time Efficiency — Automated reports replace hours of manual work.
✅ Financial Transparency — Track paid vs pending fees instantly.
✅ User-Friendly — Built for non-technical users in plain Excel.
✅ Customizable — Add KPIs like Attendance % or Placement Rate in minutes.
🧠 How This Dashboard Transforms Decision-Making
-
Monitor department and college-level performance.
-
Analyze faculty ratings and student satisfaction.
-
Track tuition collection and budget variance.
-
Visualize placement and academic growth trends.
-
Present data professionally in board and review meetings.
🧩 Best Practices
1️⃣ Keep data accurate and regularly updated.
2️⃣ Use consistent currency and naming formats.
3️⃣ Define clear KPI targets and review monthly.
4️⃣ Protect sensitive financial information.
5️⃣ Leverage Excel’s conditional formatting for quick visual alerts.
🧮 Why Excel Is Perfect for Academic Analytics
-
No additional software or subscription required.
-
Accessible and familiar to most users.
-
Works offline and on multiple devices.
-
Integrates with existing student and finance records.
-
Fully customizable to match your institution’s branding.
🏛️ Who Can Benefit
🎓 University Administrators – Strategic oversight of academic & financial KPIs.
👩🏫 Faculty Leaders – Track teaching performance by designation.
💰 Finance Teams – Monitor tuition collection and fee recovery.
📈 Data Analysts – Visualize trends for reports and accreditation.
🏫 Education Boards – Compare colleges across regions.


Reviews
There are no reviews yet.