The Change Agents Office Dashboard in Excel is your ultimate command center for driving organizational transformation with clarity and precision. Whether you’re managing change initiatives, tracking adoption rates, monitoring budget utilization, or reporting on transformation progress, this all-in-one Excel dashboard puts every critical metric at your fingertips in real time.
Change management doesn’t have to be chaotic. With the Change Agents Office Dashboard in Excel, your entire transformation ecosystem is condensed into one dynamic, sliceable, and fully interactive Excel workbook — no complex software, no IT tickets, no steep learning curve. Just open, enter your data, and your change management command center is live.
🔑 Key Features of Change Agents Office Dashboard in Excel
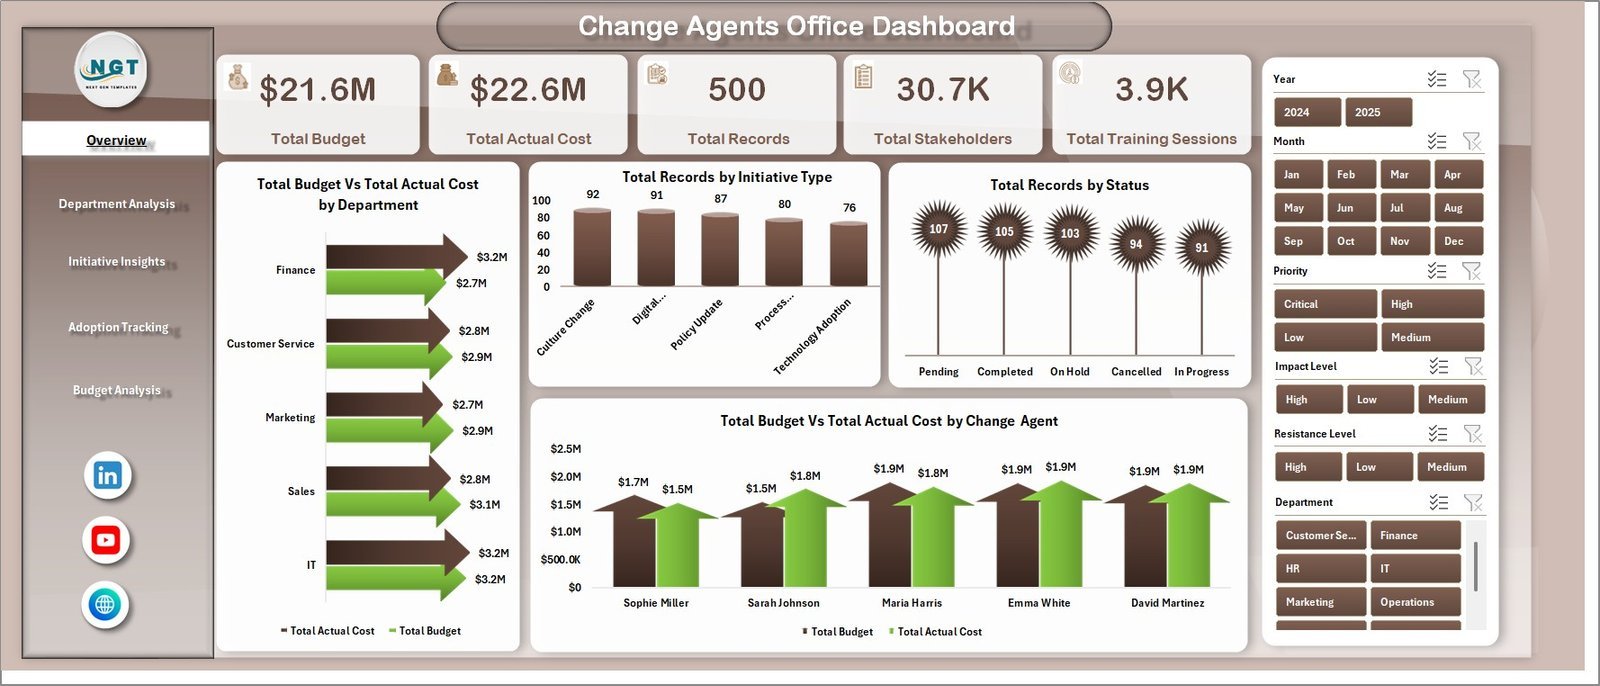
🔹 Dynamic Overview Page — Instantly monitor Total Budget, Total Actual Cost, Total Records, Total Stakeholders, and Total Training Sessions in one centralized KPI hub.
🔹 5 Interactive Dashboard Pages — From high-level overview to in-depth department, initiative, adoption, and budget analysis, every page delivers targeted insights.
🔹 Powerful Slicers & Filters — Slice data by department, initiative type, status, change agent, resistance level, and more to get the exact view you need instantly.
🔹 Structured Data Sheet — Simply update your records in the input sheet and all charts, cards, and visuals refresh automatically via pivot tables.
🔹 Support Sheet with Pivot Tables — Behind-the-scenes pivots power the entire dashboard dynamically with a single Refresh All click.
🔹 Ready-to-Use Template — Download, plug in your data, and go. Zero setup stress, no advanced Excel skills required.
🔹 Professional Design — Stunning visuals, color-coded indicators, and clean layouts perfect for board presentations and leadership updates.

Change Agents Office Dashboard
📦 What’s Inside the Change Agents Office Dashboard in Excel
📊 1. Overview Page — The high-level command center displaying KPI cards for Total Budget, Total Actual Cost, Total Records, Total Stakeholders, and Total Training Sessions. Visual charts include Total Budget vs Total Actual Cost by Department, Total Records by Initiative Type, Total Records by Status, and Total Budget vs Total Actual Cost by Change Agent — all backed by interactive slicers for instant filtering.
Department Analysis
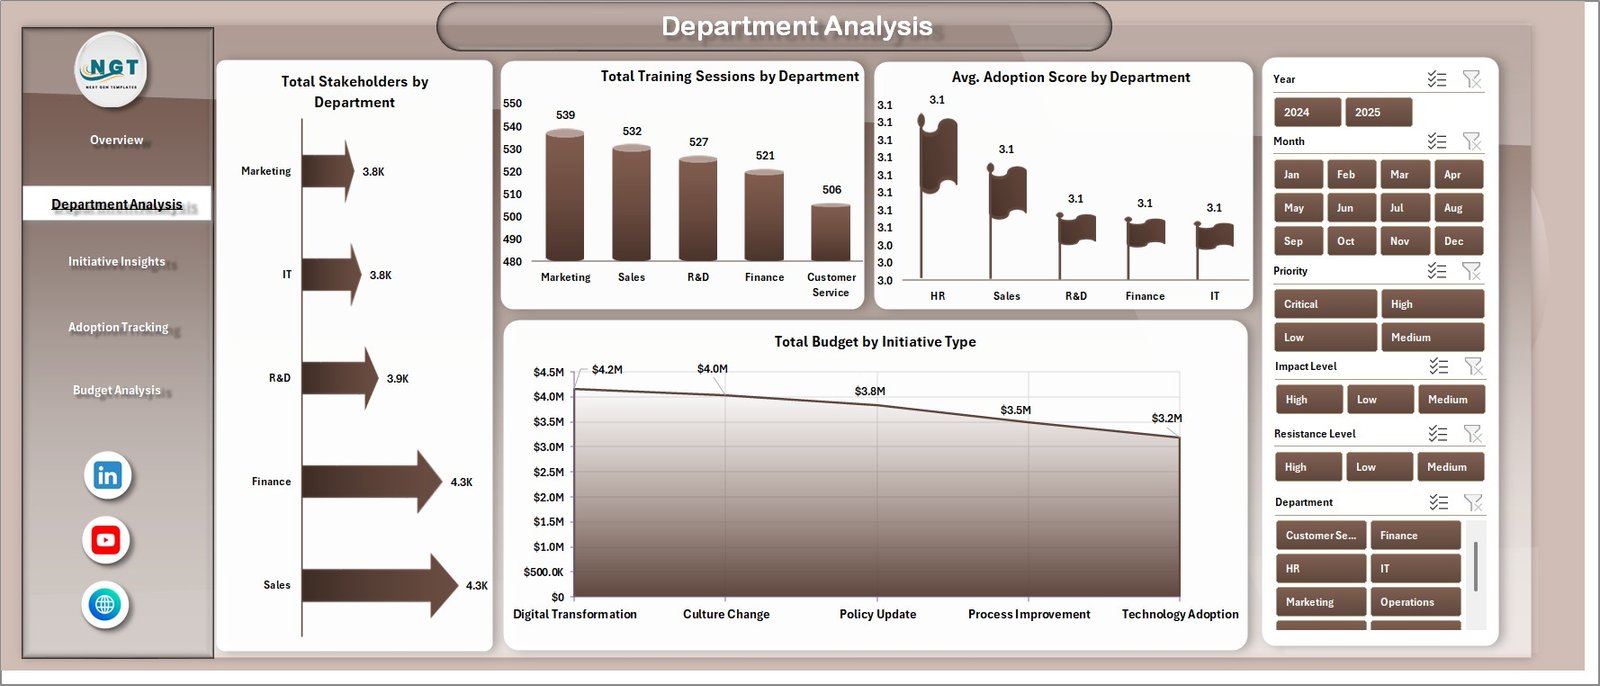
📊 2. Department Analysis Page — Drill into department-level performance across all key change metrics. Charts cover Total Stakeholders by Department, Total Training Sessions by Department, Avg. Adoption Score by Department, and Total Budget by Initiative Type — giving leaders a clear view of which departments are most engaged and best resourced for change.
Initiative Insights
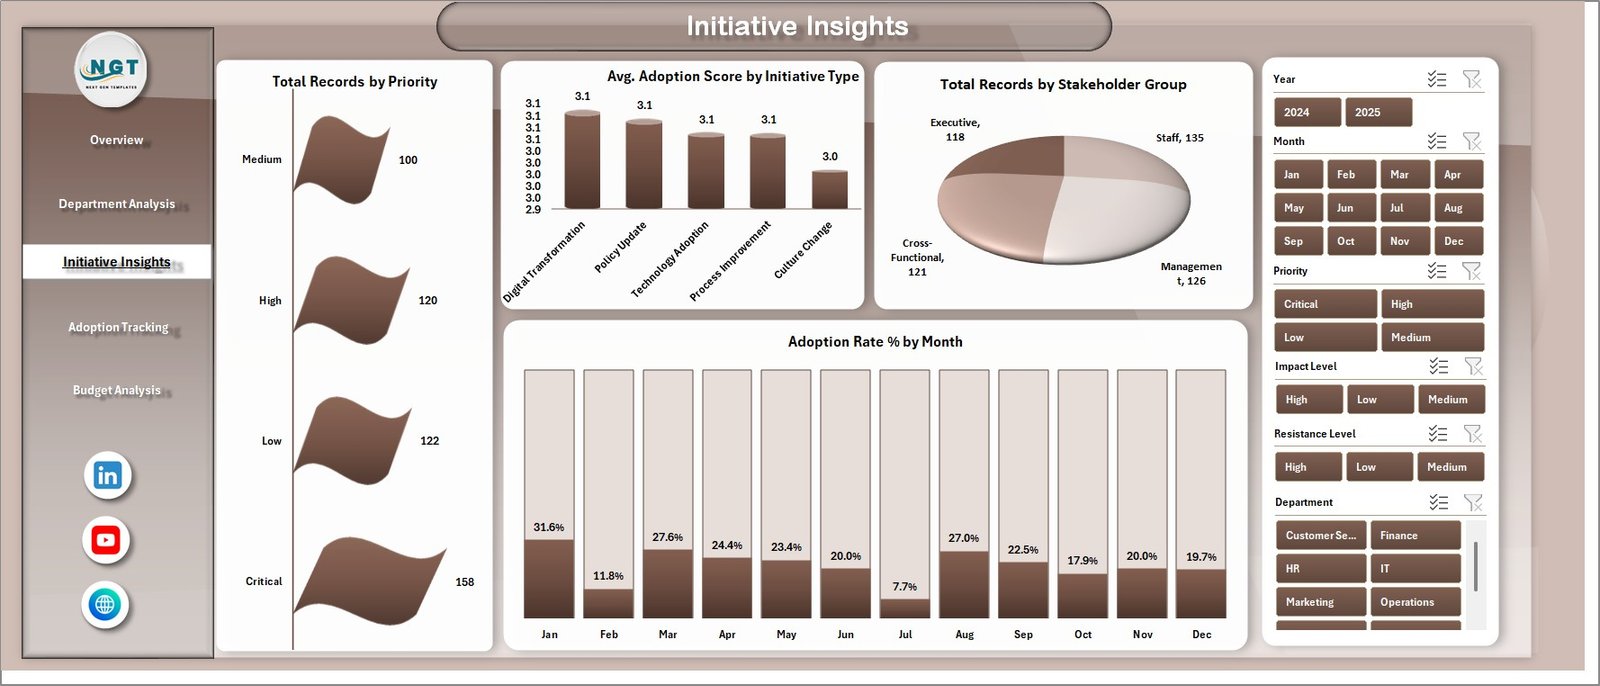
📊 3. Initiative Insights Page — Explore the health, priority, and adoption performance of every change initiative. Charts include Total Records by Priority, Avg. Adoption Score by Initiative Type, Total Records by Stakeholder Group, and Adoption Rate % by Month — giving program managers a complete picture of initiative momentum and adoption trends over time.
Adoption Tracking
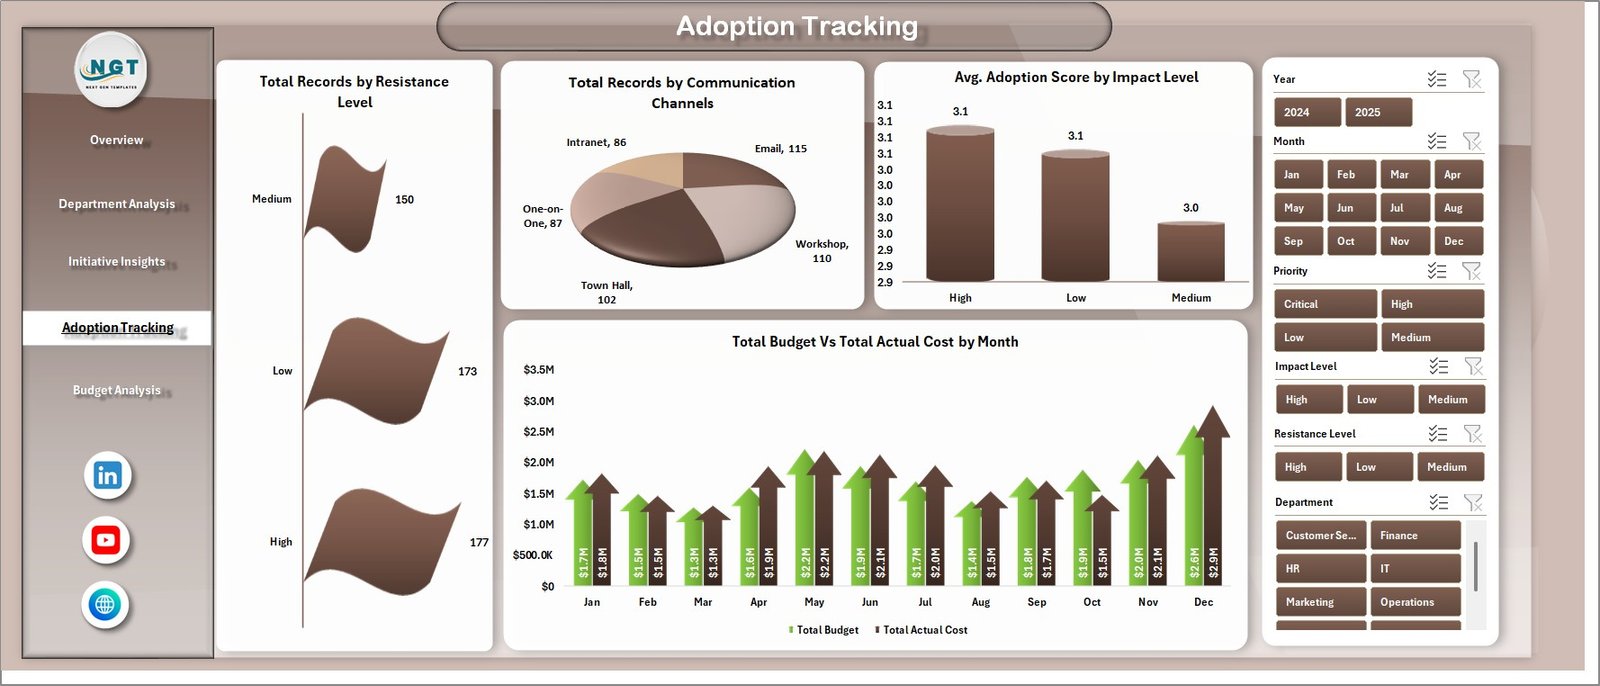
📊 4. Adoption Tracking Page — Measure resistance, communication effectiveness, and adoption quality across the organization. Charts include Total Records by Resistance Level, Total Records by Communication Channels, Avg. Adoption Score by Impact Level, and Total Budget vs Total Actual Cost by Month — the metrics that tell you whether change is actually being embraced on the ground.
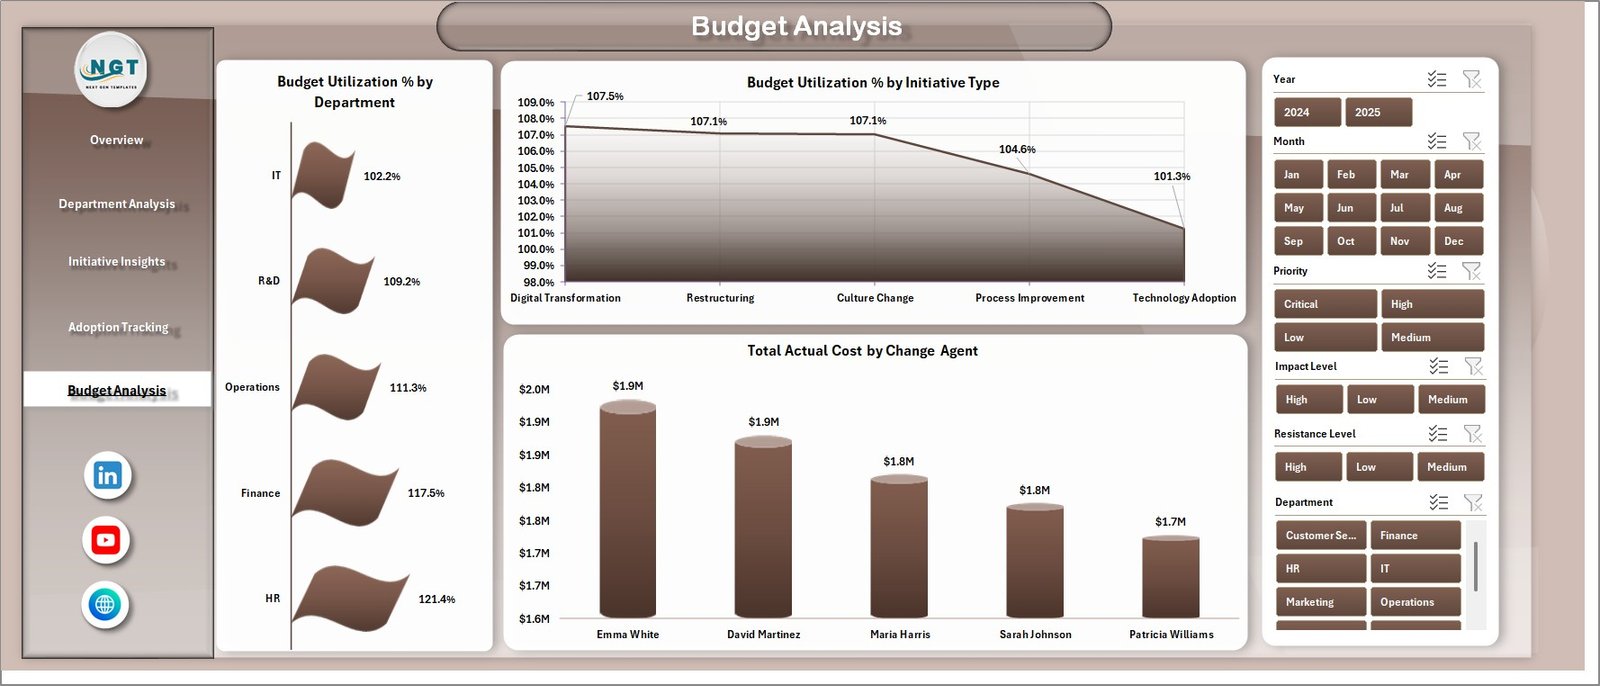
Budget Analysis
📊 5. Budget Analysis Page — Keep full control over change program spending. Charts include Budget Utilization % by Department, Budget Utilization % by Initiative Type, and Total Actual Cost by Change Agent — enabling finance teams and program directors to identify overspend, reallocate resources, and ensure the program stays within budget.
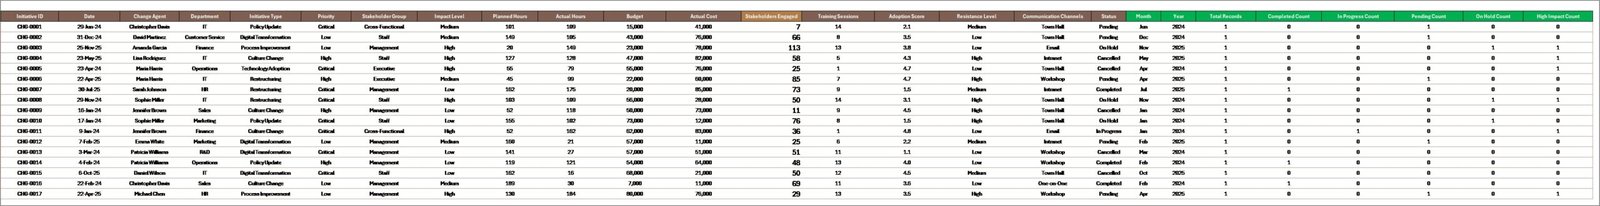
Data Sheet Tab
🗃️ 6. Data Sheet — The structured input area where you maintain all raw change management data. Update your records here and hit Refresh All to push updates across the entire dashboard instantly.
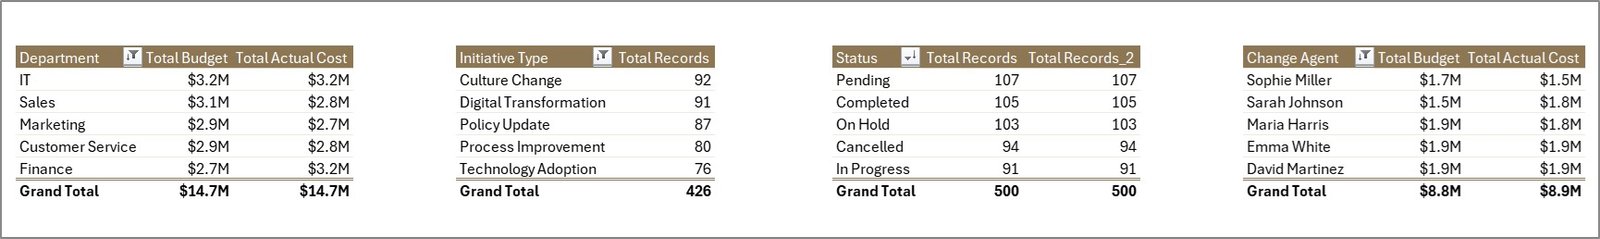
Support Sheet Tab
⚙️ 7. Support Sheet — Pivot tables that power the entire dashboard dynamically. You can keep this sheet hidden when presenting. Go to the Data tab in Excel and click Refresh All to update everything after any data change.
⚙️ How to Use the Change Agents Office Dashboard in Excel
1️⃣ Download the Excel file and open it in Microsoft Excel (2016 or later recommended)
2️⃣ Navigate to the Data Sheet and enter or paste your change management records
3️⃣ Go to the Data tab in the Excel ribbon and click “Refresh All” to update all pivot tables
4️⃣ Navigate to any dashboard page to see updated charts, KPIs, and visuals instantly
5️⃣ Use the slicers to filter data by department, initiative type, status, or change agent
6️⃣ Share or print any page directly for executive presentations and leadership reviews
👥 Who Can Benefit from This Change Agents Office Dashboard in Excel
🔹 Change Management Professionals managing organizational transformation programs
🔹 Operations Managers overseeing cross-functional change initiatives
🔹 HR Leaders tracking training sessions, adoption scores, and stakeholder engagement
🔹 Finance Teams monitoring budget utilization and actual cost variance
🔹 Project Managers monitoring initiative priorities, timelines, and resistance levels
🔹 C-Suite Executives requiring quick, clear visibility into enterprise-wide transformation
🔹 Consultants managing client-facing organizational change programs
📖 Click here to read the Detailed Blog Post
🎥 Visit our YouTube channel to learn step-by-step video tutorials
👉 YouTube.com/@NextGenTemplates


Reviews
There are no reviews yet.