The cement manufacturing industry generates massive volumes of operational and performance data every day. From production efficiency and plant utilization to cost management and quality monitoring, organizations must continuously analyze key metrics to remain competitive. However, many companies still depend on manual reports and disconnected spreadsheets, making performance analysis slow and inefficient.
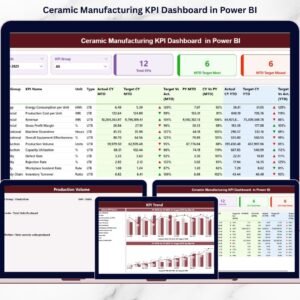
The Cement Products KPI Dashboard in Power BI is a modern, ready-to-use business intelligence solution designed to transform raw manufacturing data into interactive visual insights. Built using Microsoft Power BI, this dashboard enables cement companies to monitor key performance indicators (KPIs), analyze trends, and evaluate operational performance through dynamic visuals and automated calculations.
Instead of spending hours compiling reports, managers can view all KPIs within a centralized dashboard. With real-time filtering, automated comparisons, and visual indicators, decision-makers gain immediate clarity on performance status and improvement opportunities. 📊🏭
This dashboard connects directly with Excel data sources, allowing organizations to update performance numbers easily while Power BI automatically refreshes analytics. As a result, leaders move from reactive reporting to proactive, data-driven decision-making.
Whether used for plant operations, executive reviews, or strategic planning, this dashboard delivers powerful insights that help cement companies improve productivity, control costs, and enhance operational efficiency.
Key Features of Cement Products KPI Dashboard in Power BI
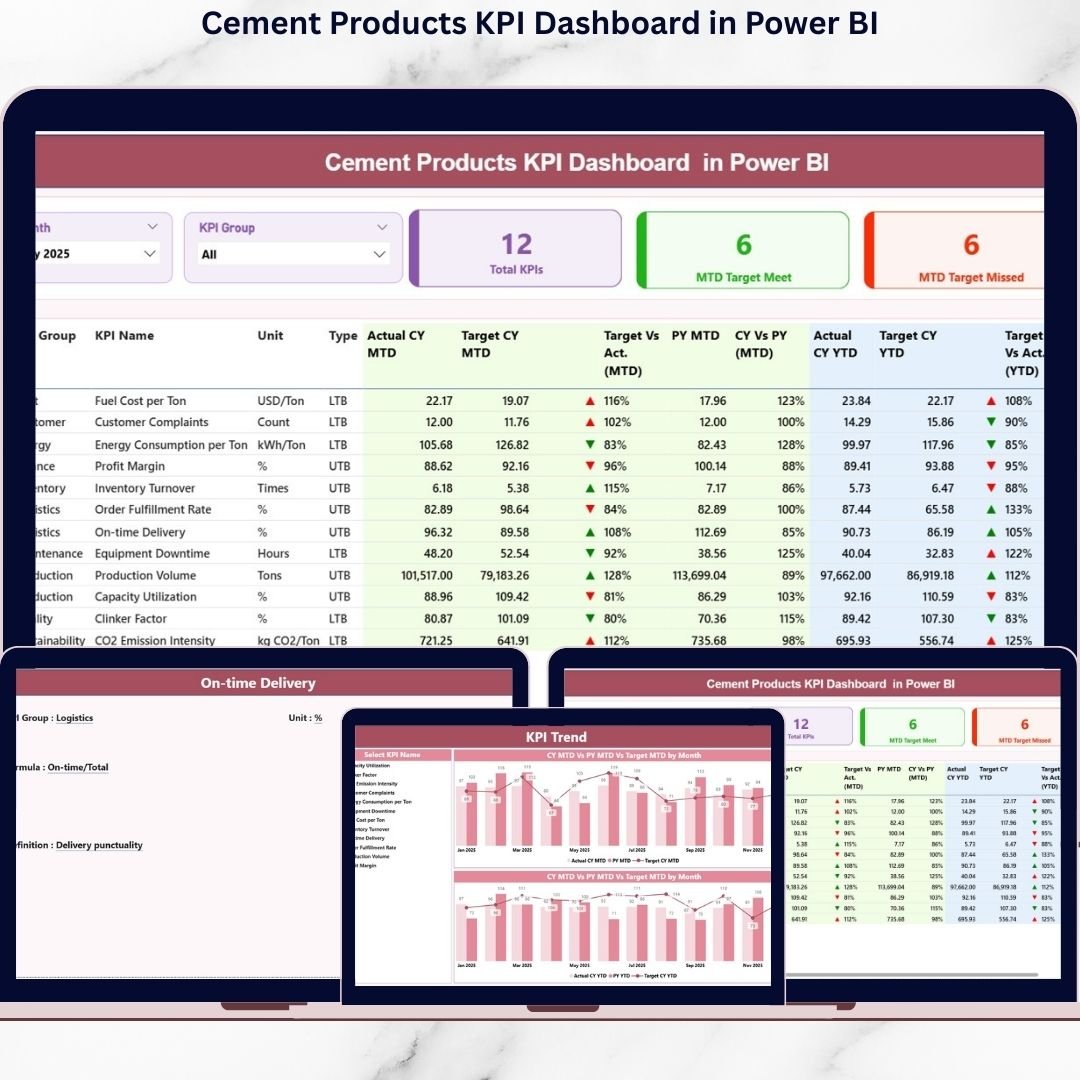
📊 Interactive KPI Summary Dashboard – Monitor all manufacturing KPIs from one centralized interface.
🎛️ Dynamic Slicers & Filters – Analyze performance by Month or KPI Group instantly.
🎯 MTD & YTD Performance Analysis – Compare short-term and long-term results together.
📈 Actual vs Target Comparison – Evaluate performance gaps using automated calculations.
🔄 Previous Year Benchmarking – Measure improvement with year-over-year comparisons.
🟢 Visual KPI Status Indicators – Icons instantly highlight performance achievements or issues.
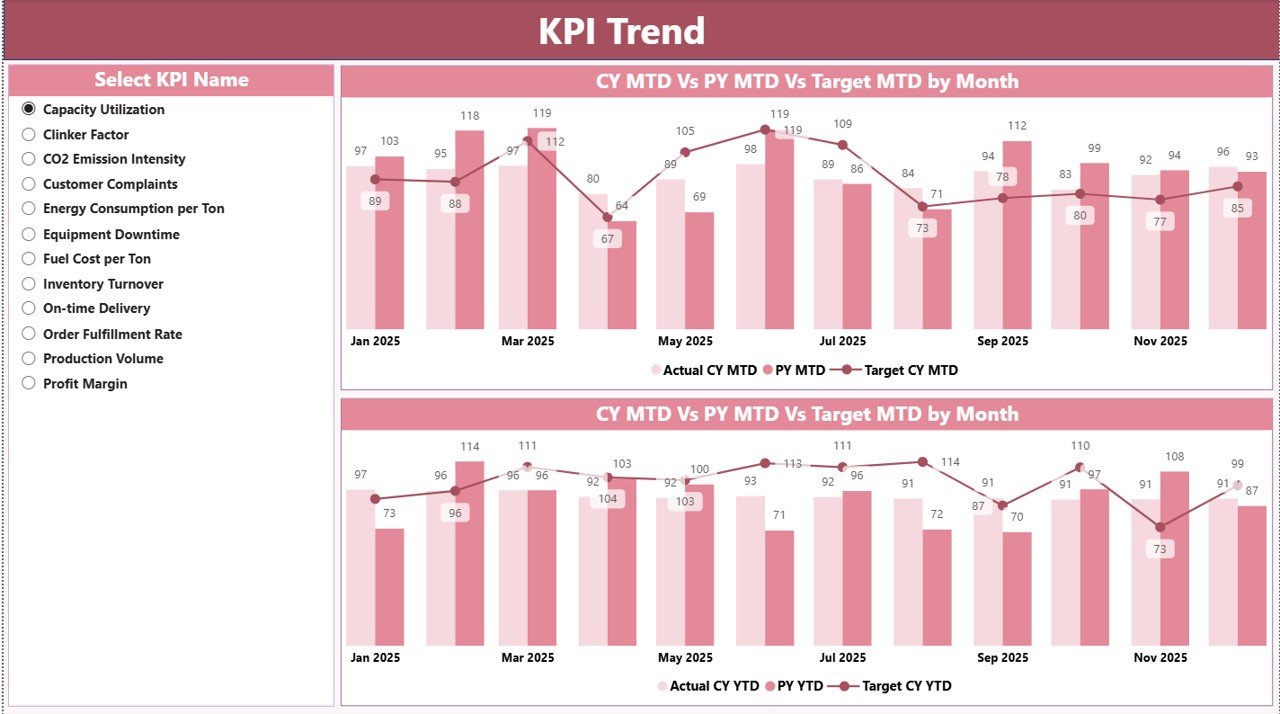
📉 Advanced Trend Analysis – Combo charts reveal performance patterns over time.
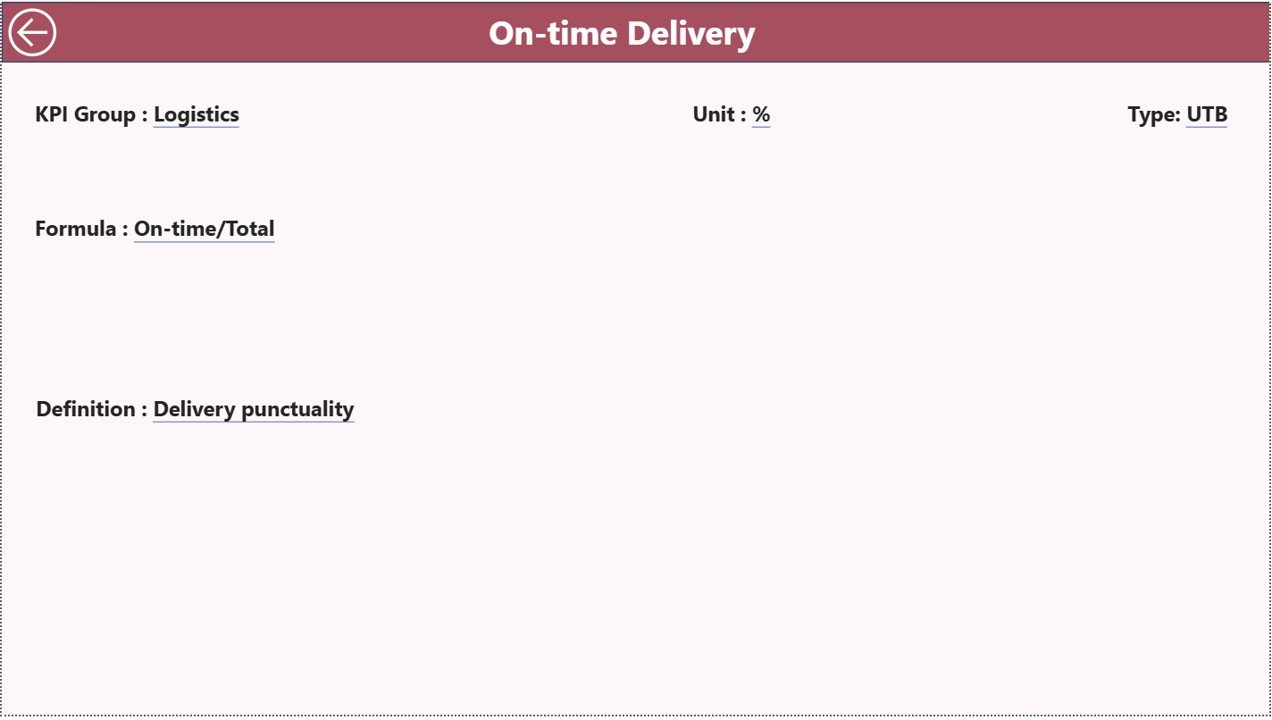
🔍 Drill-Through KPI Definitions – Access formulas and KPI logic directly within the dashboard.
These features convert complex cement production data into clear, actionable analytics.
What’s Inside the Cement Products KPI Dashboard in Power BI
The Power BI file includes three professionally designed interactive pages:
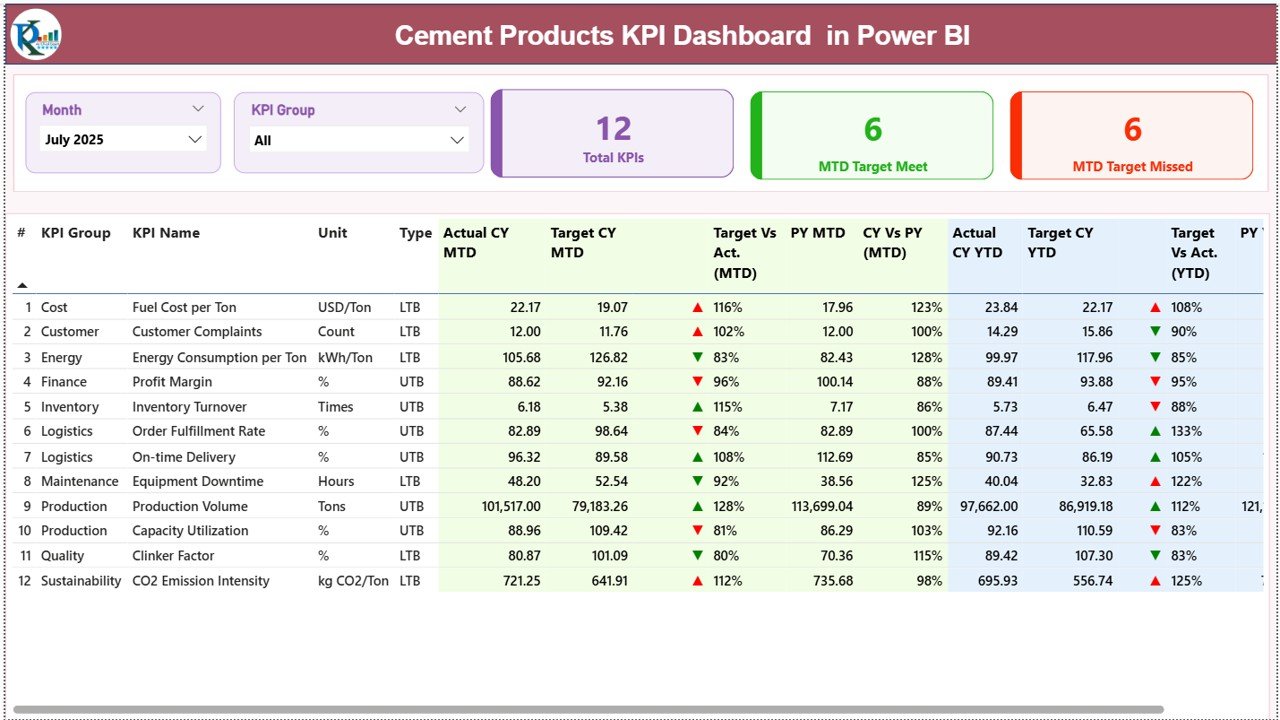
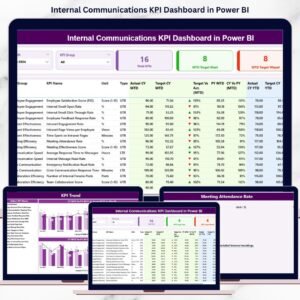
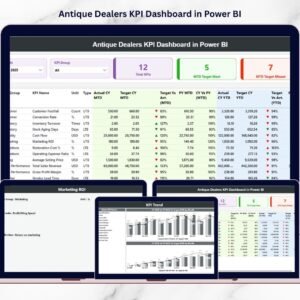
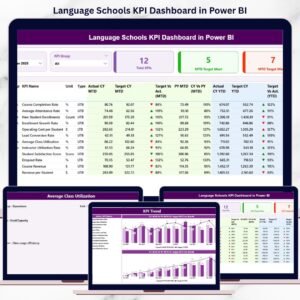
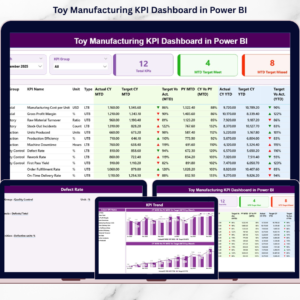
✅ Summary Page – Central KPI monitoring hub with performance cards, slicers, and detailed KPI tables.
✅ KPI Trend Page – Visual analysis showing Actual vs Target vs Previous Year trends for MTD and YTD performance.
✅ KPI Definition Page – Drill-through page displaying KPI formulas, definitions, and classifications.
Additionally, the dashboard connects to structured Excel data sources:
📂 Input_Actual Sheet – Stores actual KPI performance values.
📂 Input_Target Sheet – Contains target performance metrics.
📂 KPI Definition Sheet – Maintains standardized KPI information.
This integrated structure ensures accurate and scalable reporting.
How to Use the Cement Products KPI Dashboard in Power BI
Using the dashboard is simple and efficient:
1️⃣ Update KPI actual and target data in the Excel source file.
2️⃣ Maintain KPI definitions for consistent measurement.
3️⃣ Refresh the Power BI dataset.
4️⃣ Use slicers to filter Month or KPI Group.
5️⃣ Analyze KPI trends visually.
6️⃣ Drill through for detailed KPI explanations.
Within minutes, users gain complete visibility into manufacturing performance.
Who Can Benefit from This Cement Products KPI Dashboard in Power BI
This dashboard is ideal for:
🏭 Plant managers and production leaders
📊 Operations and performance analysts
💰 Finance and cost management teams
🚚 Supply chain and logistics managers
📈 Business executives and decision-makers
💻 Business intelligence teams
From operational monitoring to executive reporting, the dashboard supports all decision levels.
Modern manufacturing requires real-time insights, not delayed reports. By combining Power BI analytics with structured Excel data, the Cement Products KPI Dashboard in Power BI empowers organizations to monitor performance dynamically and act faster.
Instead of analyzing static spreadsheets, your team gains interactive analytics that improve transparency, accountability, and strategic planning. The result is smarter decisions, optimized operations, and stronger business performance. ✅
### Click here to read the Detailed blog post
Visit our YouTube channel to learn step-by-step video tutorials:
👉 YouTube.com/@PKAnExcelExpert