Business transformation is not a one-time project anymore—it is a continuous, evolving journey. Organizations must constantly track strategy execution, process improvements, and performance outcomes to stay competitive. However, without the right visibility, transformation efforts quickly lose direction. That is exactly where the Business Transformation KPI Dashboard in Power BI becomes a game-changing solution.
This ready-to-use Power BI dashboard gives leaders, transformation teams, and decision-makers a clear, structured, and real-time view of transformation performance. Instead of juggling multiple spreadsheets, reports, and presentations, you get a single, centralized dashboard that shows where transformation is succeeding and where corrective action is needed.
Built with interactive visuals, slicers, and KPI indicators, this dashboard turns complex transformation data into clear, actionable insights—helping organizations move from reactive monitoring to proactive decision-making.
🚀 Key Features of Business Transformation KPI Dashboard in Power BI
📊 Centralized KPI Monitoring
Track all business transformation KPIs in one Power BI report instead of scattered files.
📅 MTD & YTD Performance Tracking
Monitor short-term execution using Month-to-Date metrics and long-term progress with Year-to-Date analysis.
🎯 Target vs Actual Comparison
Instantly identify target achievements and misses with percentage comparisons and visual indicators.
🔄 Current Year vs Previous Year Analysis
Measure improvement trends by comparing current performance with prior year results.
🎛️ Interactive Slicers & Filters
Slice data by Month, KPI Group, or individual KPI to focus on what matters most.
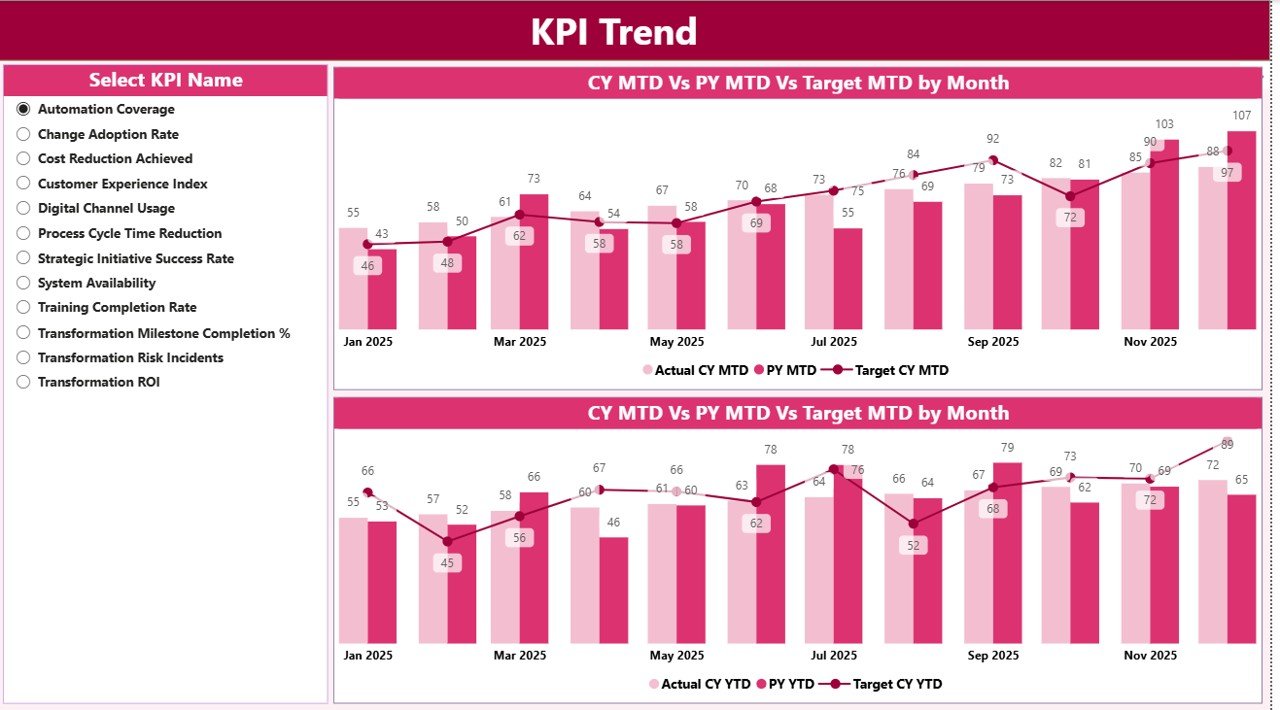
📈 Dynamic Trend Analysis
Visualize MTD and YTD trends to detect early warning signs or sustained improvements.
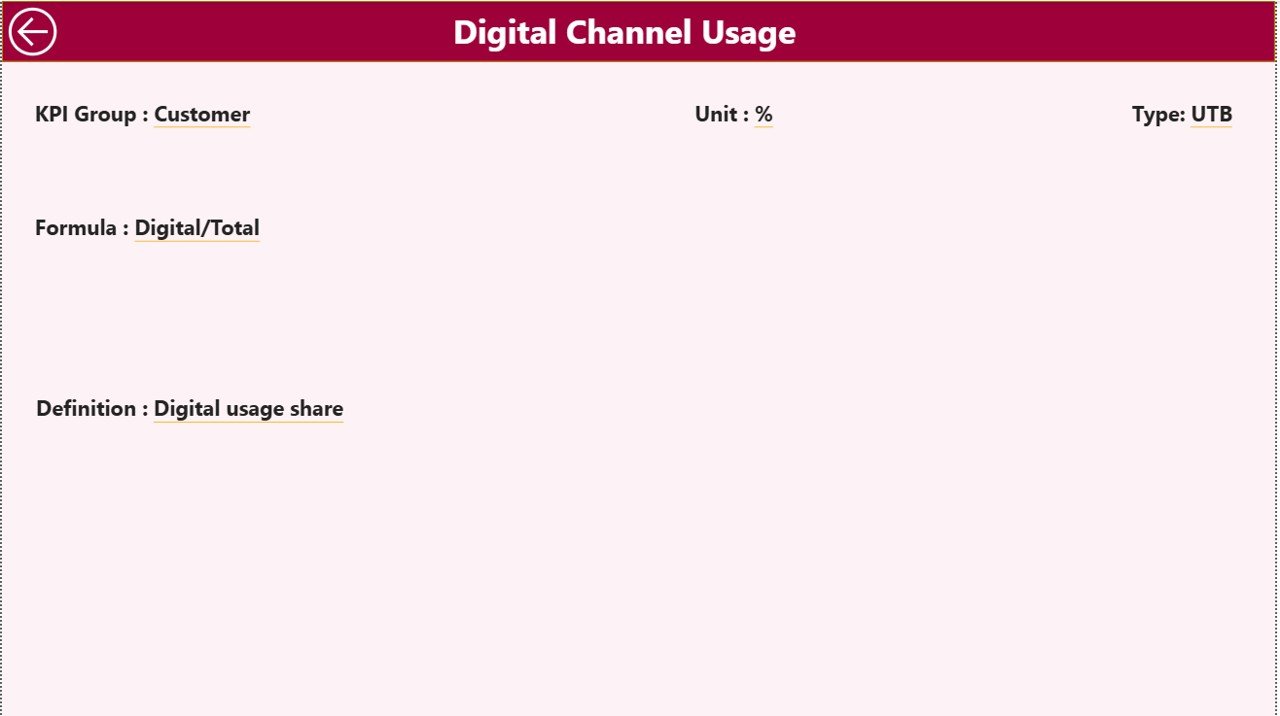
🔍 Drill-Through KPI Definitions
Access KPI formulas, definitions, units, and types without leaving the dashboard.
📦 What’s Inside the Business Transformation KPI Dashboard
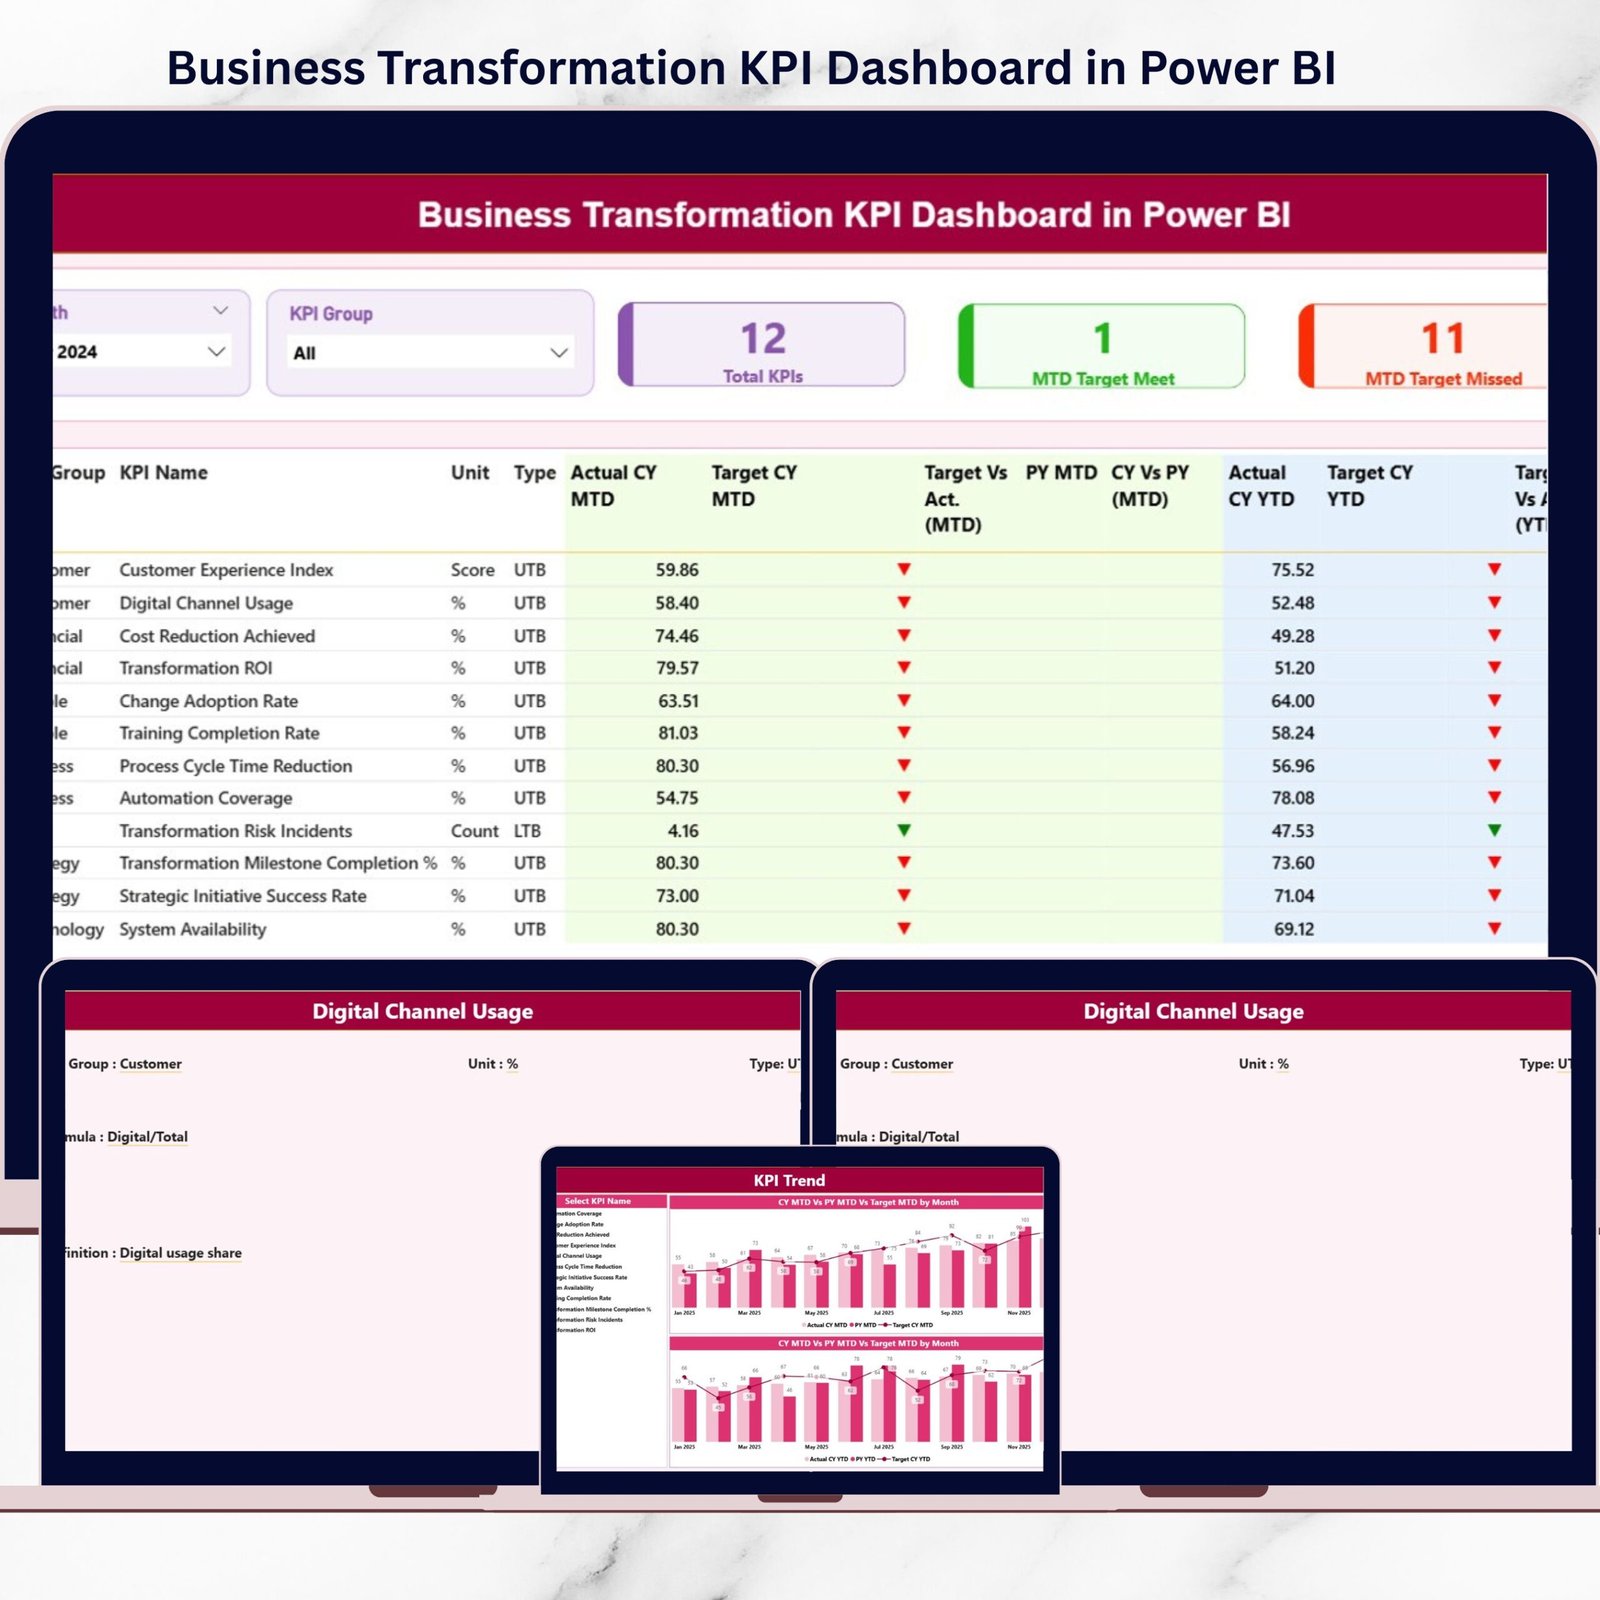
🧩 Summary Dashboard Page
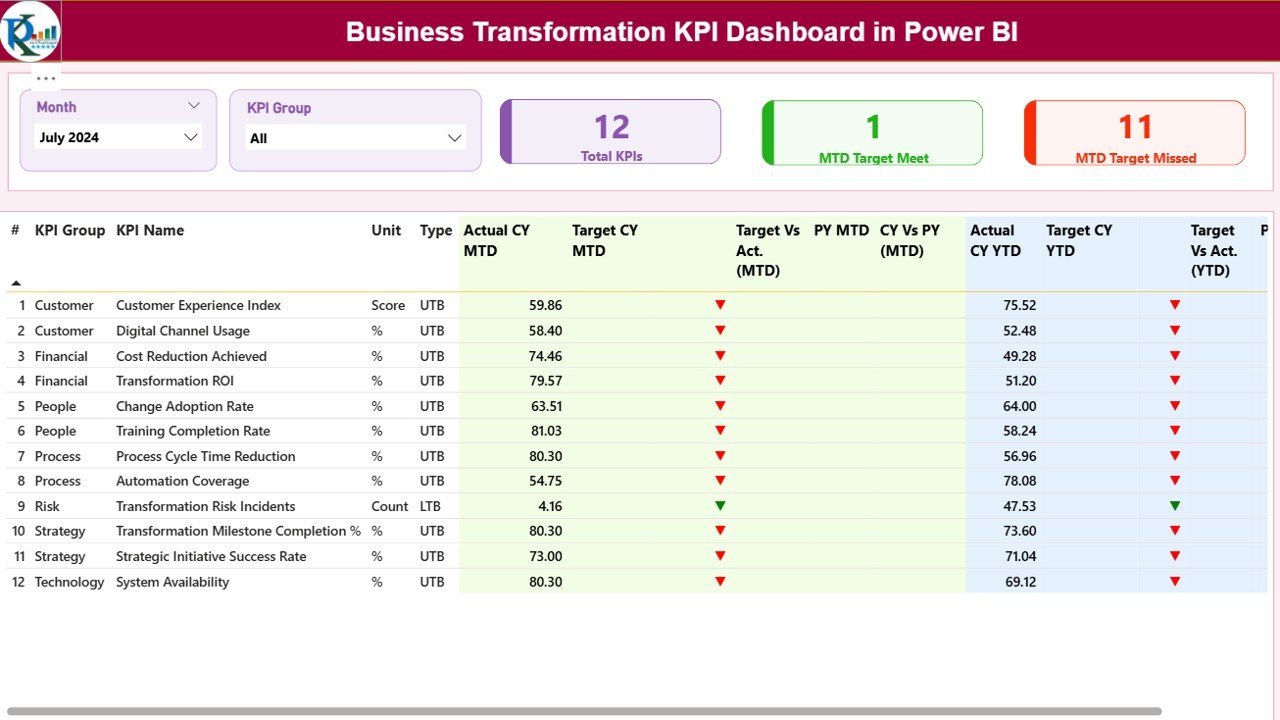
A high-level snapshot showing total KPIs, target met count, and target missed count with slicers for quick filtering.
📋 Detailed KPI Performance Table
A powerful table displaying KPI group, unit, type (LTB/UTB), MTD & YTD actuals, targets, icons, and comparisons.
📊 KPI Trend Analysis Page
Dedicated trend visuals for selected KPIs, comparing actuals, targets, and previous year values.
📘 KPI Definition Drill-Through Page
A hidden documentation page that explains each KPI clearly, eliminating confusion.
📂 Excel Data Source Structure
Well-designed Excel sheets for Actuals, Targets, and KPI Definitions—simple to update and maintain.
🧭 How to Use the Business Transformation KPI Dashboard
1️⃣ Update actual and target values in the Excel input sheets
2️⃣ Refresh the Power BI dashboard
3️⃣ Select Month and KPI Group using slicers
4️⃣ Review KPI cards and performance tables
5️⃣ Analyze trends for deeper insights
6️⃣ Drill through to KPI definitions when needed
No advanced Power BI skills required—business users can manage updates easily.
👥 Who Can Benefit from This Business Transformation KPI Dashboard
✅ CEOs & CXOs
✅ Business Transformation Leaders
✅ Strategy & PMO Teams
✅ Department Heads
✅ Performance Management Teams
✅ Consultants & Analysts
Whether you manage enterprise-wide transformation or department-level initiatives, this dashboard keeps everyone aligned and accountable.
Click here to read the Detailed blog post
Watch the step-by-step video tutorial:


Reviews
There are no reviews yet.