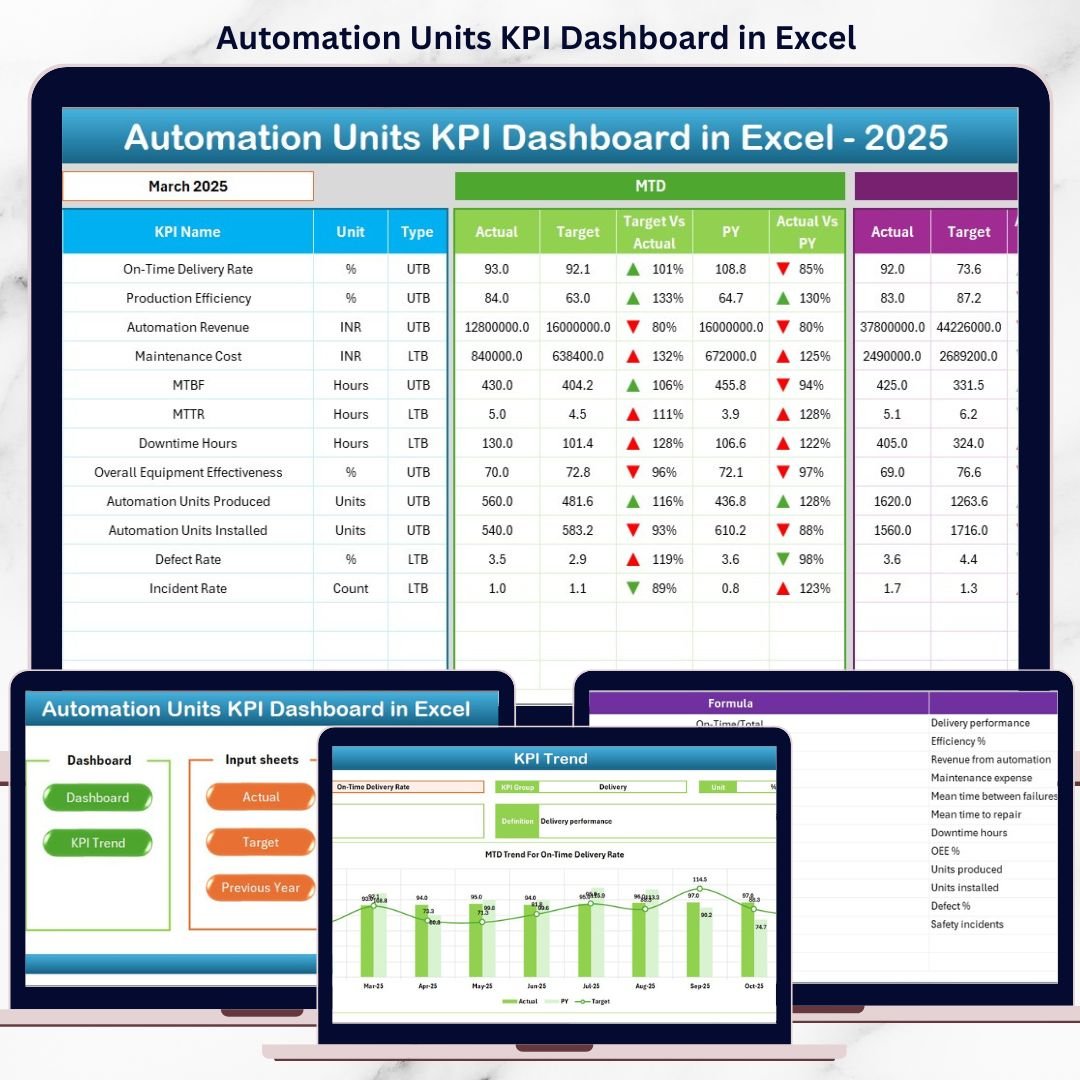

Automation systems are expensive, complex, and mission-critical. However, simply installing automation units does not guarantee higher productivity or efficiency. What truly matters is how well your automation units perform over time. That is where the Automation Units KPI Dashboard in Excel becomes a powerful decision-making tool.
This ready-to-use Excel dashboard transforms raw automation data into clear KPIs, visual trends, and actionable insights. Instead of struggling with multiple spreadsheets or confusing reports, you get a single interactive dashboard that shows exactly how your automation units are performing—month by month and year by year.
Whether you manage a production floor, oversee maintenance operations, or track plant performance, this dashboard helps you monitor results, identify issues early, and improve automation efficiency with confidence.
## 🚀 Key Feature of Automation Units KPI Dashboard in Excel
✅ Interactive KPI Dashboard – Track all automation KPIs from one centralized view
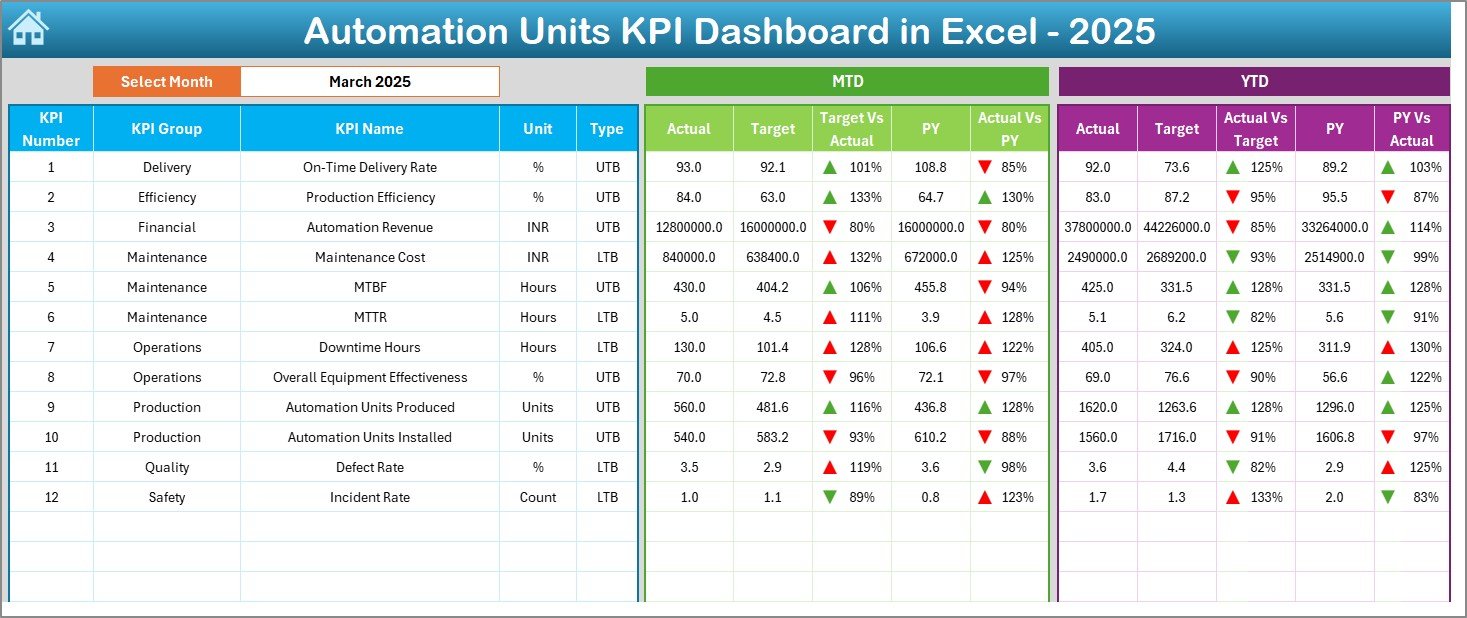
📊 MTD & YTD Performance Tracking – Monitor short-term and long-term performance easily
🔁 Target vs Actual Comparison – Instantly identify performance gaps
📉 Previous Year Comparison – Measure improvement and growth trends
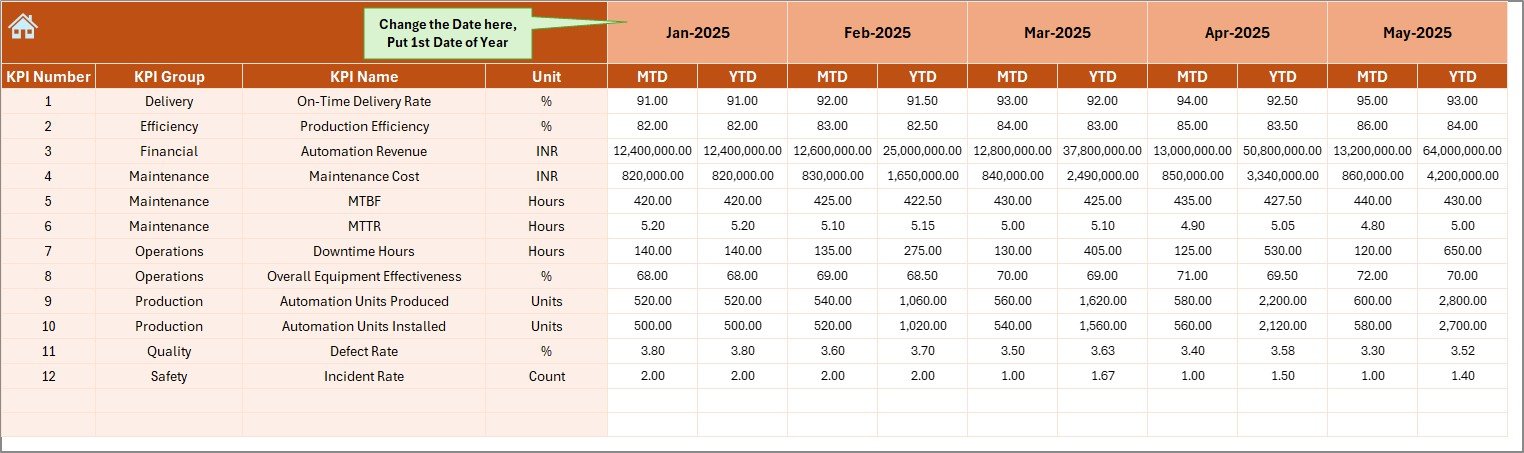
📅 Month Selector (Drop-Down) – Change months dynamically without recalculations
🔼🔽 Conditional Formatting Arrows – Instantly spot good or poor performance
📈 Trend Analysis Charts – Visualize KPI movement over time
🧩 Fully Customizable Excel Structure – Modify KPIs, targets, and layouts easily
This dashboard is designed to be powerful yet simple, making it suitable for both technical and non-technical users.
## 📦 What’s Inside the Automation Units KPI Dashboard
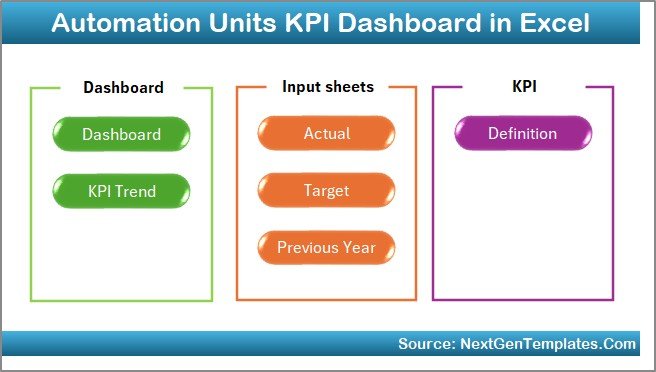
This Excel dashboard comes with 7 well-structured worksheets, each created for a specific purpose:
📌 Summary Sheet – Navigation hub with one-click buttons to access all sheets
📌 Dashboard Sheet – Main KPI reporting page with MTD & YTD comparisons
📌 Trend Sheet – Deep KPI analysis with MTD and YTD trend charts
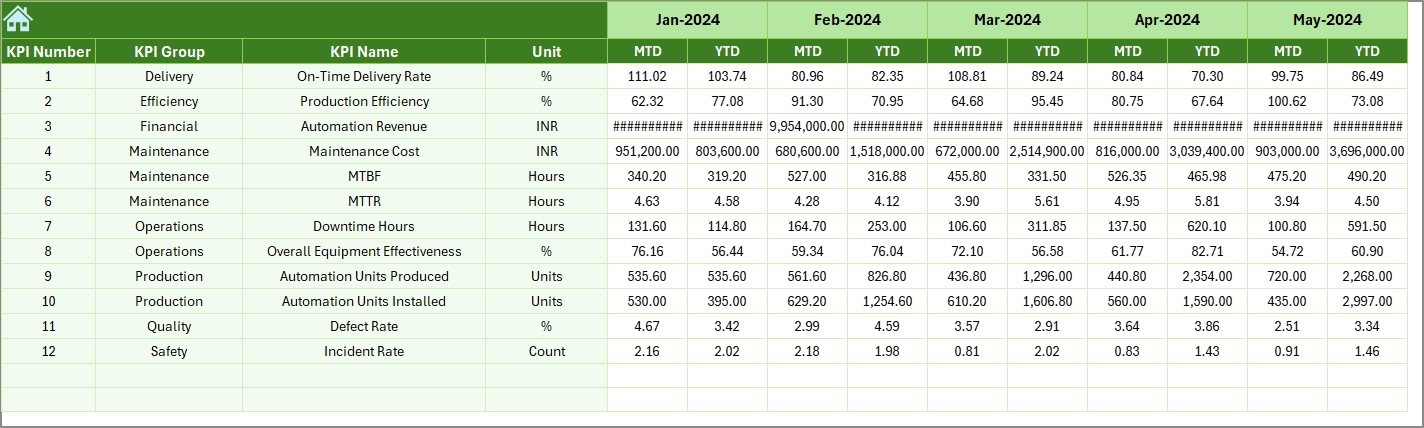
📌 Actual Numbers Input Sheet – Simple data entry for actual KPI values
📌 Target Sheet – Store monthly MTD and YTD performance targets
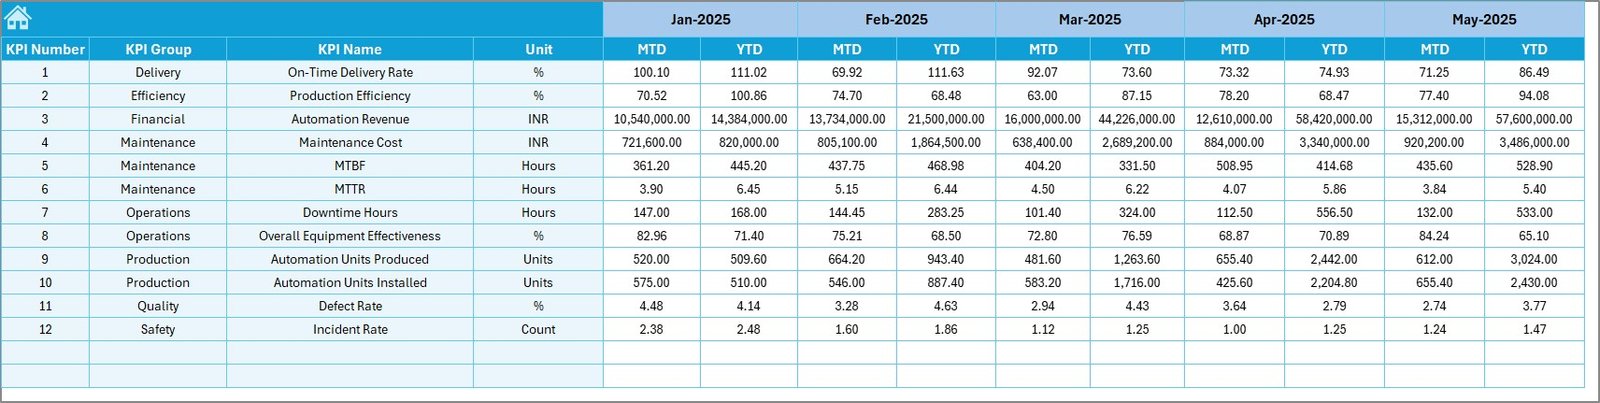
📌 Previous Year Numbers Sheet – Enable year-over-year comparison
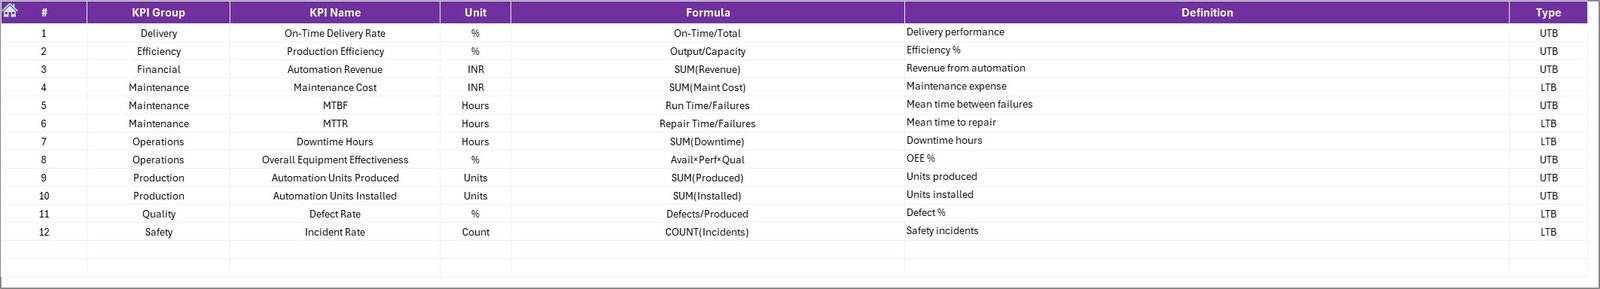
📌 KPI Definition Sheet – Centralized KPI name, unit, formula, and definition
This structured approach ensures clarity, accuracy, and easy navigation across the entire dashboard.
## 🧭 How to Use the Automation Units KPI Dashboard
Using this dashboard is straightforward—even if you are not an Excel expert:
1️⃣ Enter KPI definitions once in the KPI Definition Sheet
2️⃣ Add monthly targets in the Target Sheet
3️⃣ Input actual MTD and YTD values in the Actual Numbers Sheet
4️⃣ Fill previous year data in the Previous Year Numbers Sheet
5️⃣ Select the month from the drop-down to update the dashboard automatically
6️⃣ Review KPIs, trends, and performance indicators instantly
No macros, no complex formulas, and no technical setup required.
## 👥 Who Can Benefit from This Automation Units KPI Dashboard
This dashboard is ideal for:
🏭 Automation Engineers – Track system uptime, efficiency, and failures
📋 Operations Managers – Monitor automation performance against targets
🛠 Maintenance Teams – Identify downtime and maintenance trends
📊 Plant Managers – Gain a complete performance overview
📈 Continuous Improvement Teams – Support data-driven improvement initiatives
Whether you operate a small facility or a large industrial plant, this dashboard adapts easily to your needs.
Click here to read the Detailed blog post
Watch the step-by-step video tutorial:


Reviews
There are no reviews yet.