Astrology Apps Dashboard have become extremely popular across the world. Millions of users check daily horoscopes, zodiac predictions, birth charts, tarot readings, and compatibility reports through mobile apps. Because of this increasing demand, astrology app companies must carefully monitor user engagement, subscription revenue, feature usage, and platform performance.
However, managing analytics for astrology apps can be challenging. App data is often scattered across multiple tools such as spreadsheets, app analytics platforms, and marketing reports. As a result, product managers and business owners struggle to analyze trends, measure subscription conversions, and evaluate user behavior efficiently.
To solve this challenge, businesses are increasingly adopting centralized analytics dashboards. One powerful solution is the Astrology Apps Dashboard in Excel.
The Astrology Apps Dashboard in Excel is a ready-to-use analytical tool designed to help astrology app developers, product managers, and business analysts monitor application performance through interactive charts and KPIs. This dashboard converts raw application data into meaningful visual insights that help businesses make faster and smarter decisions.
Instead of manually analyzing thousands of records, users can simply update the data sheet and instantly visualize performance metrics. Excel automatically refreshes charts and KPIs whenever new data is entered.
The dashboard analyzes several key metrics including feature usage, platform performance, subscription trends, user engagement, referral sources, and revenue performance. By organizing all these insights into one centralized reporting system, businesses can easily track how their astrology apps perform.
With the help of interactive slicers and filters, decision-makers can quickly analyze data based on platform, subscription type, zodiac sign, user age group, referral source, or feature usage.
This dashboard is especially valuable for companies that operate multiple astrology apps or offer various premium services such as personalized horoscopes, tarot readings, birth chart analysis, and compatibility reports.
The dashboard includes five analytical pages, each designed to analyze a different aspect of app performance. These include Overview, Revenue Analysis, User Engagement, App Performance, and Month Analysis.
Whether you are managing a mobile astrology application, spiritual guidance platform, horoscope app, or zodiac prediction service, this dashboard provides a complete analytics framework.
By transforming complex app data into clear visual insights, the Astrology Apps Dashboard in Excel enables businesses to improve user engagement, optimize monetization strategies, and track app growth effectively.
✨ Key Feature of Astrology Apps Dashboard in Excel
📊 Interactive App Analytics Dashboard
Monitor astrology app performance using dynamic charts and KPI indicators.
🔮 Feature Usage Analysis
Track which astrology features users interact with the most.
📱 Platform Performance Insights
Compare engagement across Android, iOS, and web platforms.
💰 Revenue & Subscription Monitoring
Analyze subscription plans and in-app purchase revenue.
📈 User Engagement Metrics
Evaluate session duration, retention rate, and user activity.
🌟 Zodiac Sign Engagement Analysis
Discover which zodiac sign groups interact most with the app.
📊 Marketing Channel Performance
Track referral sources such as social media, advertising, and search.
📅 Monthly Trend Analysis
Monitor app growth, revenue, and user activity across months.
🎛 Interactive Slicers & Filters
Filter analytics instantly by platform, feature, age group, or subscription type.
⚙️ Excel-Based Data Management
Easily update analytics by entering data into the data sheet.
📊 What’s Inside the Astrology Apps Dashboard in Excel
The dashboard includes five analytical pages designed to analyze different aspects of astrology app performance.
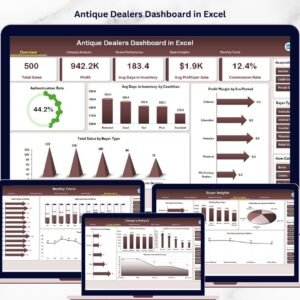
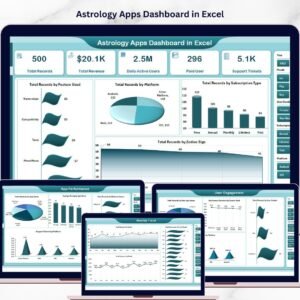
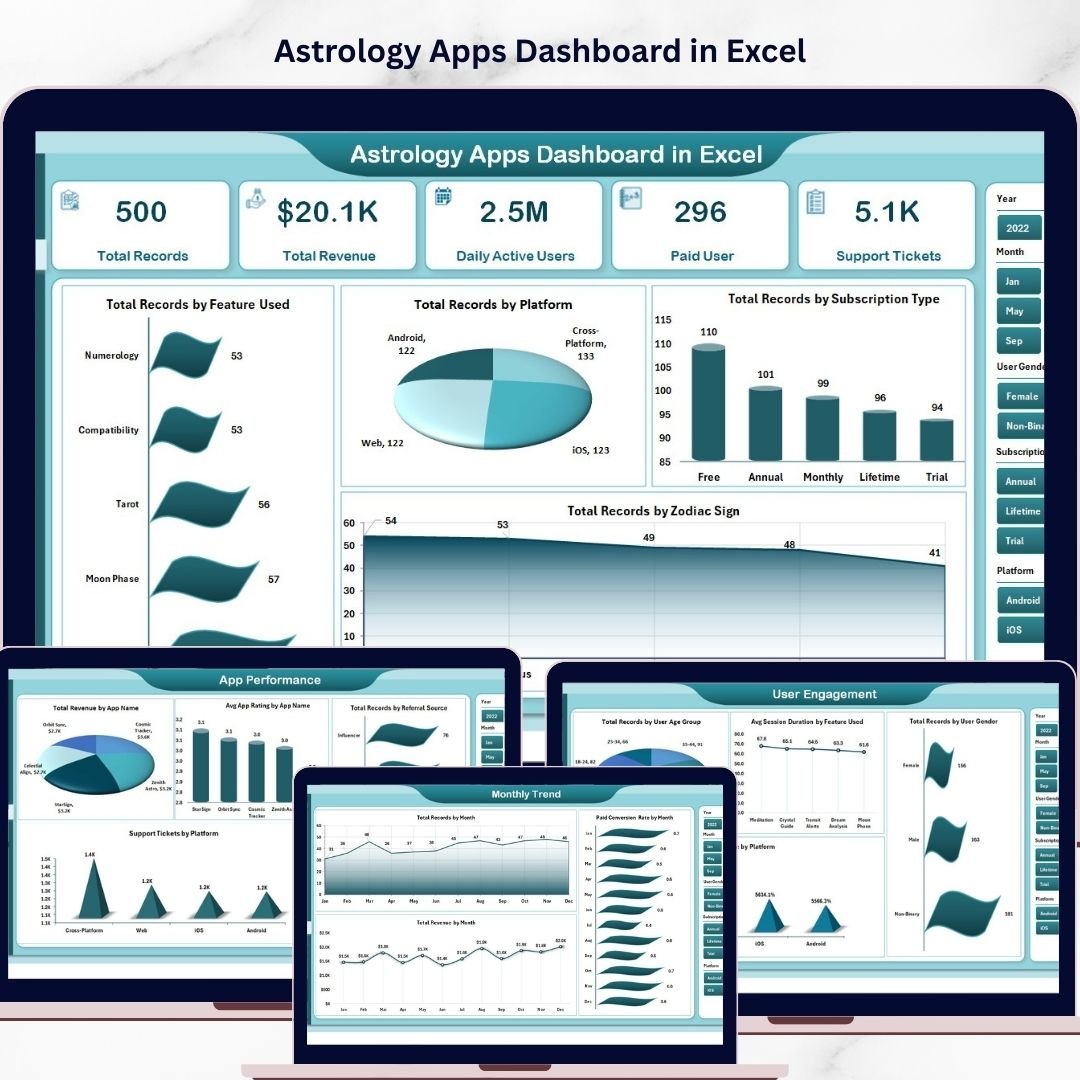
🌟 Overview Page – Main App Analytics Dashboard
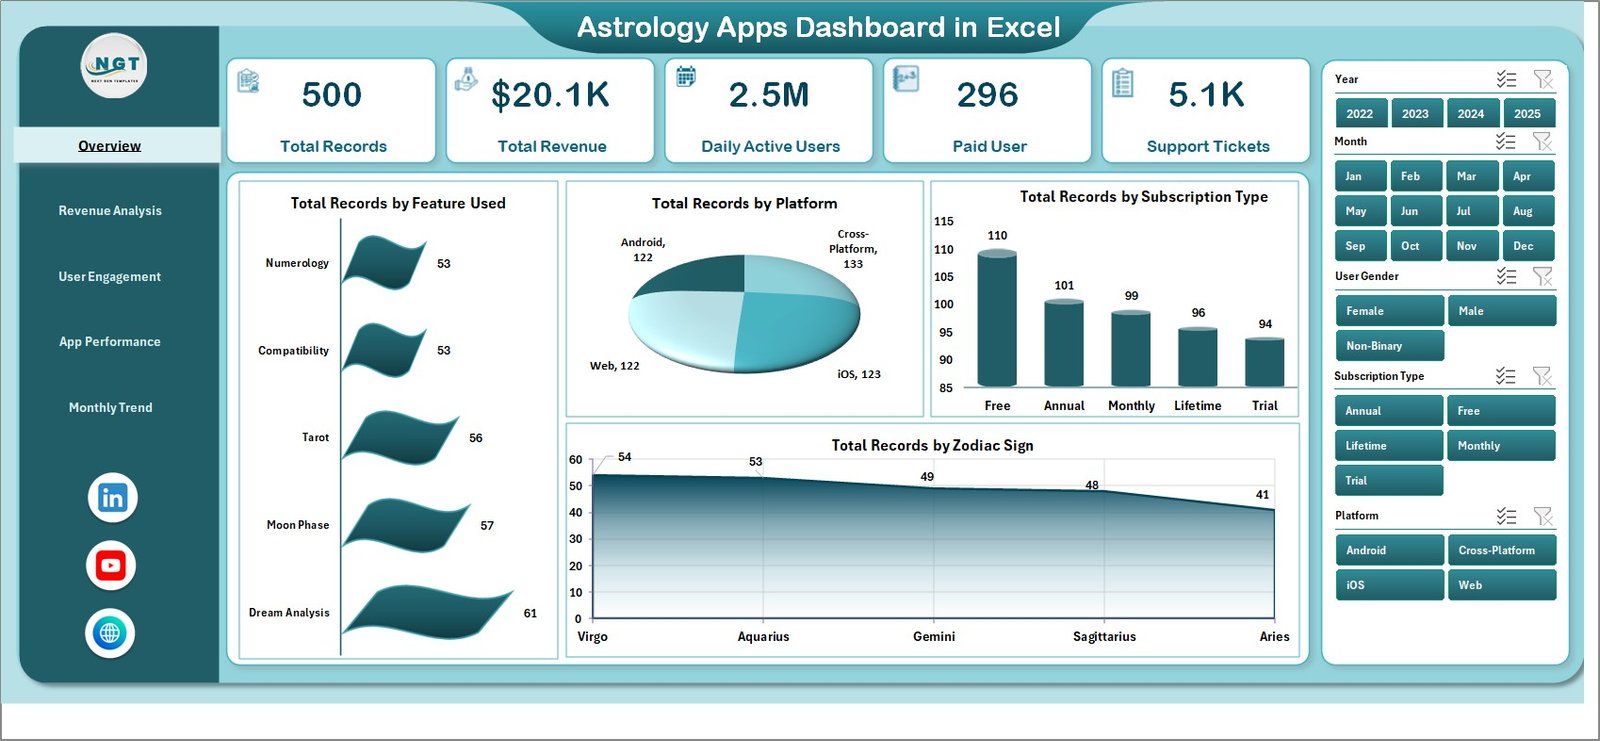
The Overview Page provides a quick snapshot of the overall performance of the astrology application.
This page includes:
• Right-side interactive slicers
• Four KPI cards
• Multiple charts displaying app usage metrics
Charts Included
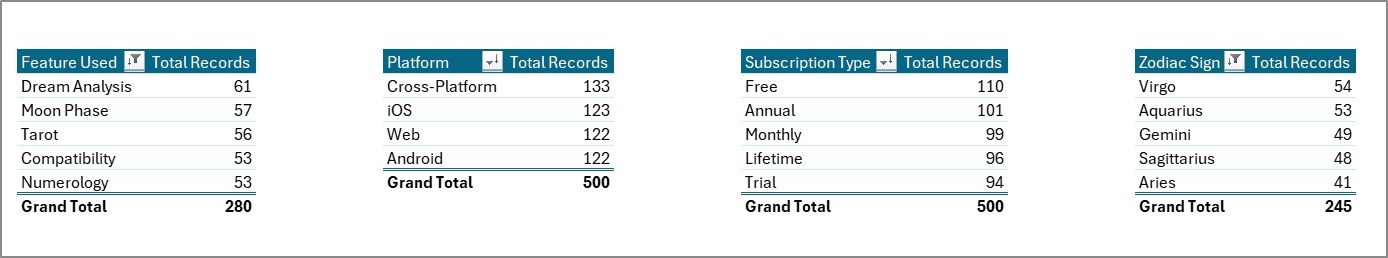
• Total Record by Feature Used – Identifies the most popular astrology features.
• Total Record by Platform – Compares engagement across Android, iOS, and web.
• Total Record by Subscription Type – Shows the distribution of free and premium users.
• Total Record by Zodiac Sign – Analyzes user activity based on zodiac signs.
These insights help businesses understand which features drive the most engagement.
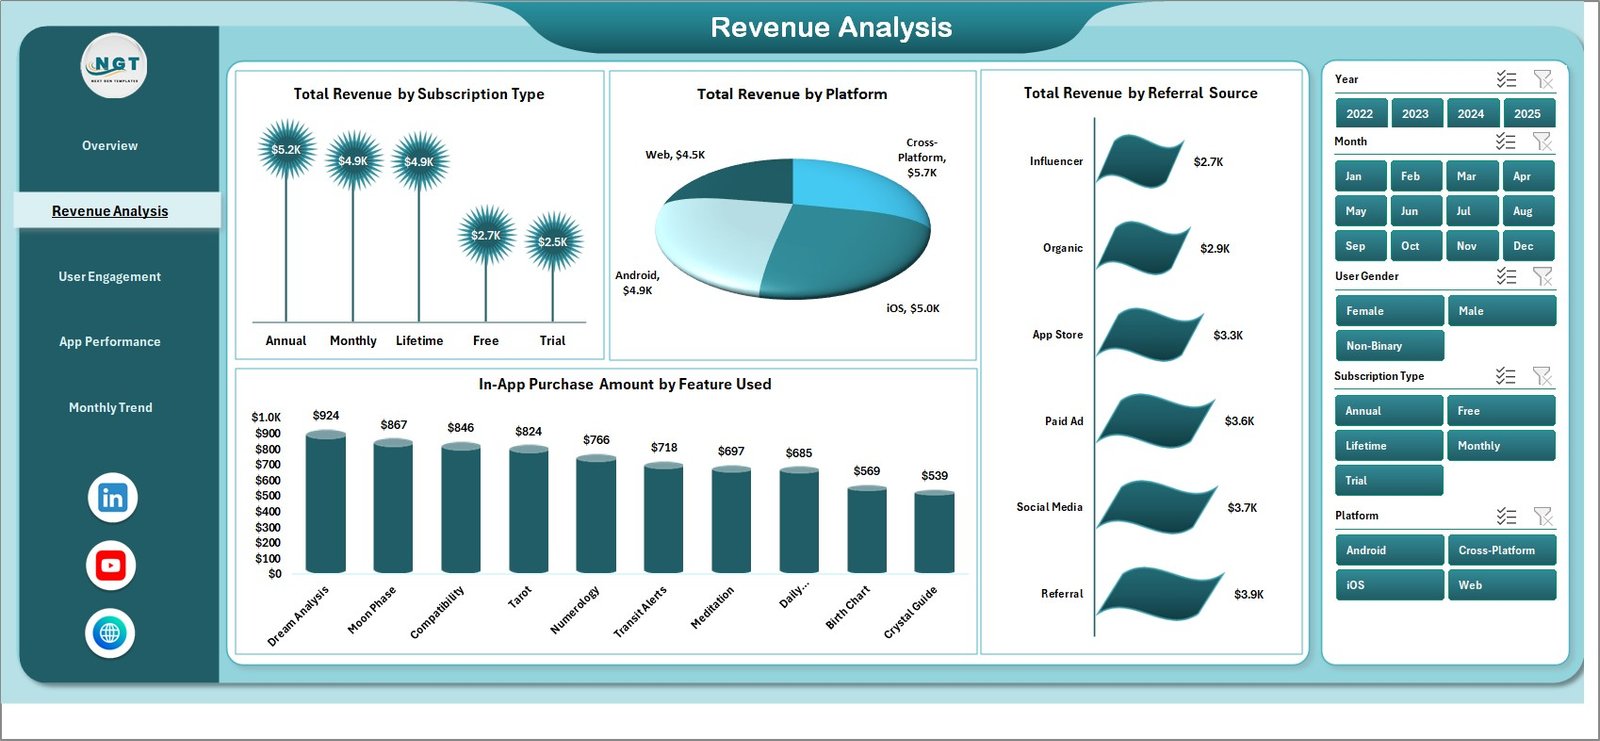
💰 Revenue Analysis Page
The Revenue Analysis Page focuses on monetization performance.
Charts included:
• Total Record by Subscription Type
• Total Revenue by Platform
• Total Revenue by Referral Source
• In-App Purchases Amount by Feature Used
This page helps businesses evaluate subscription conversions and in-app purchase performance.
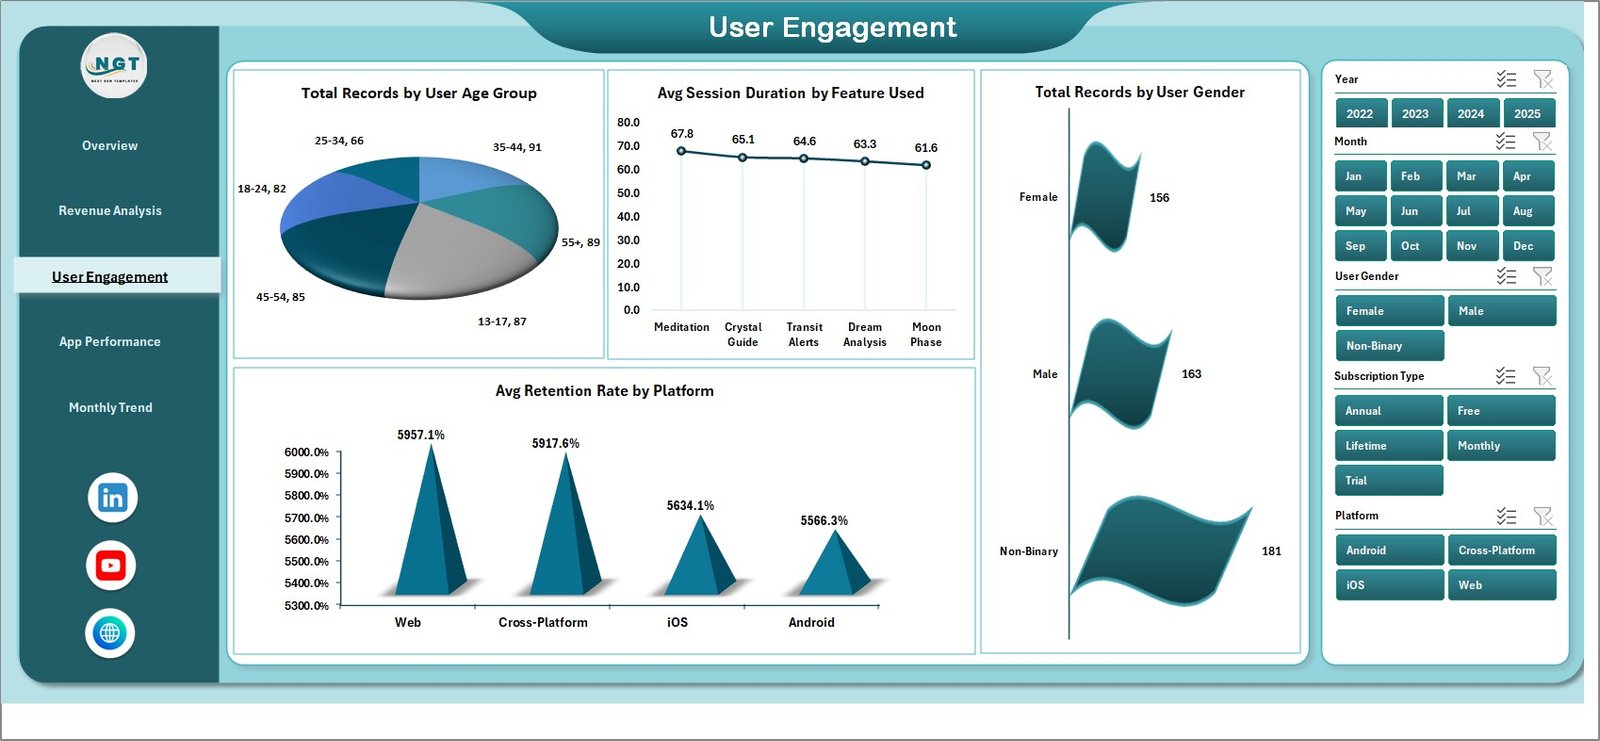
📈 User Engagement Page
The User Engagement Page analyzes how users interact with the astrology app.
Charts included:
• Total Record by User Age Group
• Average Session Duration by Feature Used
• Total Record by User Gender
• Average Retention Rate by Platform
These insights help product teams improve user experience and engagement strategies.
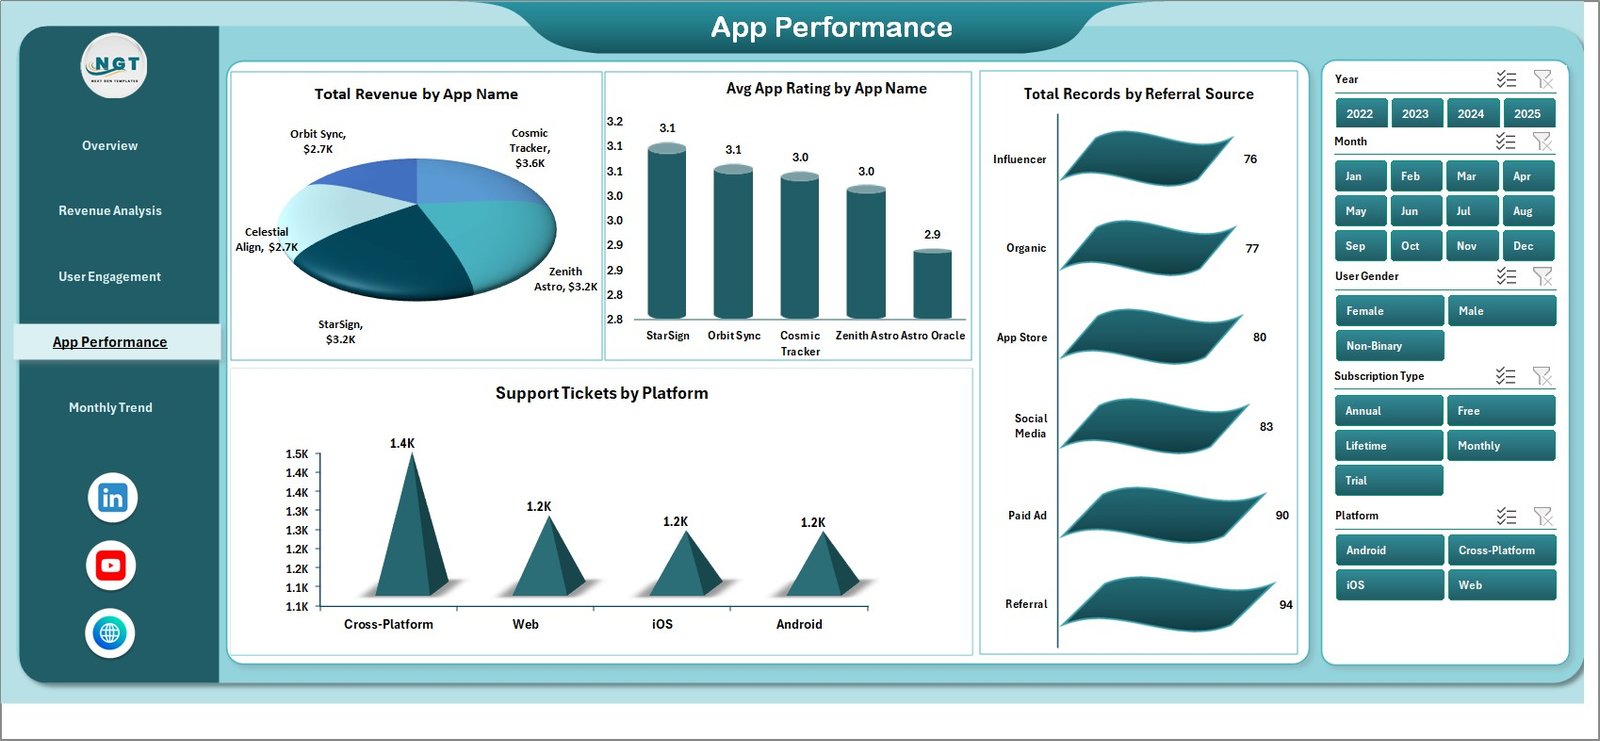
📱 App Performance Page
The App Performance Page monitors application health and user satisfaction.
Charts included:
• Total Record by User App Name
• Average App Rating by App Name
• Total Record by Referral Source
• Support Tickets by Platform
These metrics help developers monitor technical performance and customer satisfaction.
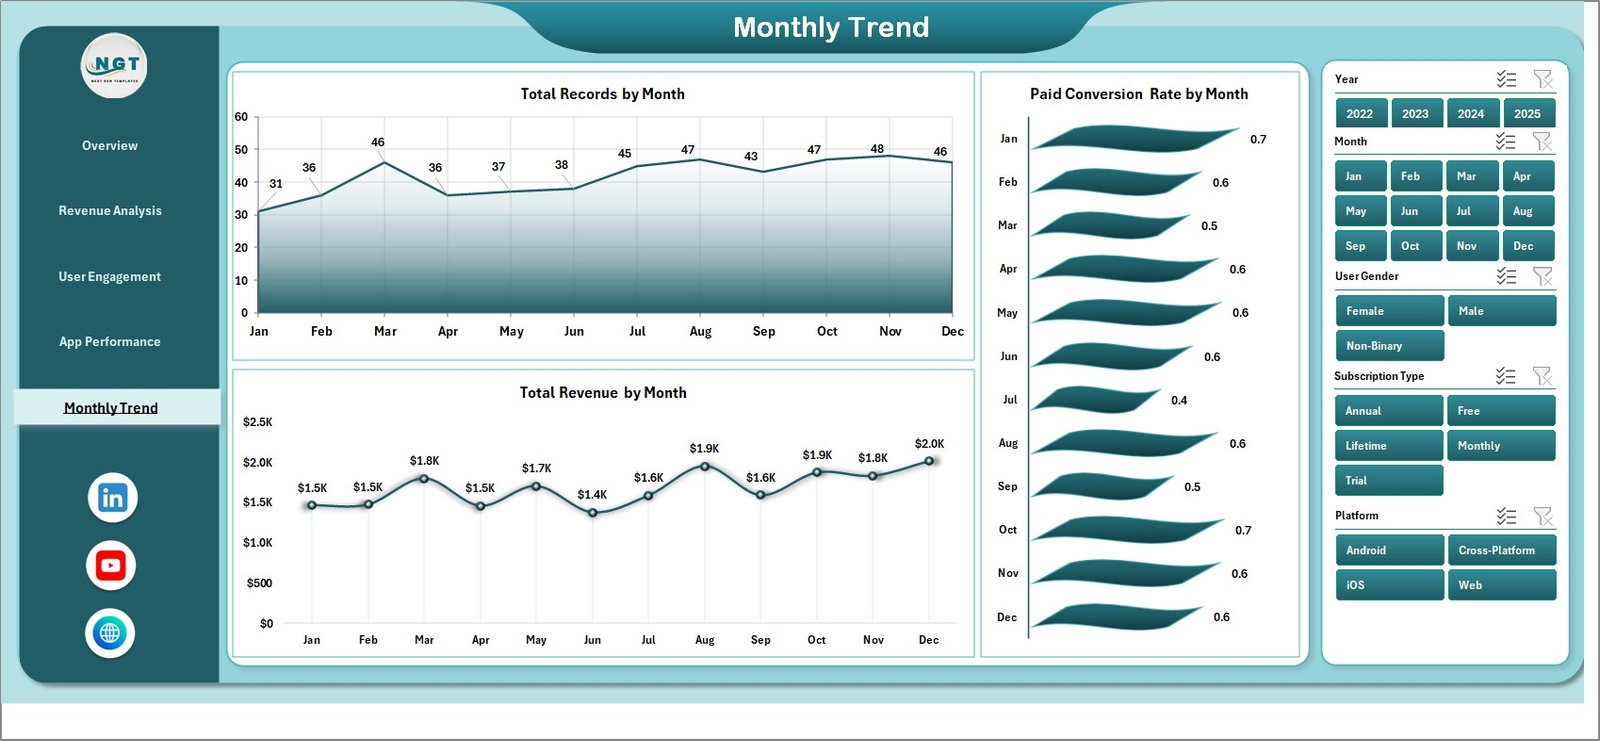
📅 Month Analysis Page
The Month Analysis Page analyzes app trends across time.
Charts included:
• Total Record by Month
• Paid Conversion Rate by Month
• Total Revenue by Month
This analysis helps businesses evaluate marketing campaigns and product updates.
⚙️ How to Use the Astrology Apps Dashboard in Excel
Using the dashboard is simple.
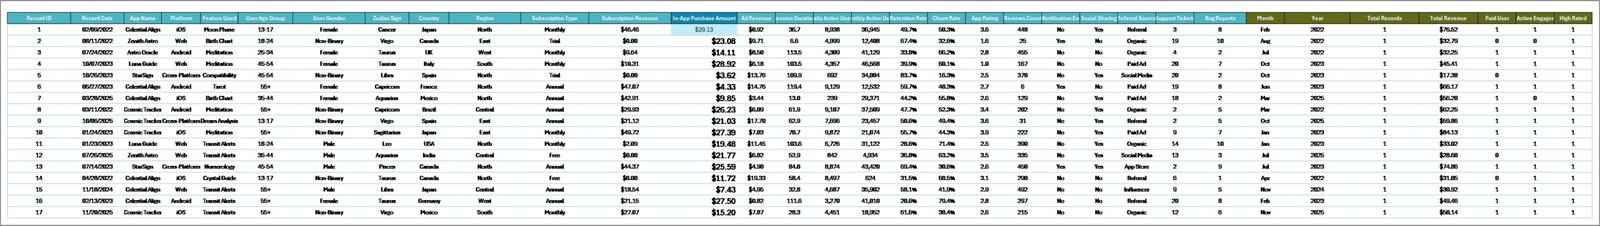
1️⃣ Enter application data into the Data Sheet.
2️⃣ Ensure the dataset includes user information, platform, subscription type, feature usage, and revenue.
3️⃣ Use slicers to filter analytics dynamically.
4️⃣ Analyze insights across the different dashboard pages.
5️⃣ Update data regularly to keep analytics accurate.
Within seconds, Excel converts raw app data into powerful analytics.
👥 Who Can Benefit from This Dashboard
This dashboard is ideal for professionals working in mobile app development and analytics.
📱 Astrology App Developers
📊 Product Managers
📈 Business Analysts
📣 Marketing Teams
🚀 Startup Founders
💰 App Monetization Strategists
These professionals can use the dashboard to monitor growth, improve engagement, and optimize revenue strategies.
### Click hare to read the Detailed blog post
Visit our YouTube channel to learn step-by-step video tutorials
https://youtube.com/@PKAnExcelExpert