Managing APIs efficiently has become essential for modern software teams. APIs power mobile apps, cloud platforms, SaaS solutions, and enterprise systems. However, tracking API performance, quality metrics, request volumes, latency, and costs across different teams and environments can quickly become complex.
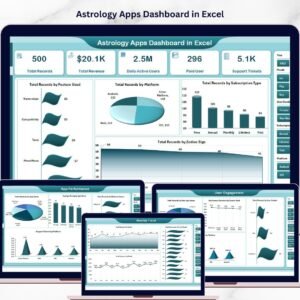
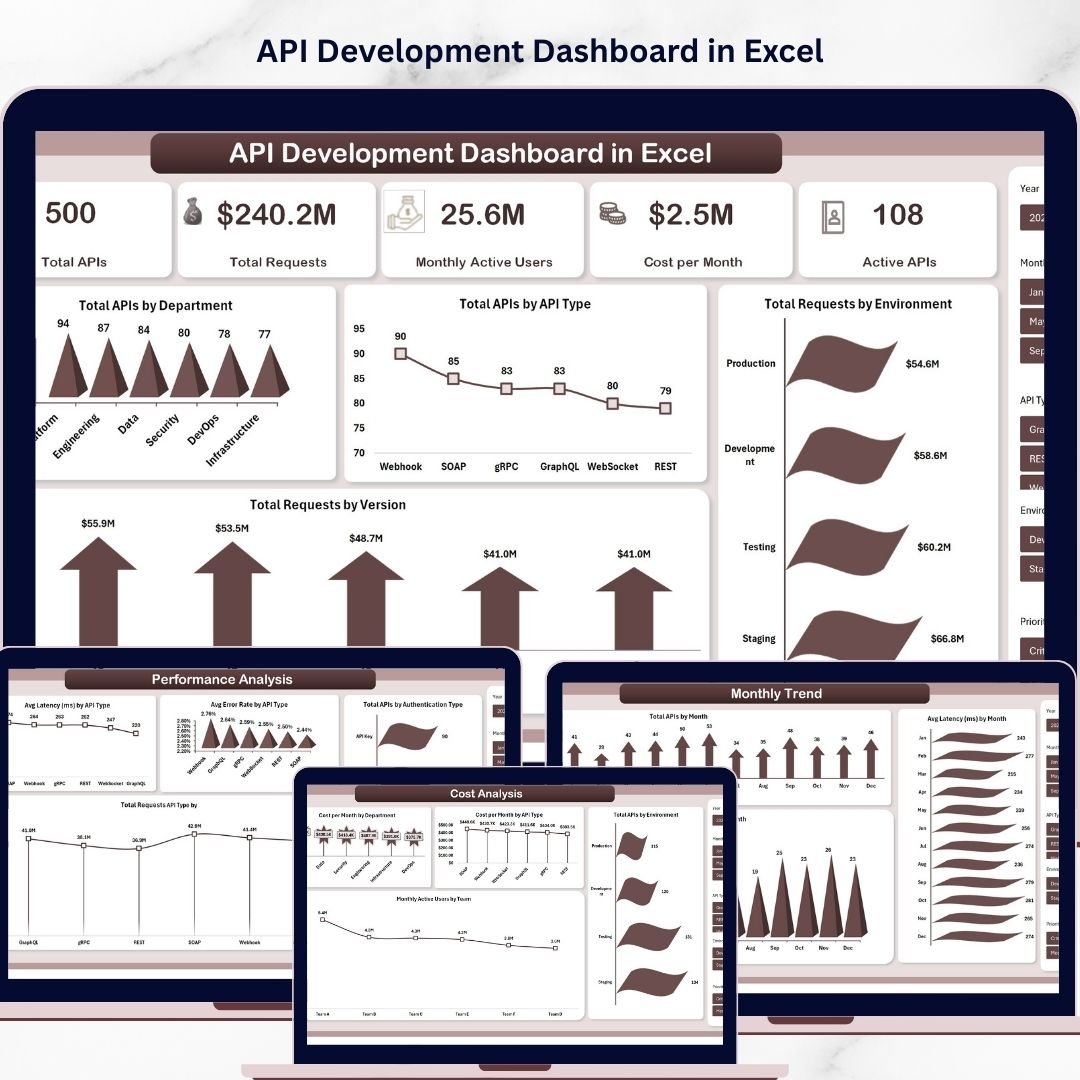
The API Development Dashboard in Excel is a powerful, ready-to-use analytics template that helps development teams, DevOps engineers, and technology managers monitor API metrics in a clear and structured way. Instead of reviewing scattered reports and raw spreadsheets, this Excel dashboard transforms your API data into meaningful visual insights.
With just a few clicks, you can update your data in the Data Sheet, press Refresh All, and instantly see updated metrics across interactive charts, slicers, and pivot-driven visualizations. This dashboard enables organizations to track API performance, analyze quality metrics, evaluate costs, and monitor monthly trends without relying on expensive business intelligence tools.
Because it is built inside Microsoft Excel, the dashboard is extremely easy to use and customize. Teams can analyze key API metrics such as request volume, latency, error rates, authentication types, testing coverage, documentation scores, and cost allocation across departments.
Whether you manage internal APIs, public APIs, or microservices architectures, this dashboard helps you turn complex API data into actionable insights.
🚀 Key Feature of API Development Dashboard in Excel
📊 Interactive Multi-Page Dashboard
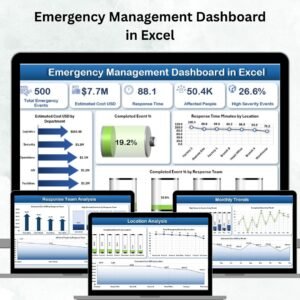
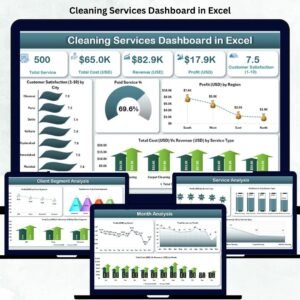
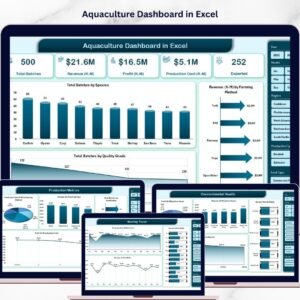
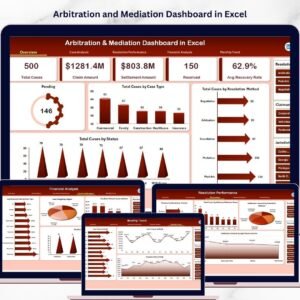
The template includes multiple analytical sheets such as Overview, Performance Analysis, Quality Metrics, Cost Analysis, and Monthly Trends, allowing users to analyze API metrics from different perspectives.
🎛️ Dynamic Slicers for Instant Filtering
Users can quickly filter insights using slicers for departments, API types, environments, teams, and managers.
📈 Powerful Visual Charts
Includes multiple chart types such as 3D column charts, line charts, bar charts, and stylish visualizations to present API metrics clearly.
⚡ Instant Data Refresh
Simply update the Data sheet and click Refresh All from the Excel ribbon to update the entire dashboard automatically.
🔍 Comprehensive API Monitoring
Track essential metrics including API requests, latency, error rates, authentication types, security scores, testing coverage, and documentation quality.
💰 Cost Monitoring Capabilities
Analyze monthly costs by department and API type to control API infrastructure spending.
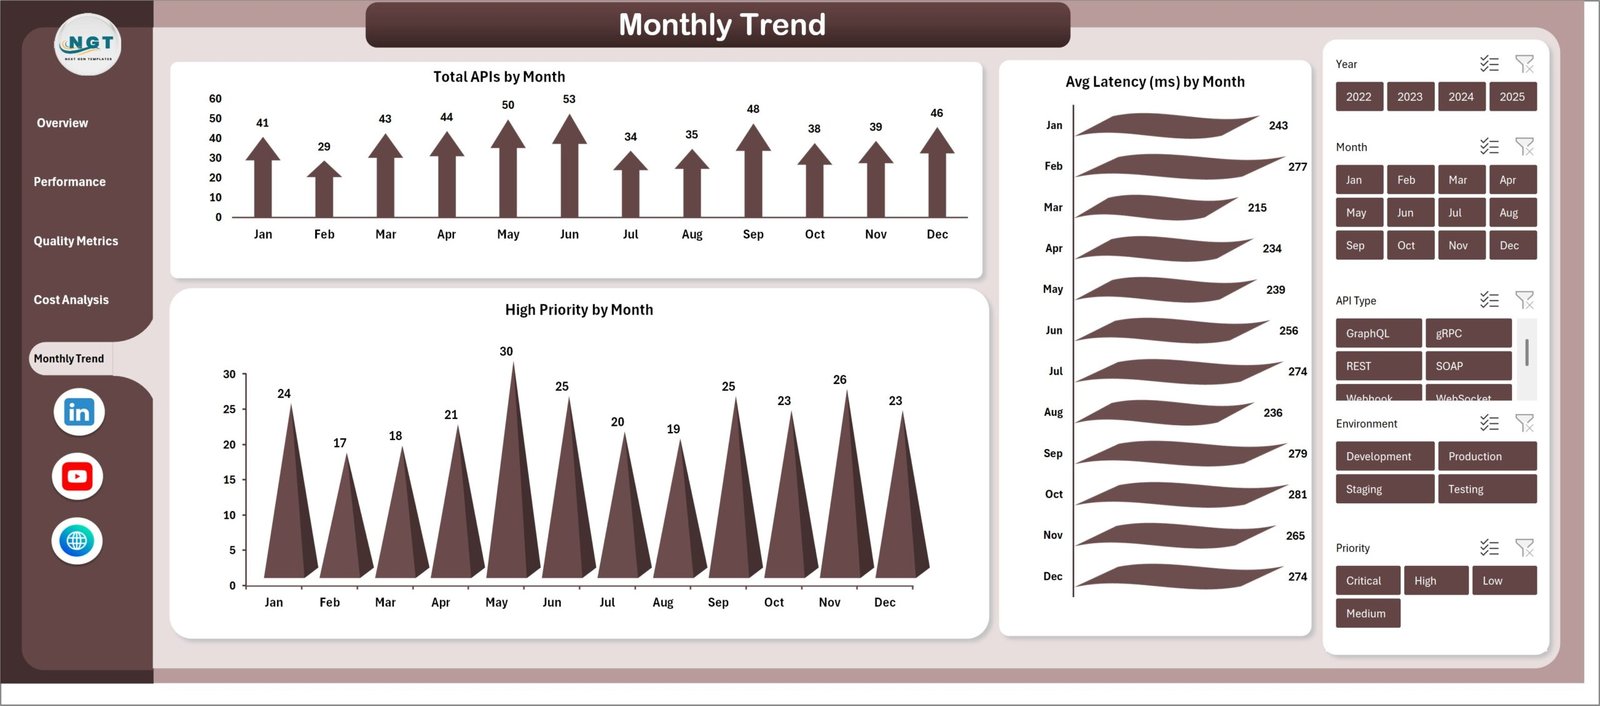
📅 Monthly Trend Tracking
Monitor growth in APIs, spikes in priority issues, and changes in latency through monthly trend charts.
🧩 Fully Customizable Template
Users can easily customize pivot tables, charts, and fields to adapt the dashboard to their organization’s needs.

📦 What’s Inside the API Development Dashboard in Excel
The template is designed with multiple structured worksheets to provide a complete analytics experience.
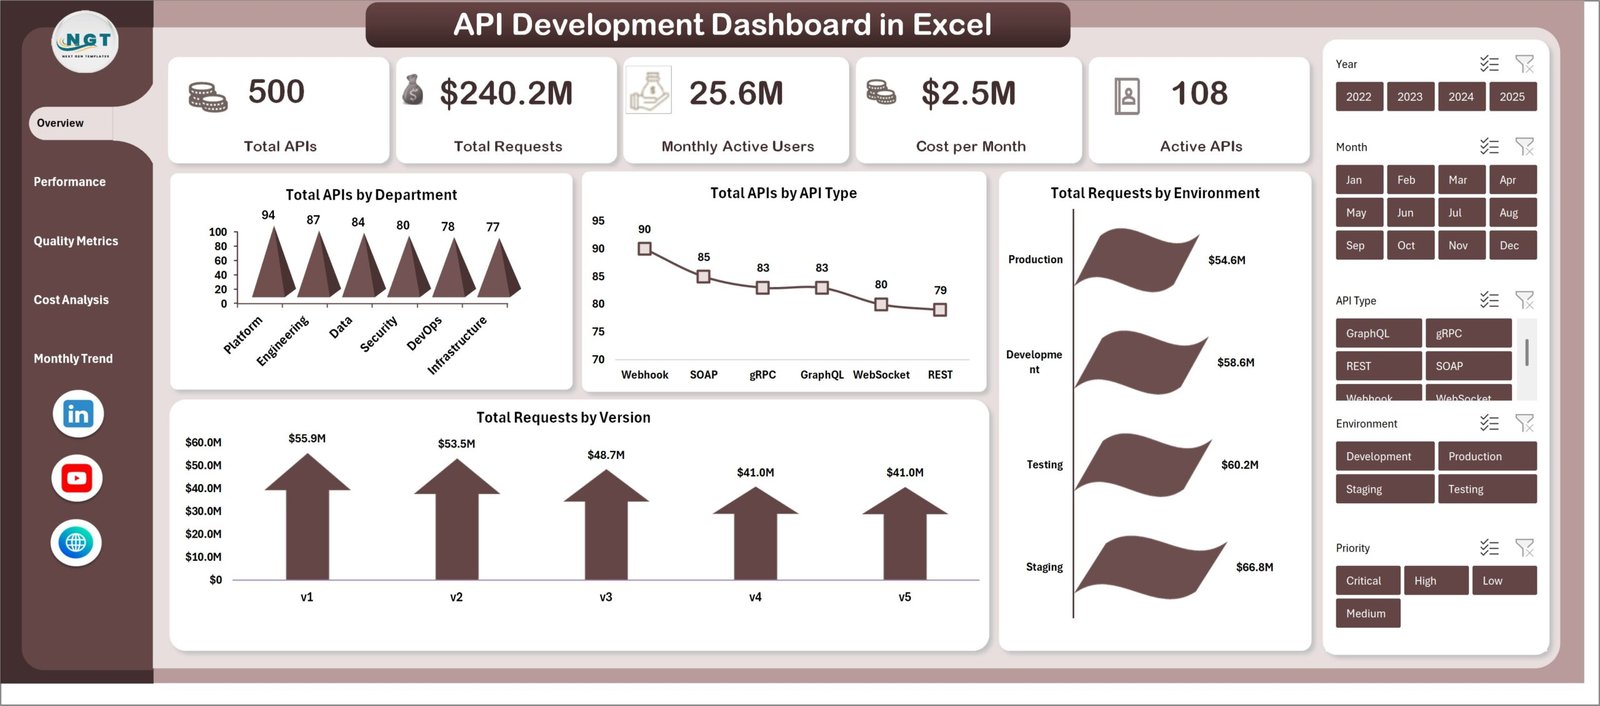
Overview Sheet
Provides a snapshot of the entire API ecosystem including API distribution, request volumes, and version performance.
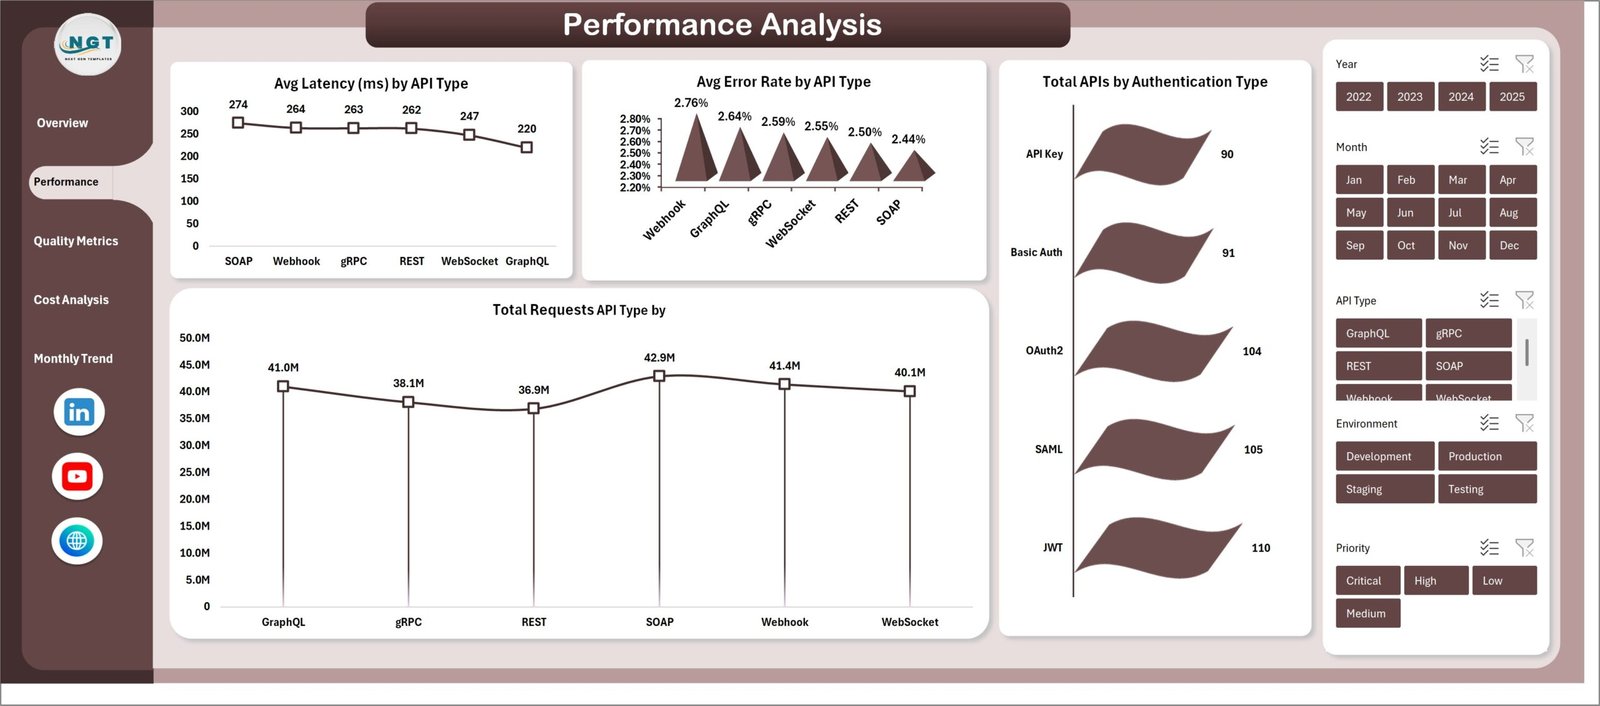
Performance Analysis Sheet
Displays latency metrics, error rates, request volumes, and authentication method analysis.
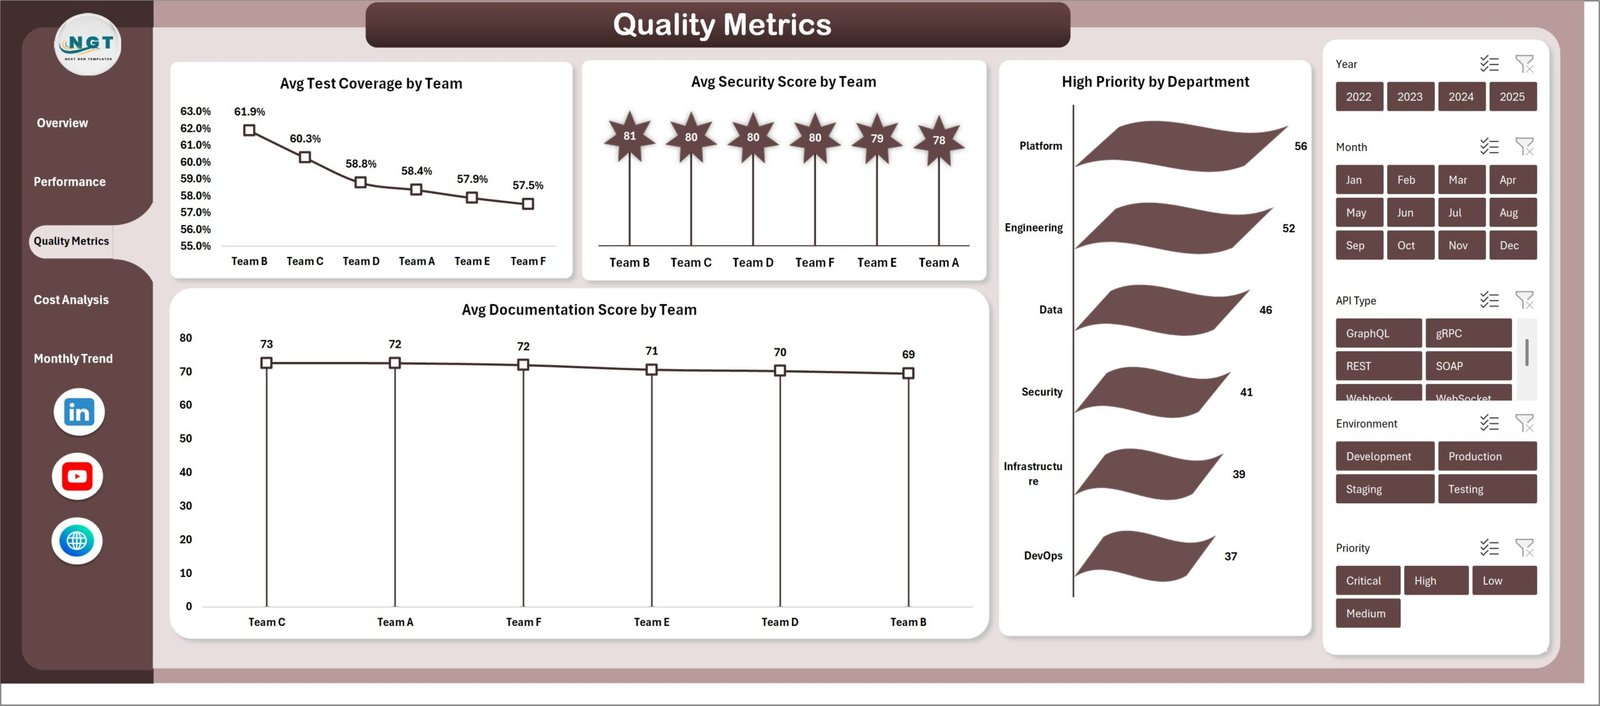
Quality Metrics Sheet
Tracks test coverage, security scores, documentation quality, and high-priority issues by department.
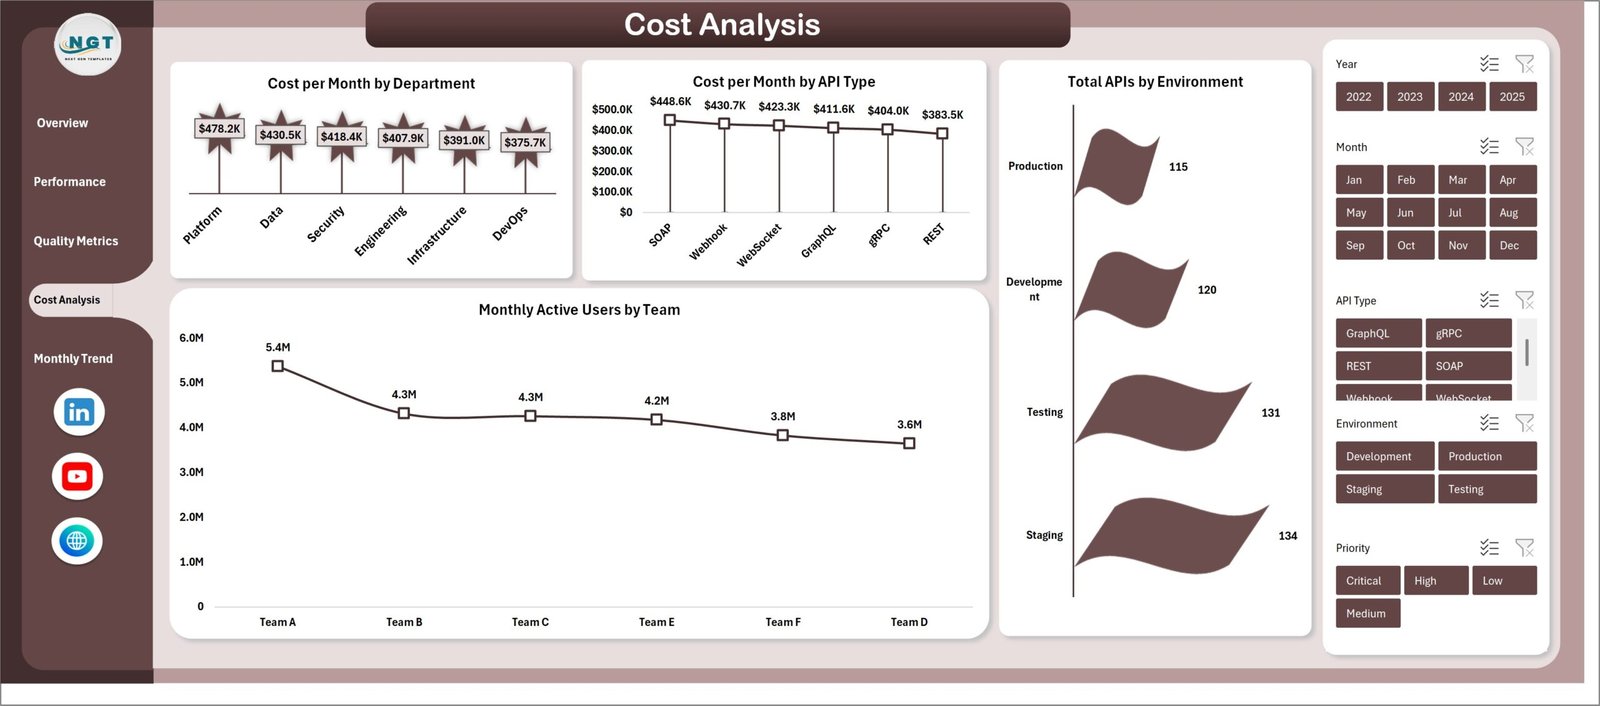
Cost Analysis Sheet
Helps teams monitor monthly costs, user activity, and API distribution across environments.
Monthly Trends Sheet
Identifies trends in API growth, performance, and issue management.
Data Sheet
Centralized data entry location where users update API metrics.
Support Sheet
Contains pivot tables that dynamically power all dashboard charts and visualizations.
⚙️ How to Use the API Development Dashboard in Excel
Using the dashboard is simple and requires no advanced Excel skills.
1️⃣ Open the Excel Dashboard File
Download and open the API Development Dashboard template.
2️⃣ Enter Your Data
Navigate to the Data Sheet and add or update your API metrics following the existing structure.
3️⃣ Refresh the Dashboard
Go to the Excel Data tab and click Refresh All.
4️⃣ Explore the Insights
Navigate through dashboard sheets and use slicers to analyze different segments.
5️⃣ Monitor API Health
Use charts and metrics to identify performance issues, quality improvements, and cost trends.
👥 Who Can Benefit from This API Development Dashboard
This dashboard is useful for many technology professionals and organizations.
💻 Software Development Teams
Monitor API performance, latency, and usage trends.
⚙️ DevOps Engineers
Track operational metrics and request volumes across environments.
📊 Technology Managers
Evaluate API costs, quality metrics, and development performance.
🏢 SaaS Companies
Analyze API usage across products and services.
🔐 API Platform Teams
Ensure security standards and authentication practices are maintained.
🚀 Startups and Enterprises
Track API infrastructure performance without investing in expensive analytics tools.
By using this dashboard, teams can improve API performance, reduce operational issues, optimize costs, and maintain high API quality standards.
Click here to read the Detailed blog post
Visit our YouTube channel to learn step-by-step video tutorials
https://www.youtube.com/@PKAnExcelExpert