Artificial Intelligence is transforming the creative industry at an incredible pace. Today, AI art studios produce digital illustrations, NFT artwork, gaming assets, marketing visuals, concept art, and social media graphics using powerful AI tools. However, as AI-generated art businesses grow, managing revenue streams, client satisfaction, production costs, and platform performance becomes increasingly complex.
Many studios still rely on scattered spreadsheets and manual reports to track performance. As a result, studio owners often struggle to identify profitable art categories, understand client behavior, or evaluate which AI tools deliver the best results.
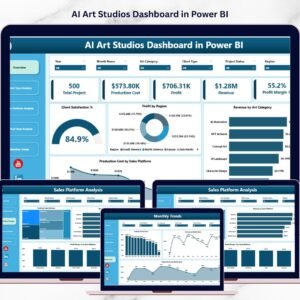
This is exactly where the AI Art Studios Dashboard in Power BI becomes extremely valuable.
The AI Art Studios Dashboard in Power BI is a powerful business intelligence solution designed to monitor revenue, profit margins, client satisfaction, production costs, sales platform performance, and AI tool usage. Moreover, the dashboard transforms raw studio data into interactive visual insights that allow studio managers and creative teams to make faster and smarter decisions.
Because Power BI offers interactive visuals, slicers, real-time analytics, and dynamic charts, the dashboard provides a centralized platform for monitoring studio operations. As a result, AI art studios can improve efficiency, optimize pricing strategies, and scale their creative businesses more effectively.
🎨 Key Feature of AI Art Studios Dashboard in Power BI
This dashboard includes several powerful analytical features designed to help AI art studios monitor and optimize their business performance.
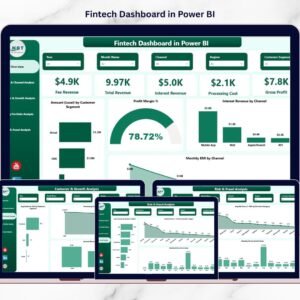
📊 Centralized Studio Performance Monitoring – Track revenue, profit margins, production costs, and client satisfaction in one dashboard.
💰 Revenue Analysis by Art Category – Identify which art categories generate the most income.
📉 Production Cost Tracking – Monitor production costs across different sales platforms.
👥 Client Behavior Analysis – Understand revenue and profitability by client type.
🌐 Sales Platform Performance Monitoring – Evaluate the profitability of different digital sales channels.
🤖 AI Tool Usage Analysis – Identify which AI tools deliver the highest revenue and profit.
📅 Monthly Business Trend Analysis – Track revenue, profit, and cost trends over time.
📊 Interactive KPI Cards – Instantly monitor important studio performance indicators.
🔎 Advanced Filtering with Slicers – Analyze performance by client type, art category, platform, or AI tool.
⚡ Real-Time Business Insights – Make faster decisions with dynamic Power BI visuals.
These features help studios analyze performance quickly, reduce costs, and maximize profitability.
📦 What’s Inside the AI Art Studios Dashboard in Power BI
The dashboard includes five interactive analytical pages, each designed to analyze a specific aspect of studio performance.
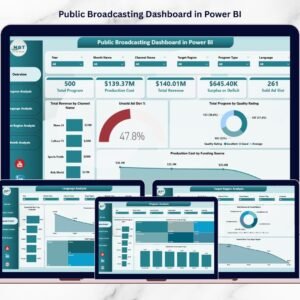
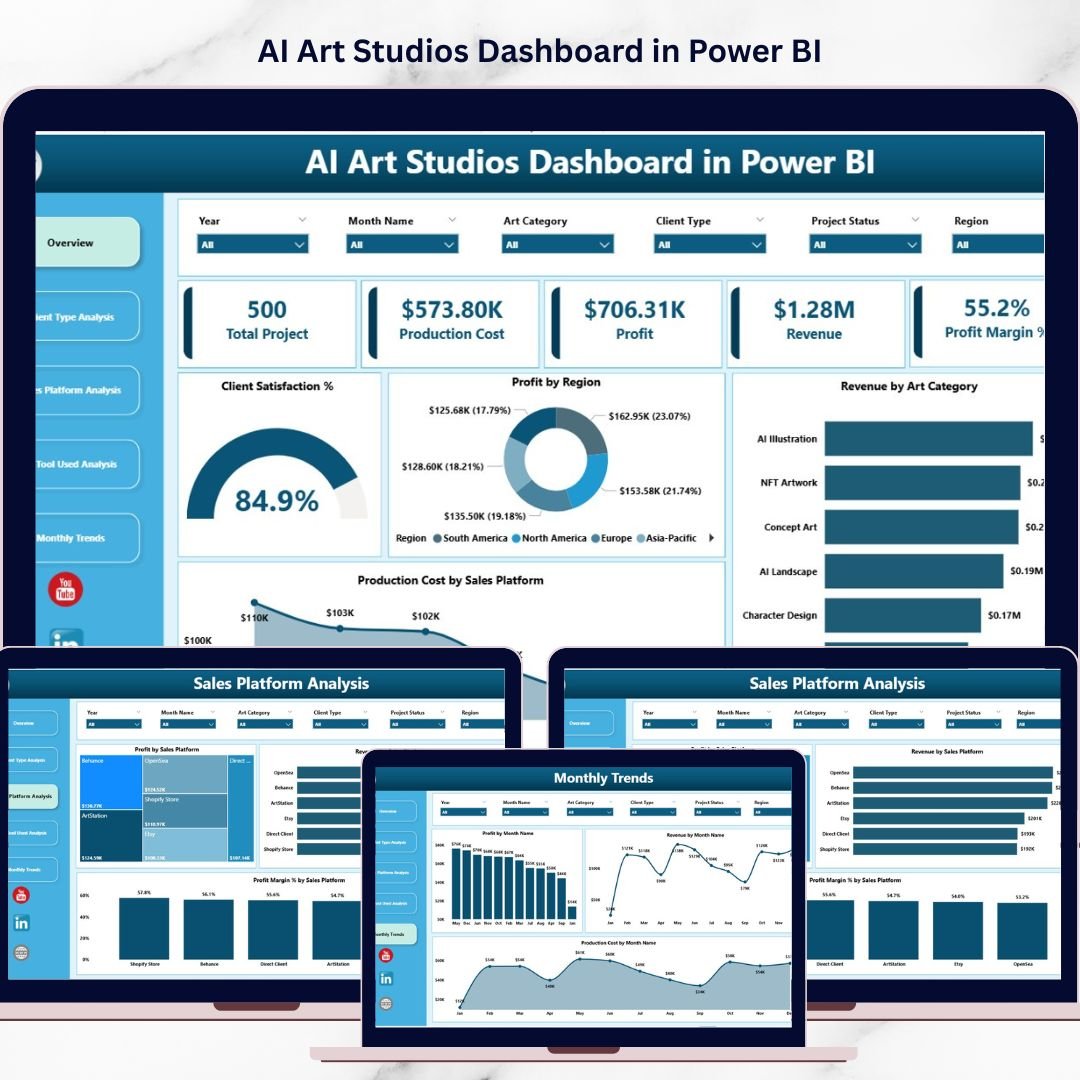
Overview Page – Complete Studio Performance Snapshot
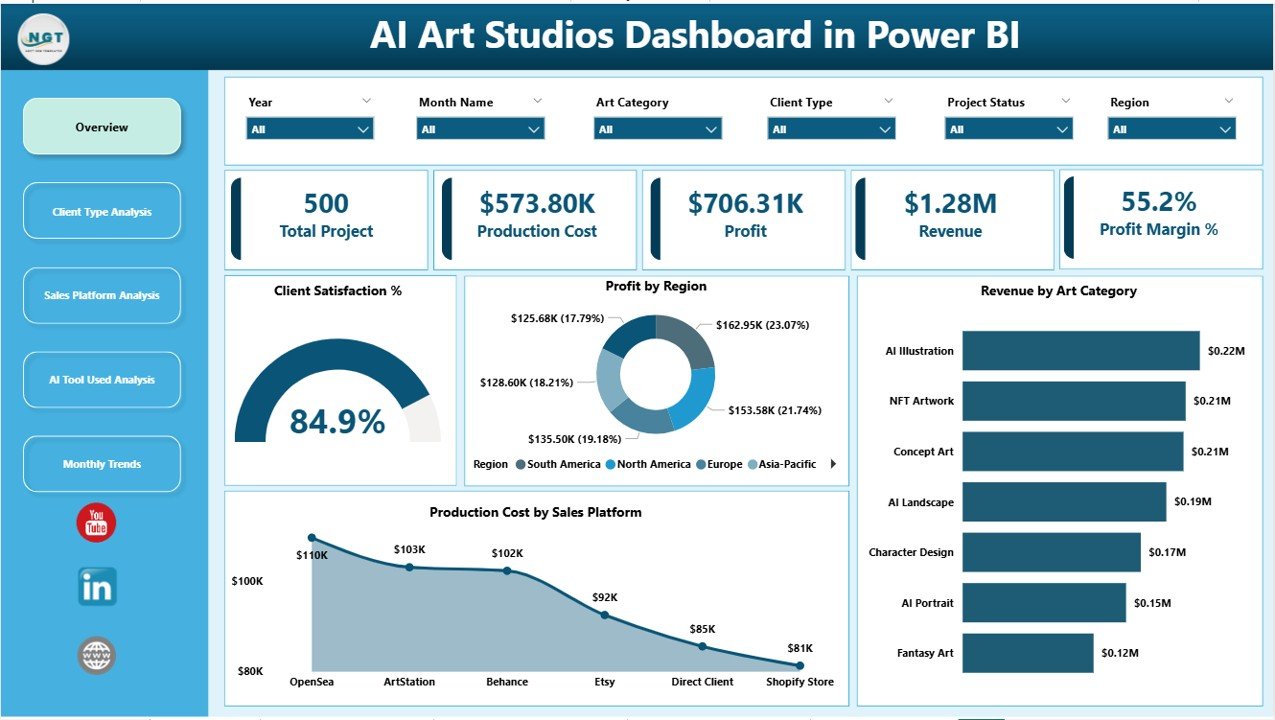
The Overview Page acts as the central dashboard where studio owners can evaluate overall business performance.
This page contains interactive slicers that allow users to filter the dashboard based on different business parameters.
KPI Cards on the Overview Page
The dashboard includes several KPI indicators such as:
• Client Satisfaction %
• Profit by Region
• Revenue by Art Category
• Production Cost by Sales Platform
These KPIs provide a quick overview of studio performance and business health.
Charts on the Overview Page
The visual charts help managers instantly identify:
• Which art category generates the most revenue
• Which region contributes the highest profit
• Which sales platform incurs higher production costs
Therefore, studio owners can quickly identify growth opportunities.
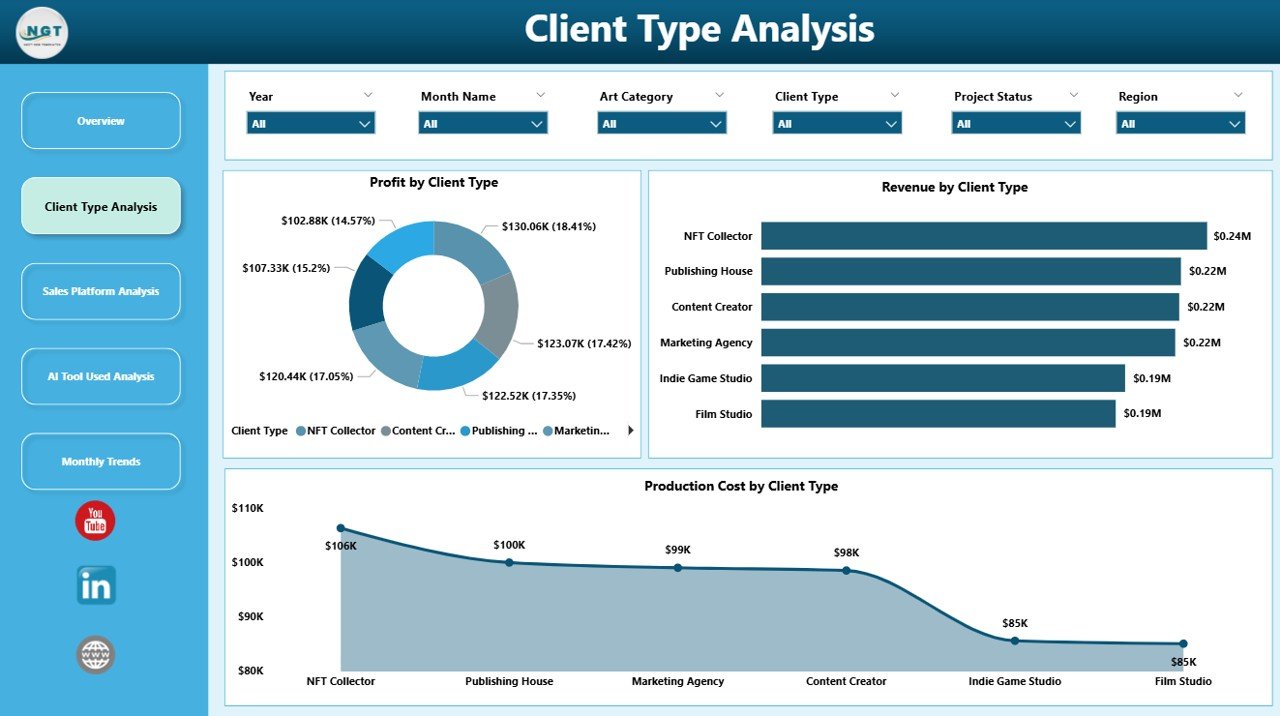
Client Type Analysis – Understanding Client Segments
AI art studios serve various client types such as:
• Marketing agencies
• Gaming companies
• NFT collectors
• Independent creators
• Corporate clients
Therefore, analyzing client behavior becomes essential.
Charts Included
• Profit by Client Type
• Revenue by Client Type
• Production Cost by Client Type
These insights help studios identify their most profitable client segments and optimize marketing strategies.
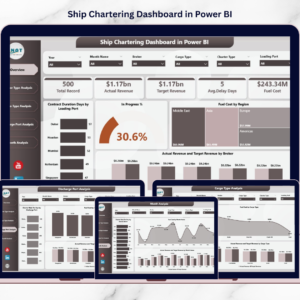
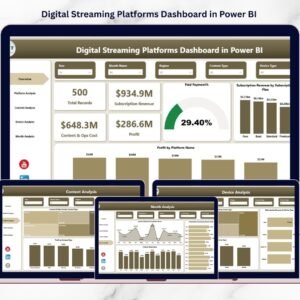
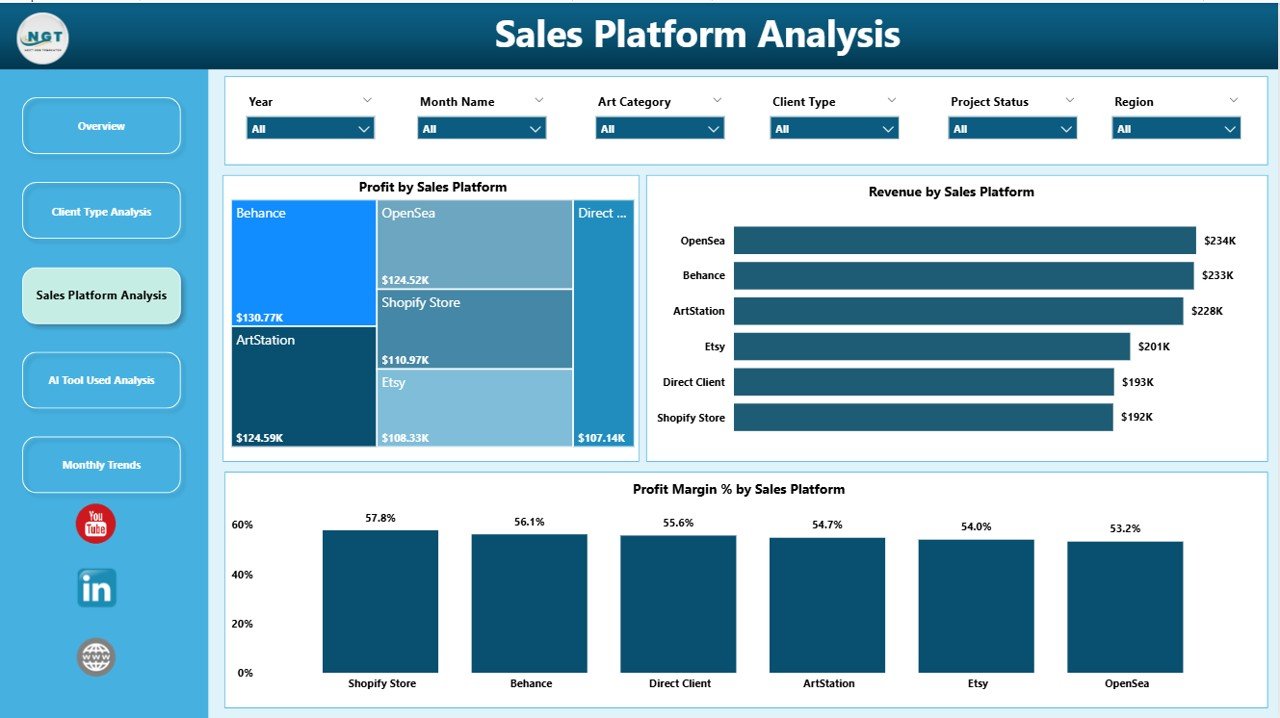
Sales Platform Analysis – Monitoring Sales Channels
AI art studios often sell artwork through multiple digital platforms such as:
• Online marketplaces
• NFT marketplaces
• Freelance platforms
• Direct client contracts
• Digital asset stores
Charts Included
• Profit by Sales Platform
• Revenue by Sales Platform
• Profit Margin % by Sales Platform
This analysis helps studios identify:
• Most profitable sales channels
• High-revenue platforms
• Low-margin platforms
Consequently, studios can allocate marketing resources more efficiently.
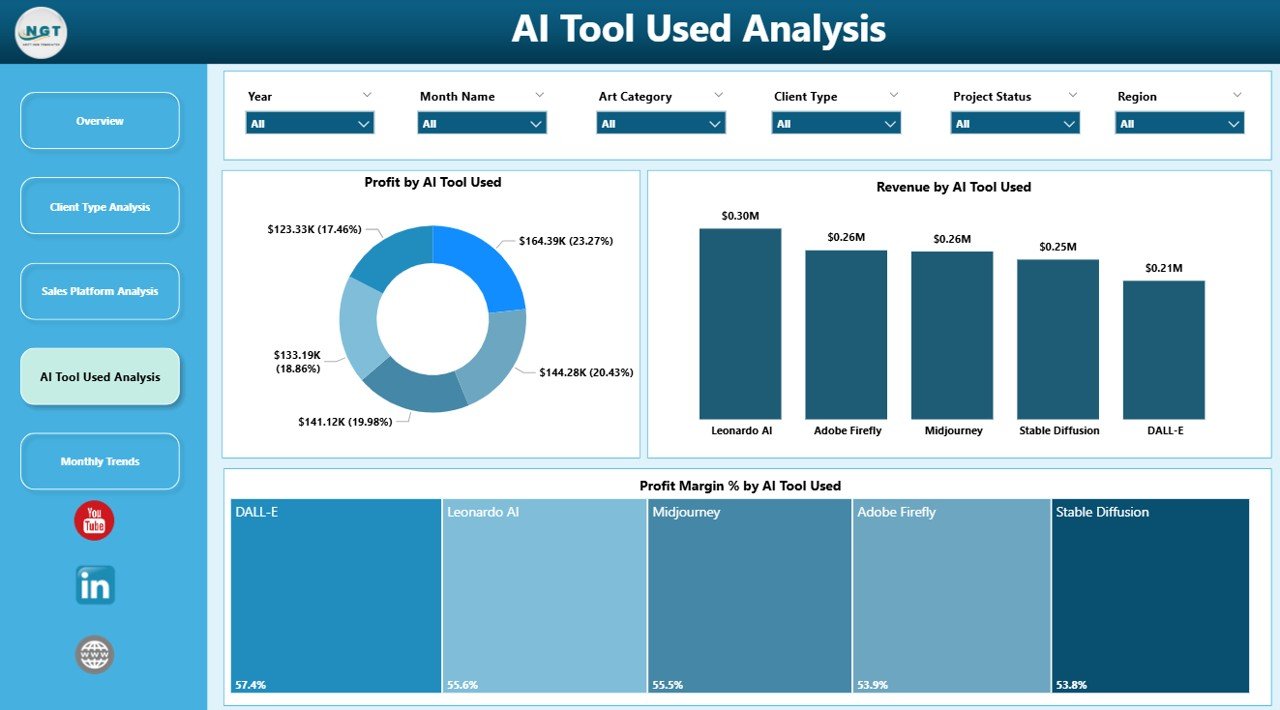
AI Tool Used Analysis – Evaluating Creative Technology
AI art studios rely heavily on different AI tools to generate artwork.
However, each tool impacts productivity and cost differently.
Charts Included
• Profit by Tool Used
• Revenue by Tool Used
• Profit Margin % by Tool Used
This analysis helps studios determine:
• Which tools generate higher profits
• Which tools increase production costs
• Which tools provide better operational efficiency
Therefore, studio managers can optimize tool subscriptions and investments.
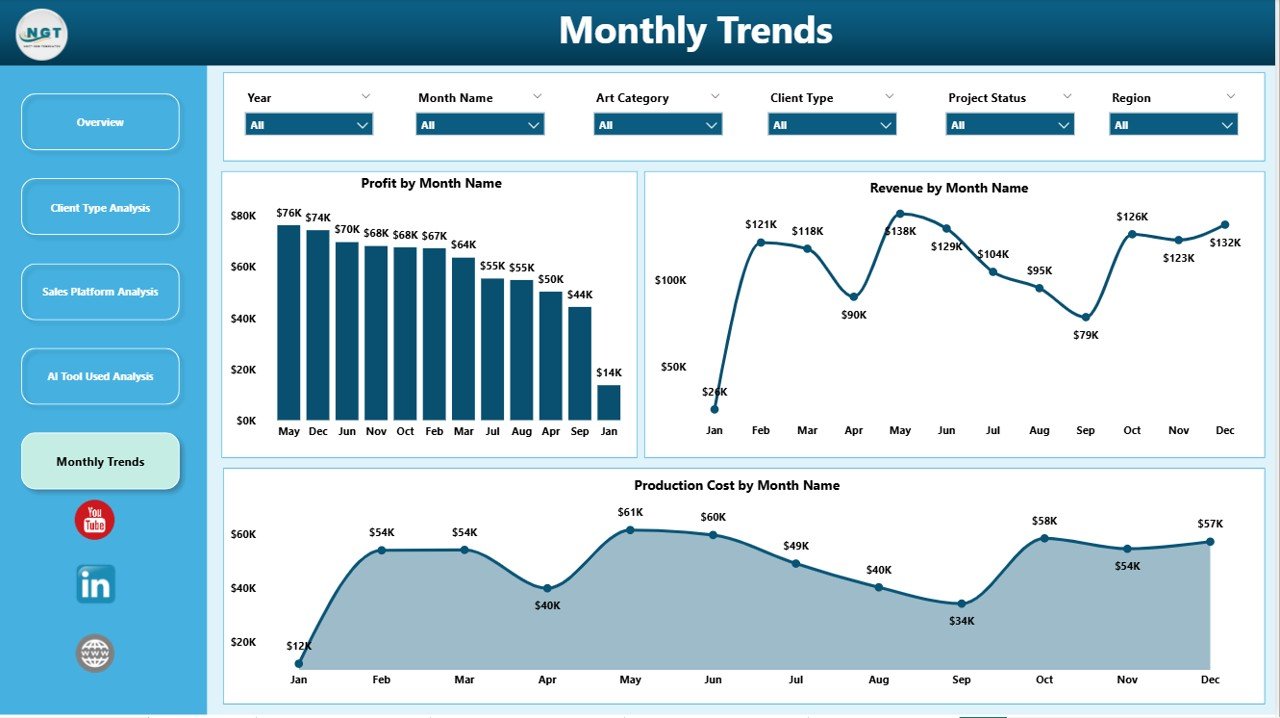
Month Analysis – Tracking Studio Growth Trends
Creative business performance often changes throughout the year.
Seasonal demand, marketing campaigns, and industry trends may influence artwork sales.
Charts Included
• Profit by Month
• Revenue by Month
• Production Cost by Month
This page helps studios identify:
• Seasonal sales trends
• High-performing months
• Cost fluctuations over time
Consequently, studios can improve financial planning and resource allocation.
⚙️ How to Use the AI Art Studios Dashboard
Using this dashboard is simple and efficient.
1️⃣ Upload studio business data into the dataset.
2️⃣ Include fields such as client type, art category, platform, AI tool, revenue, and cost.
3️⃣ Refresh the Power BI dashboard to update visuals.
4️⃣ Use slicers to filter data by platform, client type, or art category.
5️⃣ Analyze charts and KPIs to identify insights and opportunities.
Once the dataset updates, the dashboard automatically reflects the latest business performance.
👥 Who Can Benefit from This Dashboard
The AI Art Studios Dashboard in Power BI is useful for professionals working in digital creative industries.
It is particularly valuable for:
🎨 AI Art Studios
🖌 Digital Artists
🖼 NFT Creators
🏢 Creative Agencies
🎮 Game Art Studios
📊 Digital Marketing Design Teams
Because the dashboard combines operational analytics and financial insights, it supports both creative teams and business leaders.
💡 Advantages of AI Art Studios Dashboard in Power BI
Organizations gain several advantages by implementing this dashboard.
✔ Centralized creative business analytics
✔ Real-time business performance insights
✔ Better revenue and profitability monitoring
✔ Improved client behavior analysis
✔ Platform-level sales insights
✔ AI tool efficiency tracking
✔ Faster data-driven decision-making
✔ Better financial planning and cost control
Instead of relying on manual reports, studios can use Power BI dashboards to monitor creative operations and scale their business efficiently.
The dashboard converts complex studio data into clear visual insights that help AI art studios grow faster and remain competitive.
### Click here to read the Detailed blog post
Visit our YouTube channel to learn step-by-step video tutorials
https://youtube.com/@PKAnExcelExpert