Agricultural exports are a vital part of the global economy. Countries export large volumes of agricultural products such as grains, fruits, vegetables, spices, dairy products, and processed foods to international markets. However, managing export operations can become extremely complex for agro export companies.
Export businesses must manage multiple suppliers, shipment modes, export destinations, ports, and regional markets simultaneously. They also need to monitor export costs, profit margins, shipment performance, and regional demand trends. When companies rely on scattered spreadsheets or manual reports, analyzing this information becomes time-consuming and inefficient.
This is where the Agro Export Companies Dashboard in Power BI becomes an extremely powerful analytics solution.
The Agro Export Companies Dashboard in Power BI is an interactive business intelligence tool designed to help export managers monitor export costs, analyze profitability, track shipment modes, and evaluate regional export performance through dynamic visual dashboards.
Because Power BI provides advanced visualization tools, slicers, filters, and interactive charts, businesses can transform complex export datasets into meaningful insights that support faster and smarter decision-making.
🌍 Key Feature of Agro Export Companies Dashboard in Power BI
This dashboard includes several powerful analytics capabilities designed specifically for agricultural export businesses.
📊 Centralized Export Performance Monitoring – Track export costs, values, profits, and shipment activities in a single dashboard.
📈 Export Value Analysis by Destination Country – Identify top export destinations generating the highest revenue.
📦 Product Category Performance Tracking – Monitor profitability across different agricultural product categories.
🚢 Shipment Mode Performance Analysis – Compare export costs and performance across shipment modes such as air, sea, and land.
🏢 Export Company Activity Monitoring – Evaluate export performance across multiple export companies.
🌍 Regional Profit Analysis – Identify regions delivering the highest export profits.
📅 Monthly Export Trend Analysis – Monitor export demand fluctuations throughout the year.
🔎 Interactive Filters and Slicers – Drill down into export data by company, product, shipment mode, region, or destination country.
⚡ Real-Time Business Intelligence – Refresh the dataset to instantly update all export analytics.
Because of these capabilities, export managers gain complete visibility into global agricultural trade operations.
📊 What’s Inside the Agro Export Companies Dashboard in Power BI
The dashboard contains five analytical pages designed to analyze export operations from multiple perspectives.
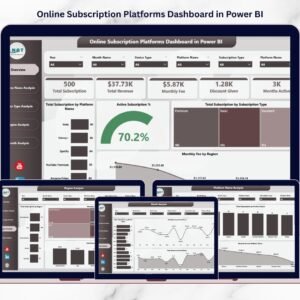
Overview Page – Complete Export Performance Snapshot
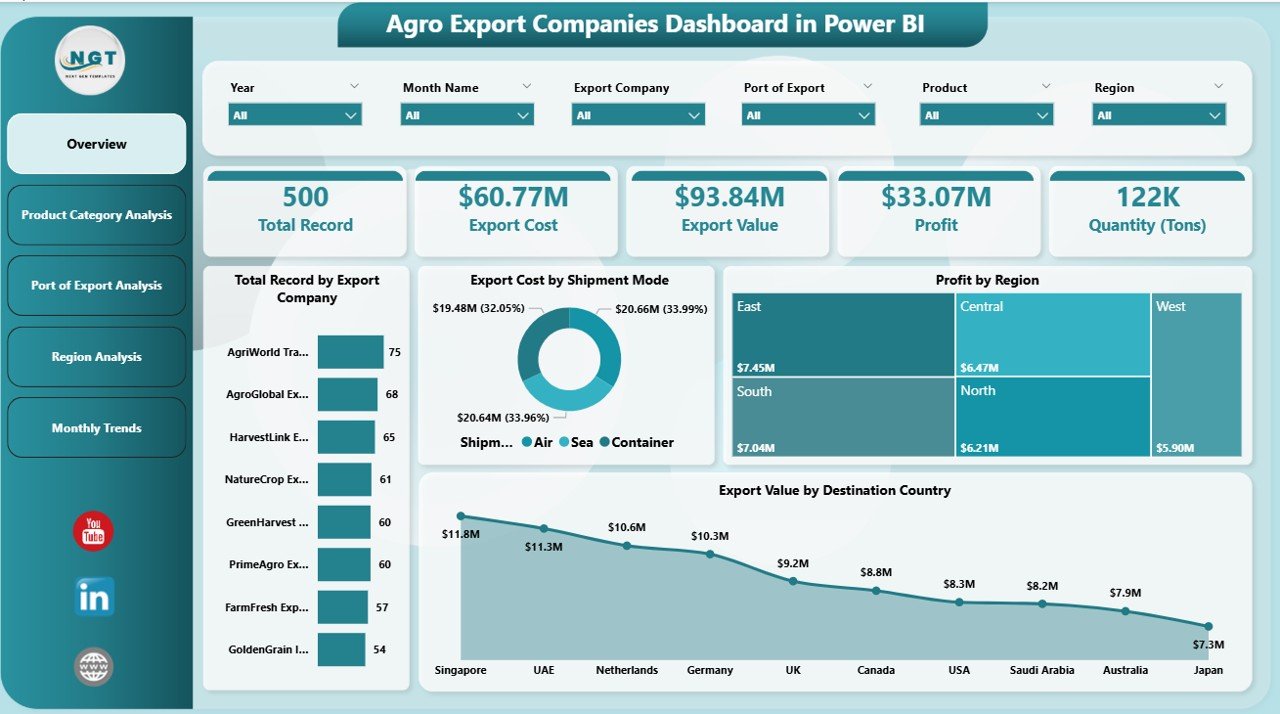
The Overview Page acts as the central monitoring interface of the dashboard.
It provides a quick overview of export activities and key performance indicators.
Interactive slicers allow users to filter export data dynamically.
KPI Cards Included
• Total Record by Export Company
• Export Cost by Shipment Mode
• Profit by Region
• Export Value by Destination Country
Why the Overview Page Is Important
This page helps managers quickly identify:
• Which export companies handle the most transactions
• Which shipment modes generate the highest export costs
• Which regions produce the highest profits
• Which destination countries generate the most export value
Because all major KPIs appear in one place, decision-makers can quickly evaluate export performance.
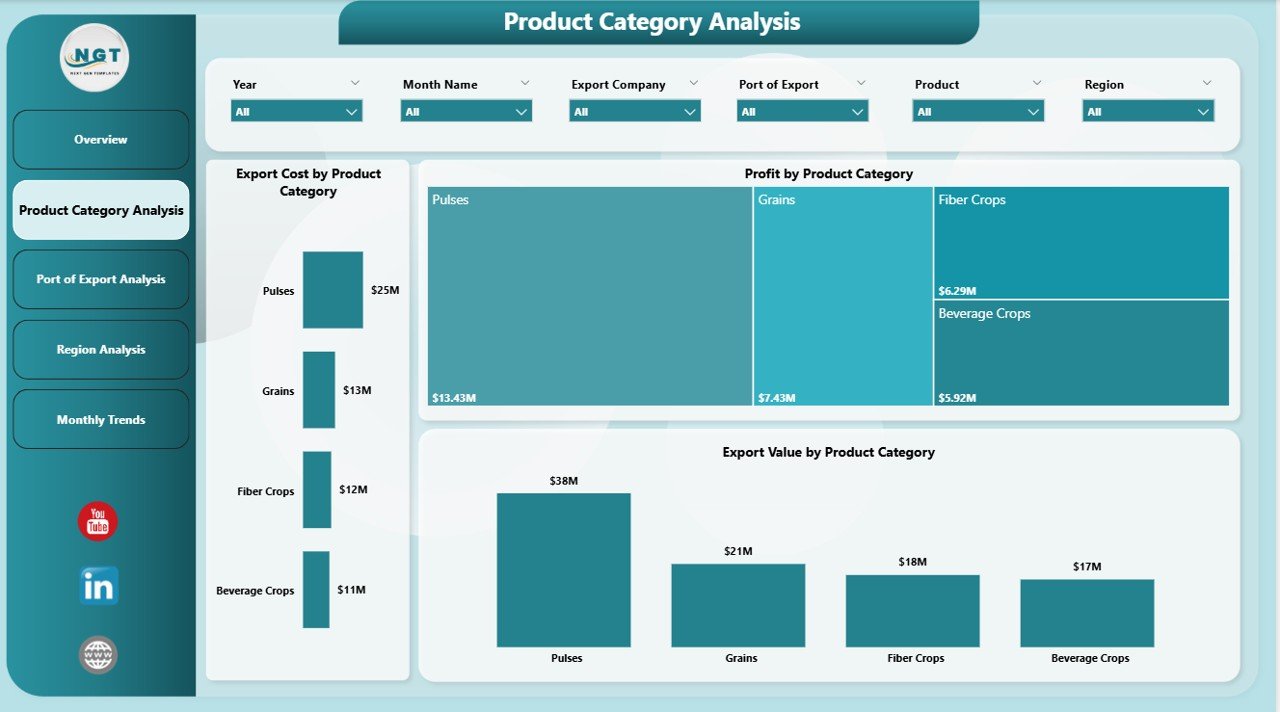
Product Category Analysis – Understanding Product Performance
Agro export companies deal with multiple agricultural products such as grains, fruits, vegetables, spices, and processed food items.
The Product Category Analysis Page evaluates export performance by product category.
Charts Included
• Export Cost by Product Category
• Profit by Product Category
• Export Value by Product Category
Insights Provided
This page helps companies identify:
• High-revenue agricultural products
• Products with higher logistics costs
• Product categories generating the highest profit margins
As a result, businesses can optimize product portfolios and focus on high-value exports.
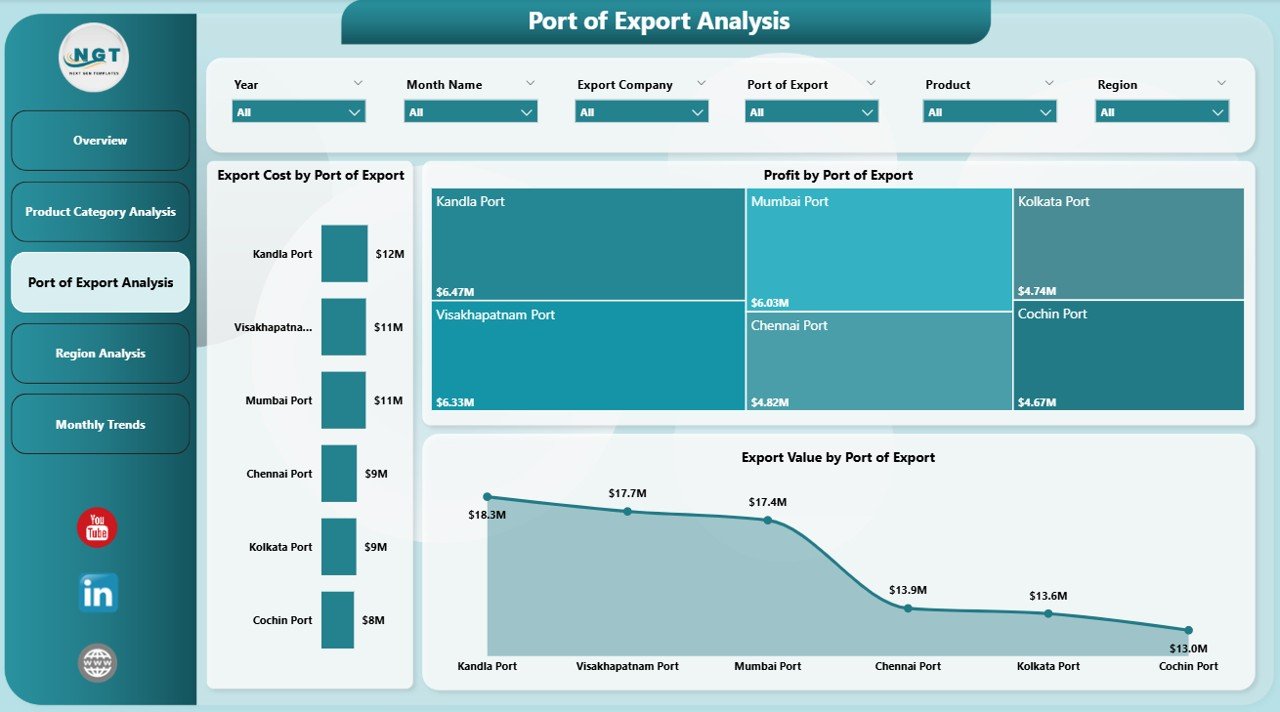
Port of Export Analysis – Evaluating Logistics Performance
Export logistics heavily depends on ports used for international shipments.
The Port of Export Analysis Page evaluates export performance based on port locations.
Charts Included
• Export Cost by Port of Export
• Profit by Port of Export
• Export Value by Port of Export
Benefits of Port Analysis
Logistics managers can:
• Identify ports handling the largest export volumes
• Compare transportation costs across ports
• Evaluate profit margins by export port
This analysis helps companies optimize shipping routes and reduce logistics expenses.
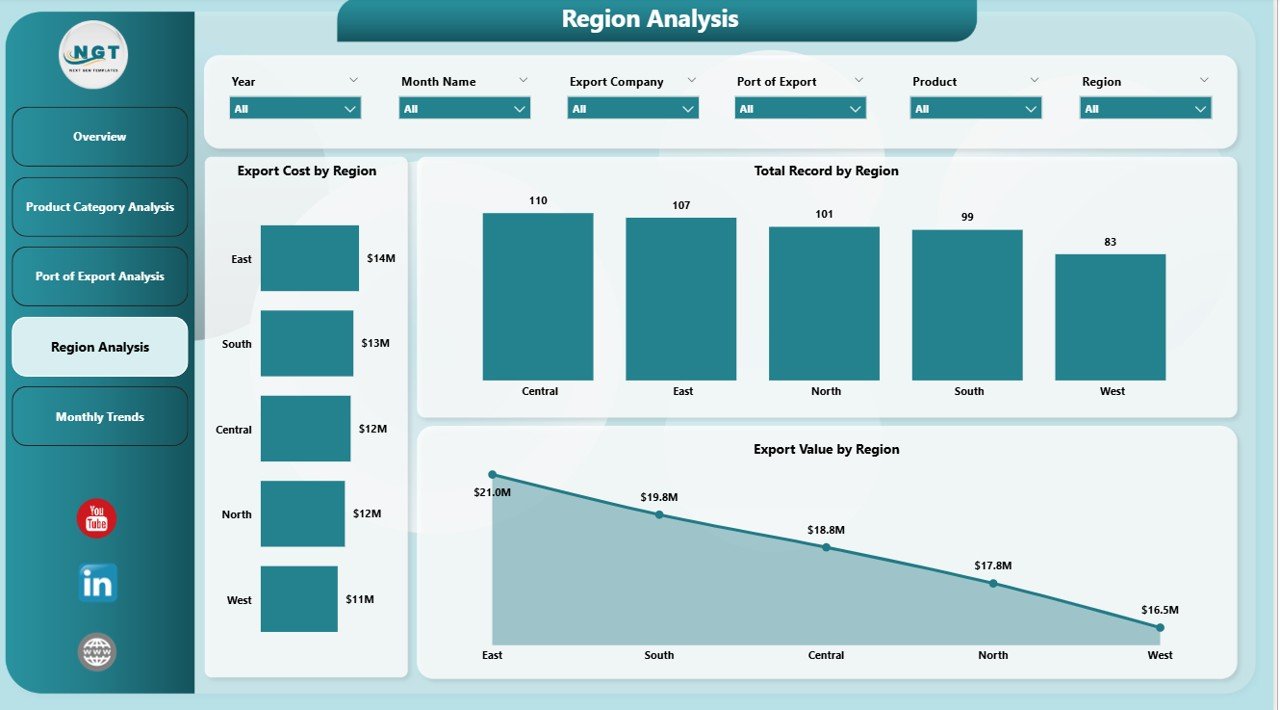
Region Analysis – Monitoring Global Export Markets
Agricultural exports vary across regions depending on demand, pricing, and trade policies.
The Region Analysis Page evaluates export performance across different global regions.
Charts Included
• Export Cost by Region
• Profit by Region
• Export Value by Region
Why Regional Analysis Matters
Regional insights help companies:
• Identify high-growth export markets
• Analyze regional profitability
• Monitor regional logistics costs
As a result, businesses can expand operations in the most profitable regions.
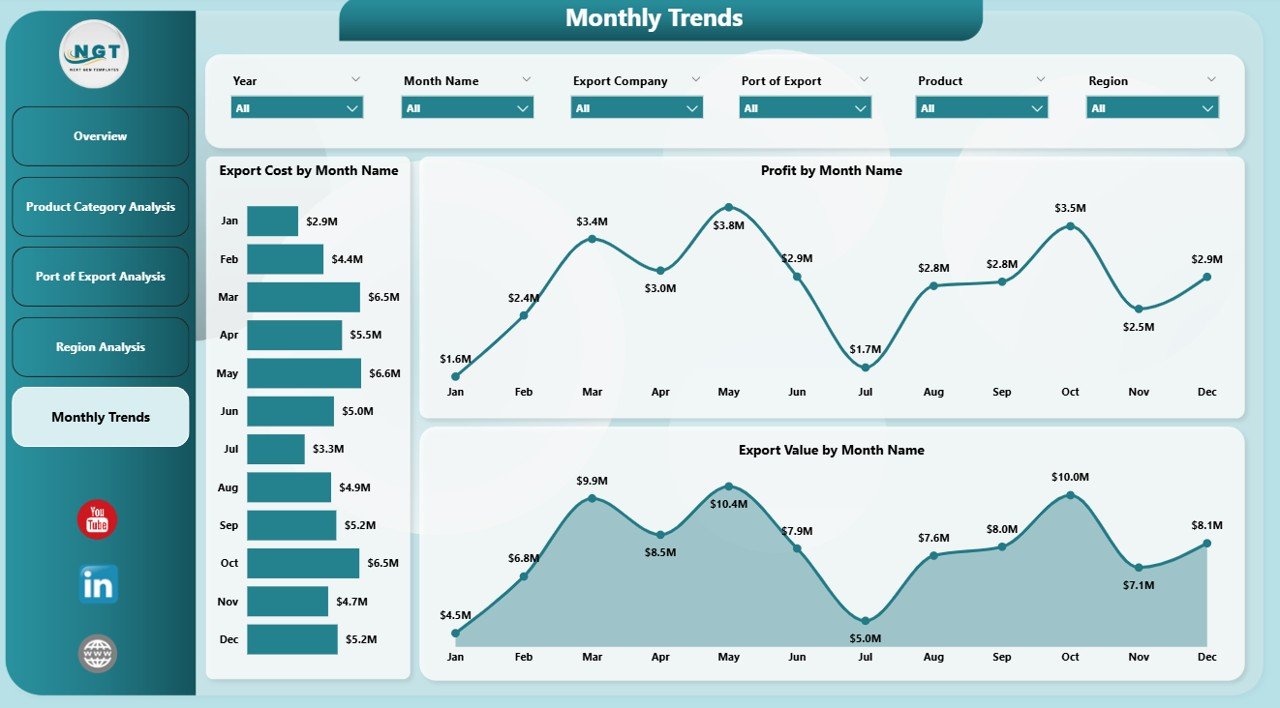
Month Analysis – Tracking Seasonal Export Trends
Agricultural exports often follow seasonal demand cycles.
For example, harvest seasons and weather patterns significantly influence export volumes.
The Month Analysis Page helps companies monitor export trends throughout the year.
Charts Included
• Export Cost by Month
• Profit by Month
• Export Value by Month
Benefits of Monthly Analysis
Monthly insights allow businesses to:
• Identify peak export seasons
• Forecast future export demand
• Plan production and logistics strategies
Consequently, organizations improve operational planning and supply chain management.
⚙️ How to Use the Agro Export Companies Dashboard
Using this dashboard is simple and efficient.
1️⃣ Import export data into Power BI from Excel or databases.
2️⃣ Connect the dataset to the Power BI dashboard.
3️⃣ Refresh the dataset to update charts and KPIs.
4️⃣ Use slicers to filter export data by product category, region, shipment mode, or destination country.
5️⃣ Analyze visual insights to identify export trends and opportunities.
Once the dataset refreshes, the dashboard automatically updates.
👥 Who Can Benefit from This Dashboard
This dashboard is useful for professionals working in agricultural exports and international trade.
It is particularly valuable for:
🌾 Agro Export Companies
🚢 Export Logistics Managers
📊 Supply Chain Analysts
📈 Financial Analysts
🌍 International Trade Consultants
🏢 Agricultural Trading Firms
Because the dashboard combines operational and financial insights, it supports both strategic and operational decision-making.
💡 Advantages of Agro Export Companies Dashboard in Power BI
Organizations gain several important benefits by implementing this dashboard.
✔ Centralized monitoring of export operations
✔ Faster identification of profitable export markets
✔ Improved logistics cost analysis
✔ Better product performance tracking
✔ Enhanced regional market insights
✔ Seasonal export demand forecasting
✔ Data-driven export strategy planning
Instead of relying on manual reporting, export businesses can use interactive Power BI dashboards to analyze global agricultural trade performance efficiently.
This dashboard transforms export data into actionable insights that help companies expand international trade operations and improve profitability.
Click here to read the Detailed blog post
Visit our YouTube channel to learn step-by-step video tutorials
https://youtube.com/@PKAnExcelExpert