Modern agriculture relies heavily on advanced machinery such as tractors, harvesters, seeders, irrigation systems, and other farming equipment. These machines help farmers increase productivity, reduce manual labor, and improve operational efficiency. However, managing machinery sales, service costs, maintenance activities, warranty claims, and regional demand can become extremely complex for agricultural equipment companies.
Agricultural machinery manufacturers, distributors, and service centers often deal with thousands of machinery transactions every year. They must manage dealer networks, customer segments, service records, and seasonal demand patterns. When organizations rely only on spreadsheets or disconnected reports, analyzing this information becomes difficult.
This is where the Agricultural Machinery Dashboard in Power BI becomes an extremely valuable solution.
The Agricultural Machinery Dashboard in Power BI is a powerful analytics tool designed to help agricultural equipment businesses monitor sales performance, analyze service costs, evaluate warranty claims, track customer trends, and understand regional machinery demand using interactive visual dashboards.
Because Power BI provides advanced data visualization, dynamic filters, interactive charts, and automated reporting, organizations can easily convert complex machinery data into actionable insights.
As a result, decision-makers can monitor operations in real time and make faster strategic decisions.
🚜 Key Feature of Agricultural Machinery Dashboard in Power BI
This dashboard provides powerful analytics capabilities that help agricultural machinery businesses monitor performance and improve operational efficiency.
📊 Centralized Machinery Analytics – Monitor sales, service costs, and warranty claims in a single dashboard.
📈 Machinery Sales Performance Tracking – Analyze revenue performance across machinery types and regions.
🔧 Service Cost Monitoring – Track maintenance expenses for different machinery categories.
📦 Warranty Claims Analysis – Identify machinery models with the highest warranty claims.
🏪 Dealer Sales Target Monitoring – Evaluate dealer performance and target achievement.
👨🌾 Customer Segment Analysis – Understand purchasing behavior across different customer types.
🌍 Regional Demand Analysis – Identify regions with the highest machinery demand.
📅 Monthly Sales Trend Analysis – Monitor seasonal fluctuations in machinery sales.
🔎 Interactive Slicers and Filters – Drill down into data by machinery type, region, dealer, or customer category.
⚡ Real-Time Business Insights – Automatically refresh and update performance metrics.
These features allow businesses to quickly identify trends, monitor operations, and improve decision-making.
📊 What’s Inside the Agricultural Machinery Dashboard in Power BI
The dashboard includes five analytical pages designed to analyze agricultural machinery operations from multiple perspectives.
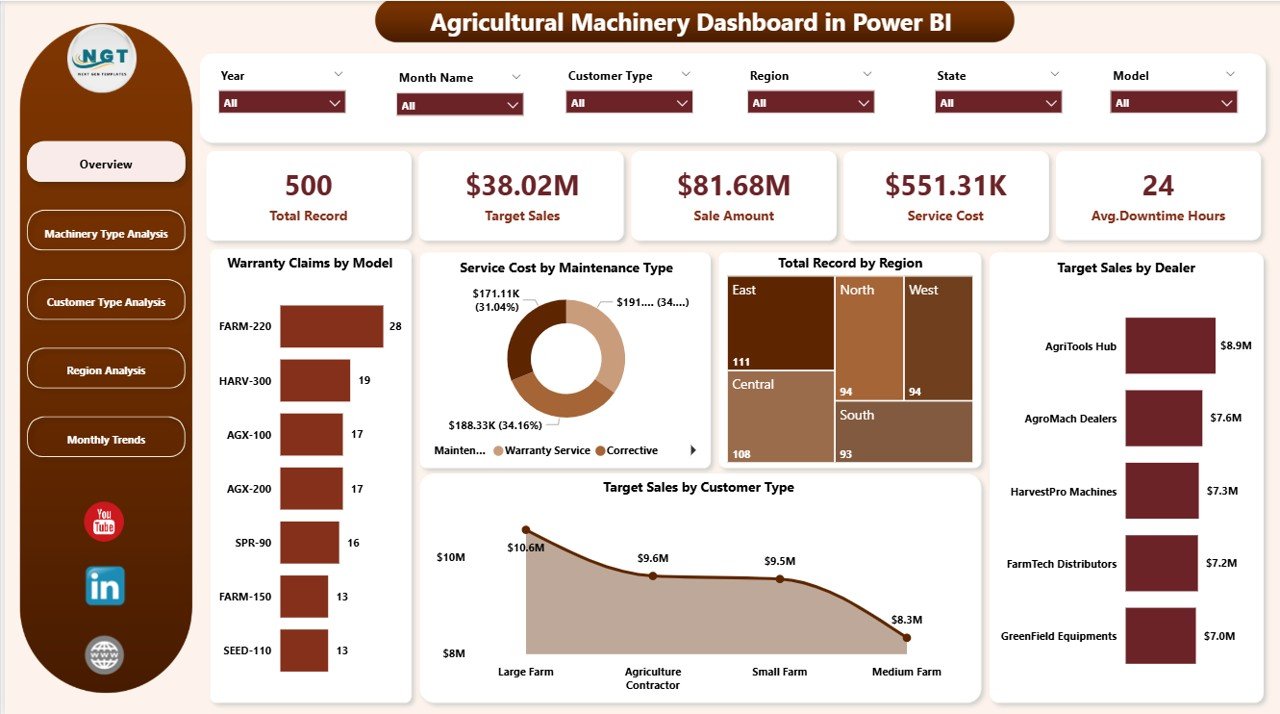
Overview Page – Complete Machinery Performance Snapshot
The Overview Page acts as the main control center of the dashboard.
It provides a quick summary of machinery operations across multiple business dimensions.
The page includes interactive slicers that allow users to filter the dashboard dynamically.
KPI Cards Included
The overview page displays five important KPIs:
• Warranty Claims by Model
• Service by Maintenance Type
• Total Record by Region
• Target Sales by Dealer
• Target Sales by Customer Type
Why the Overview Page is Important
Managers can quickly understand:
• Which machinery models generate the most warranty claims
• Which regions generate the highest machinery demand
• Which dealers achieve sales targets
• Which customer segments drive machinery purchases
Because all key metrics appear on one screen, decision-makers can quickly identify operational trends.
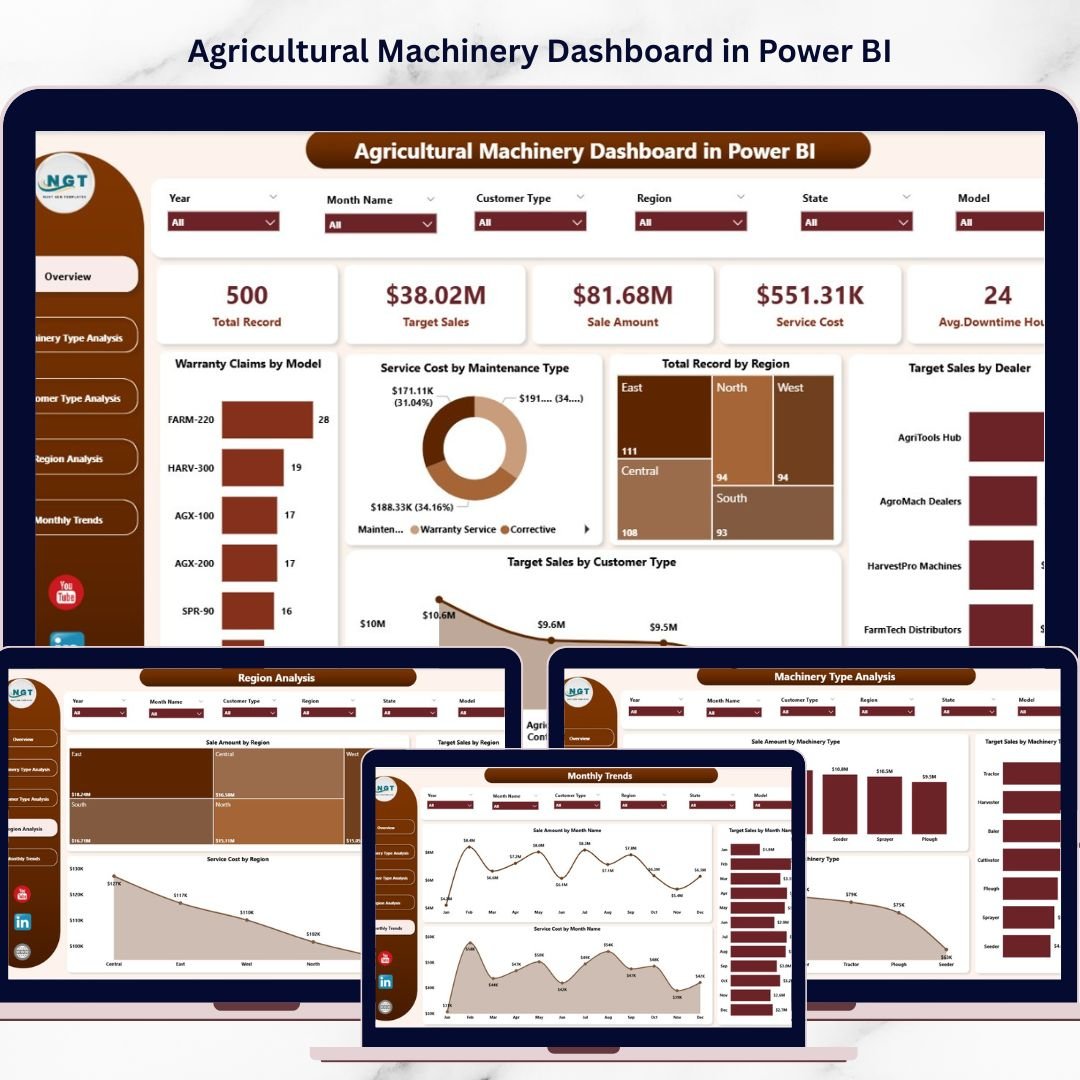
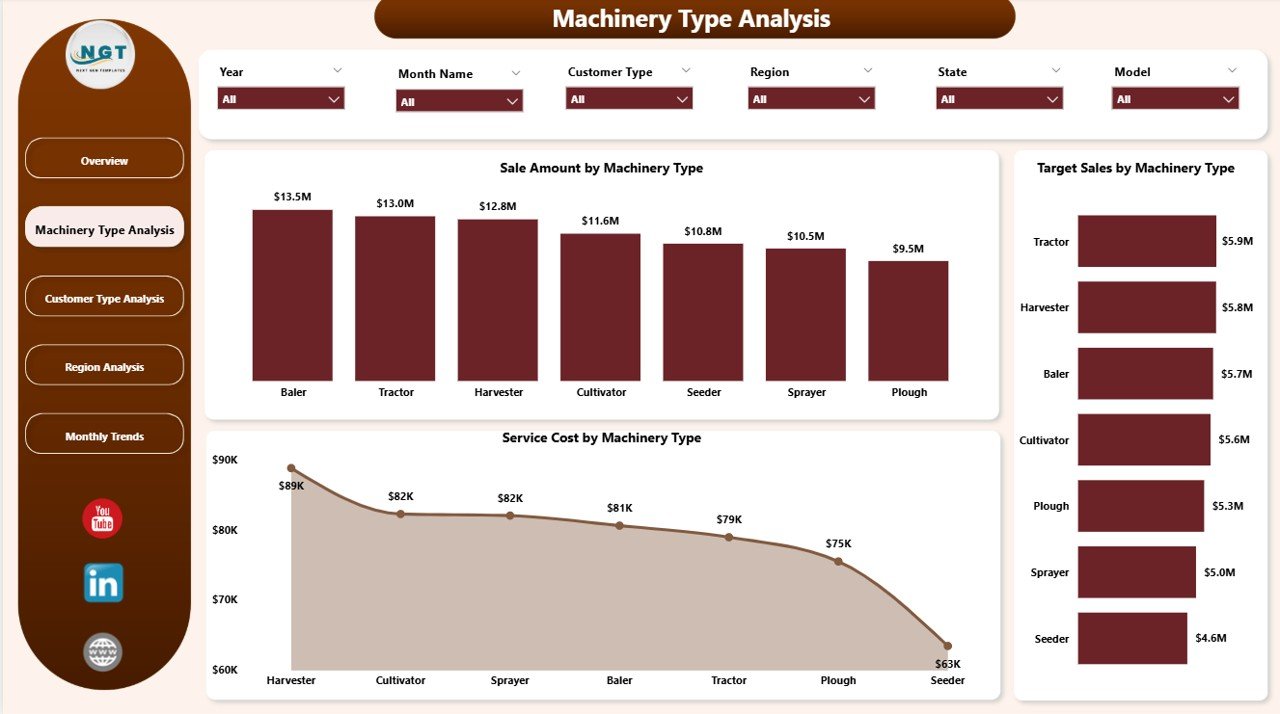
Machinery Type Analysis – Understanding Product Performance
Agricultural equipment companies sell many types of machines including tractors, ploughs, harvesters, irrigation machines, and seeders.
However, each machinery category performs differently in the market.
The Machinery Type Analysis Page helps organizations evaluate performance across different machinery categories.
Charts Included
• Sales Amount by Machinery Type
• Target Sales by Machinery Type
• Service Cost by Machinery Type
Insights Provided
This page helps managers determine:
• Which machinery types generate the highest revenue
• Which products struggle to meet sales targets
• Which machines require higher maintenance costs
These insights help companies optimize product strategies and improve equipment performance.
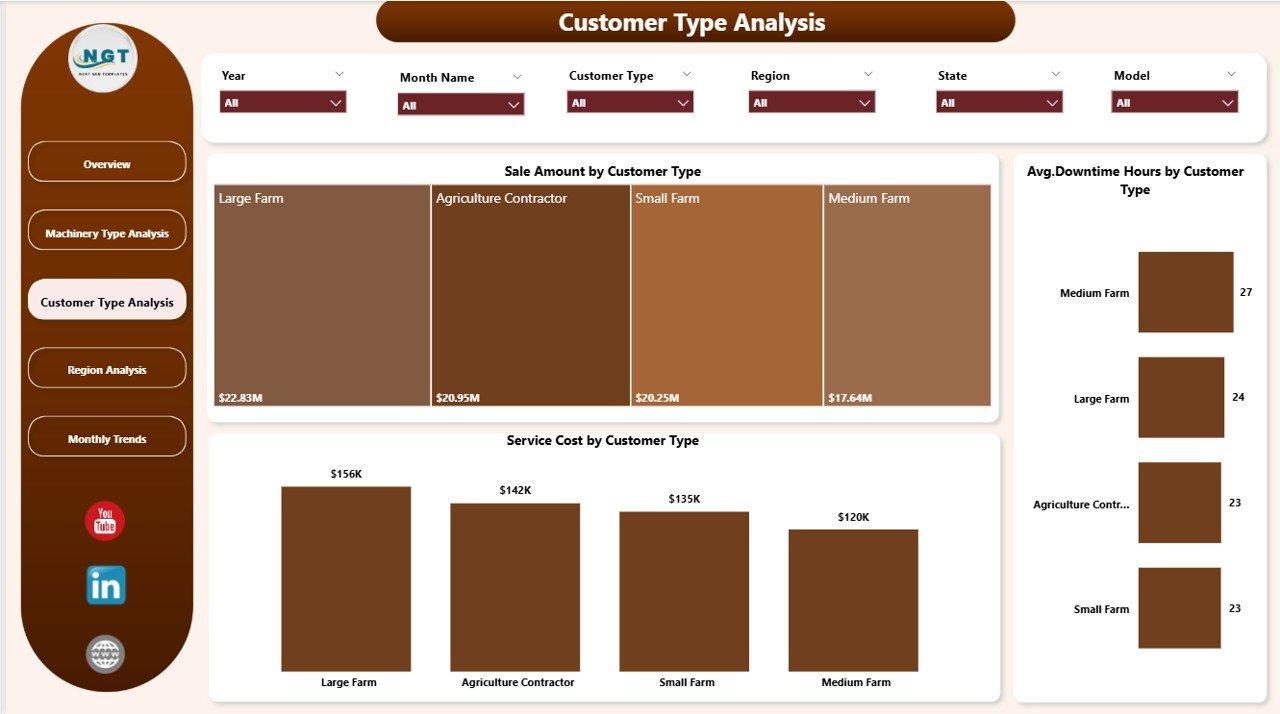
Customer Type Analysis – Understanding Customer Segments
Agricultural machinery companies serve different customer groups such as farmers, cooperatives, agricultural corporations, and equipment rental companies.
Each customer segment behaves differently in the market.
The Customer Type Analysis Page analyzes machinery performance across customer categories.
Charts Included
• Sales Amount by Customer Type
• Average Downtime Hours by Customer Type
• Service Cost by Customer Type
Benefits of Customer Analysis
Customer insights help businesses:
• Identify high-value customer segments
• Improve customer service strategies
• Reduce machinery downtime
• Design targeted marketing campaigns
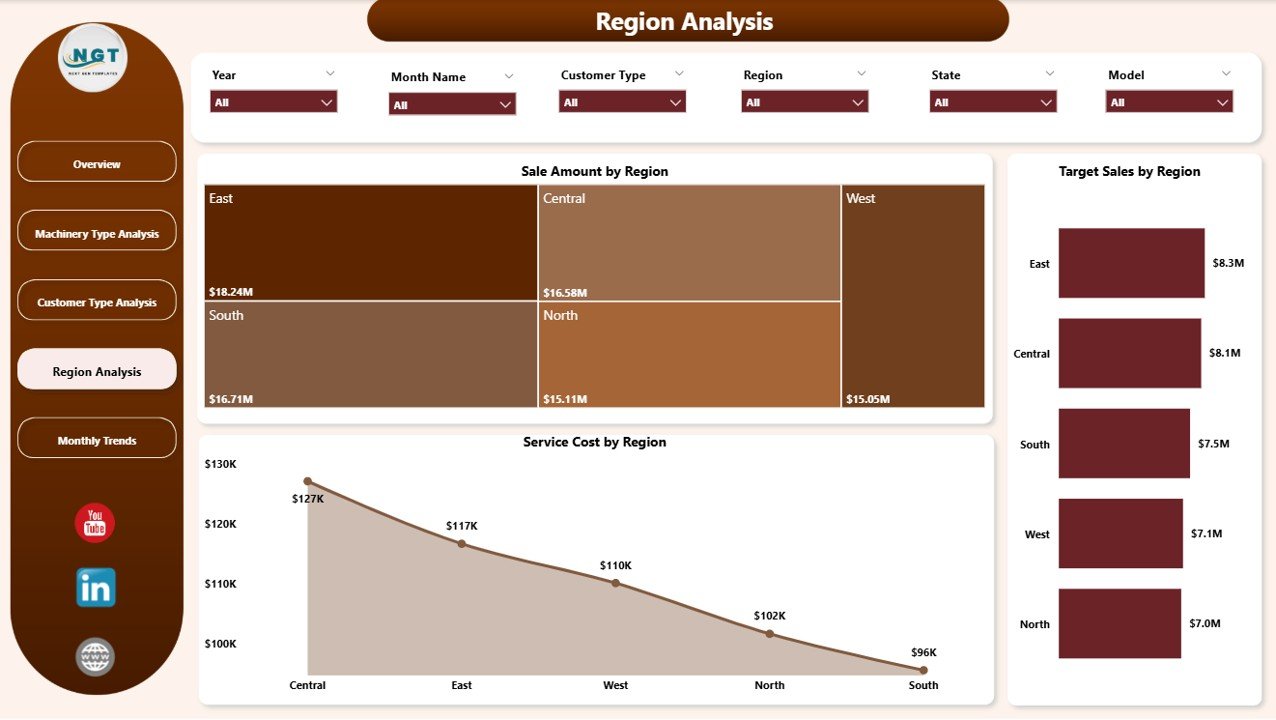
Region Analysis – Monitoring Regional Machinery Demand
Agricultural machinery demand varies widely across regions due to differences in climate, crops, and farming practices.
The Region Analysis Page helps businesses analyze regional performance.
Charts Included
• Sales Amount by Region
• Target Sales by Region
• Service Cost by Region
Why Regional Analysis Matters
Regional insights allow companies to:
• Identify high-demand agricultural markets
• Evaluate dealer performance by region
• Monitor regional service costs
• Improve distribution strategies
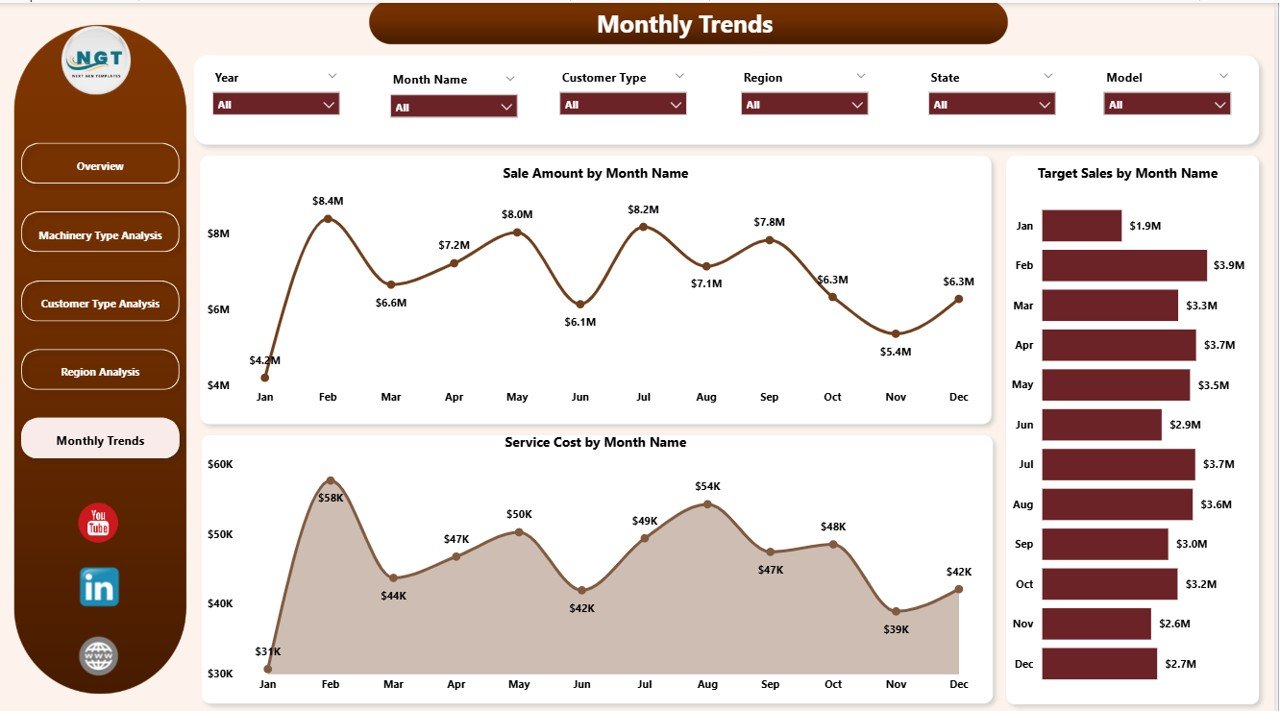
Month Analysis – Tracking Seasonal Machinery Trends
Agricultural machinery sales often follow seasonal patterns.
For example, farmers purchase equipment before planting or harvesting seasons.
The Month Analysis Page helps organizations analyze seasonal trends.
Charts Included
• Sales Amount by Month
• Target Sales by Month
• Service Cost by Month
Benefits of Monthly Analysis
This analysis helps businesses:
• Forecast future machinery demand
• Improve inventory planning
• Optimize marketing campaigns
• Allocate service resources effectively
⚙️ How to Use the Agricultural Machinery Dashboard
Using this dashboard is simple and efficient.
1️⃣ Import machinery operational data into Power BI.
2️⃣ Connect the dashboard to the dataset (Excel, database, or ERP system).
3️⃣ Refresh the dataset to update dashboard visuals.
4️⃣ Use slicers to filter data by region, machinery type, dealer, or customer category.
5️⃣ Analyze the charts and KPIs to monitor machinery performance.
Once data refreshes, all insights update automatically.
👥 Who Can Benefit from This Dashboard
This dashboard is designed for professionals working in agricultural machinery and agribusiness industries.
It is particularly useful for:
🚜 Agricultural Equipment Manufacturers
🏪 Machinery Dealers
📦 Equipment Distributors
🛠 Agricultural Service Centers
📊 Business Analysts
📈 Sales Managers
Because the dashboard combines operational and financial insights, multiple teams across the organization can use it effectively.
💡 Advantages of Agricultural Machinery Dashboard in Power BI
Organizations gain several benefits by implementing this dashboard.
✔ Centralized monitoring of machinery sales and operations
✔ Faster identification of high-performing products
✔ Better service cost and maintenance monitoring
✔ Improved warranty claim analysis
✔ Dealer performance tracking
✔ Regional market insights
✔ Seasonal demand forecasting
✔ Data-driven decision-making
Instead of relying on manual reporting, agricultural equipment companies can use interactive Power BI dashboards to monitor business performance efficiently.
This dashboard converts complex machinery data into clear insights that help organizations improve operational efficiency and profitability.
### Click here to read the Detailed blog post
Visit our YouTube channel to learn step-by-step video tutorials
https://youtube.com/@PKAnExcelExpert