Agricultural Machinery Dashboard plays a critical role in modern farming operations. Farmers, agricultural equipment manufacturers, dealers, and service providers rely on machines such as tractors, harvesters, seeders, sprayers, and irrigation systems to increase productivity and improve farming efficiency. However, managing agricultural machinery operations generates large volumes of data.
Businesses must track machinery sales, service costs, warranty claims, downtime hours, dealer performance, and customer demand across different regions. When this data is stored across multiple spreadsheets, managers often struggle to analyze trends or identify operational issues.
This is where the Agricultural Machinery Dashboard in Excel becomes an extremely powerful solution.
The Agricultural Machinery Dashboard in Excel is a ready-to-use analytical template designed to help agricultural businesses monitor machinery performance, track sales trends, evaluate service costs, and analyze customer demand.
Because Excel offers powerful tools such as pivot tables, pivot charts, slicers, and automated calculations, this dashboard converts raw operational data into interactive visual insights.
As a result, decision-makers can quickly understand business performance and take data-driven actions that improve operational efficiency.
🚜 Key Feature of Agricultural Machinery Dashboard in Excel
This dashboard provides powerful analytical features designed for agricultural equipment performance monitoring.
📊 Centralized Machinery Performance Monitoring – Analyze sales, service costs, downtime, and warranty claims in one dashboard.
📈 Dealer Sales Target Tracking – Monitor dealer performance and compare target sales across the network.
🔧 Service Cost Analysis – Evaluate maintenance expenses across machinery types and customer categories.
📉 Downtime Monitoring – Track machinery downtime hours to identify operational inefficiencies.
📦 Warranty Claims Analysis – Identify machinery models with higher warranty claims.
🌍 Regional Sales Performance Analysis – Understand which regions generate the highest machinery demand.
👨🌾 Customer Segment Insights – Analyze machinery performance across different customer types.
📅 Monthly Sales Trend Analysis – Track seasonal demand for agricultural equipment.
🔎 Interactive Slicers and Filters – Explore machinery data dynamically.
⚙️ Excel-Based Pivot Analytics – Use pivot charts and slicers for flexible analysis.
Because of these features, agricultural companies gain complete visibility into machinery operations and market demand.
📦 What’s Inside the Agricultural Machinery Dashboard in Excel
This Excel dashboard includes five analytical pages designed to analyze agricultural machinery operations from multiple perspectives.
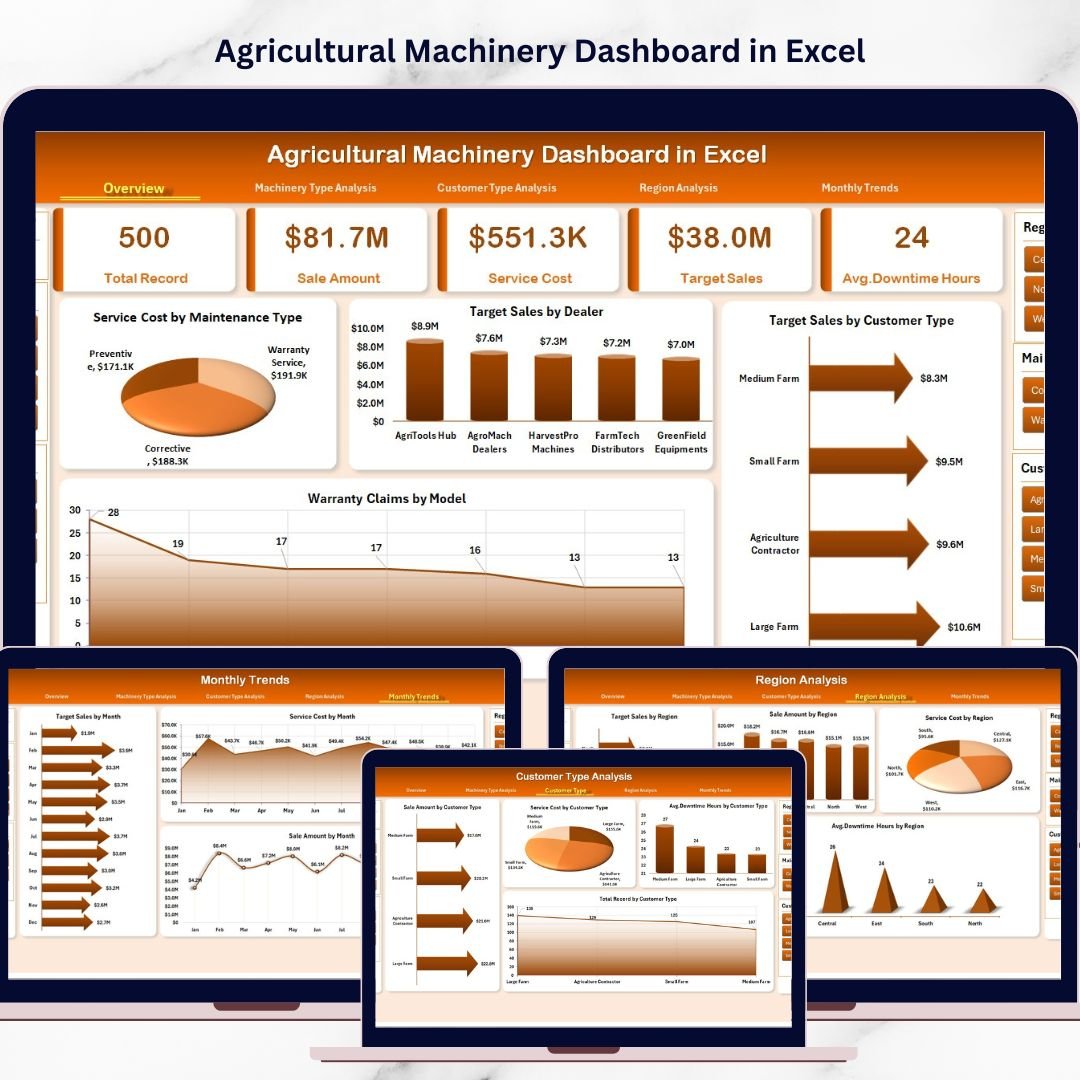
Overview Page
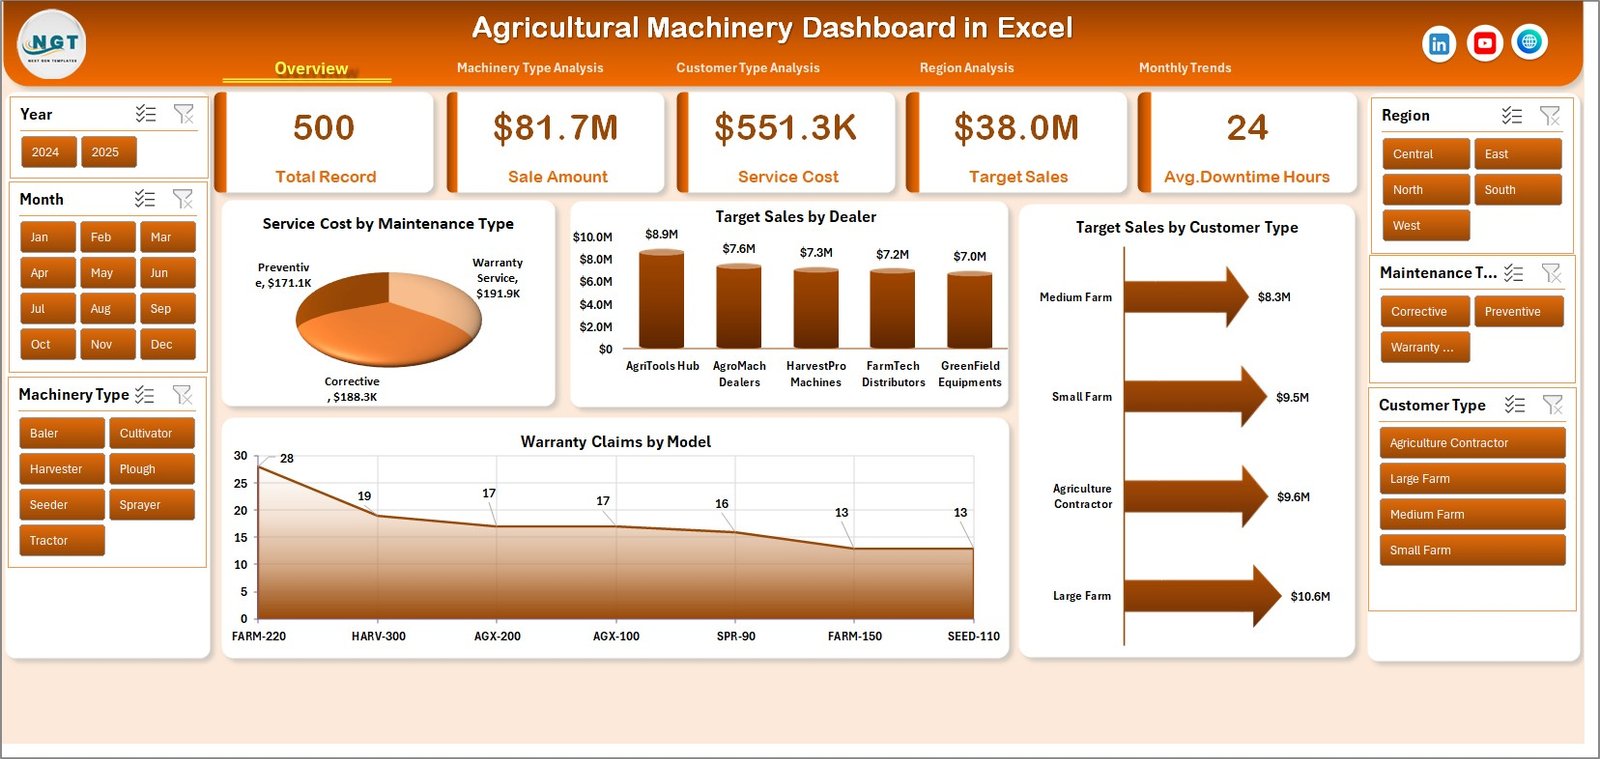
The Overview Page provides a quick snapshot of machinery performance.
KPI cards summarize overall business performance.
Charts included:
Service Cost by Maintenance Type
Target Sales by Dealer
Target Sales by Customer Type
Warranty Claims by Model
This page helps managers quickly evaluate overall machinery operations.
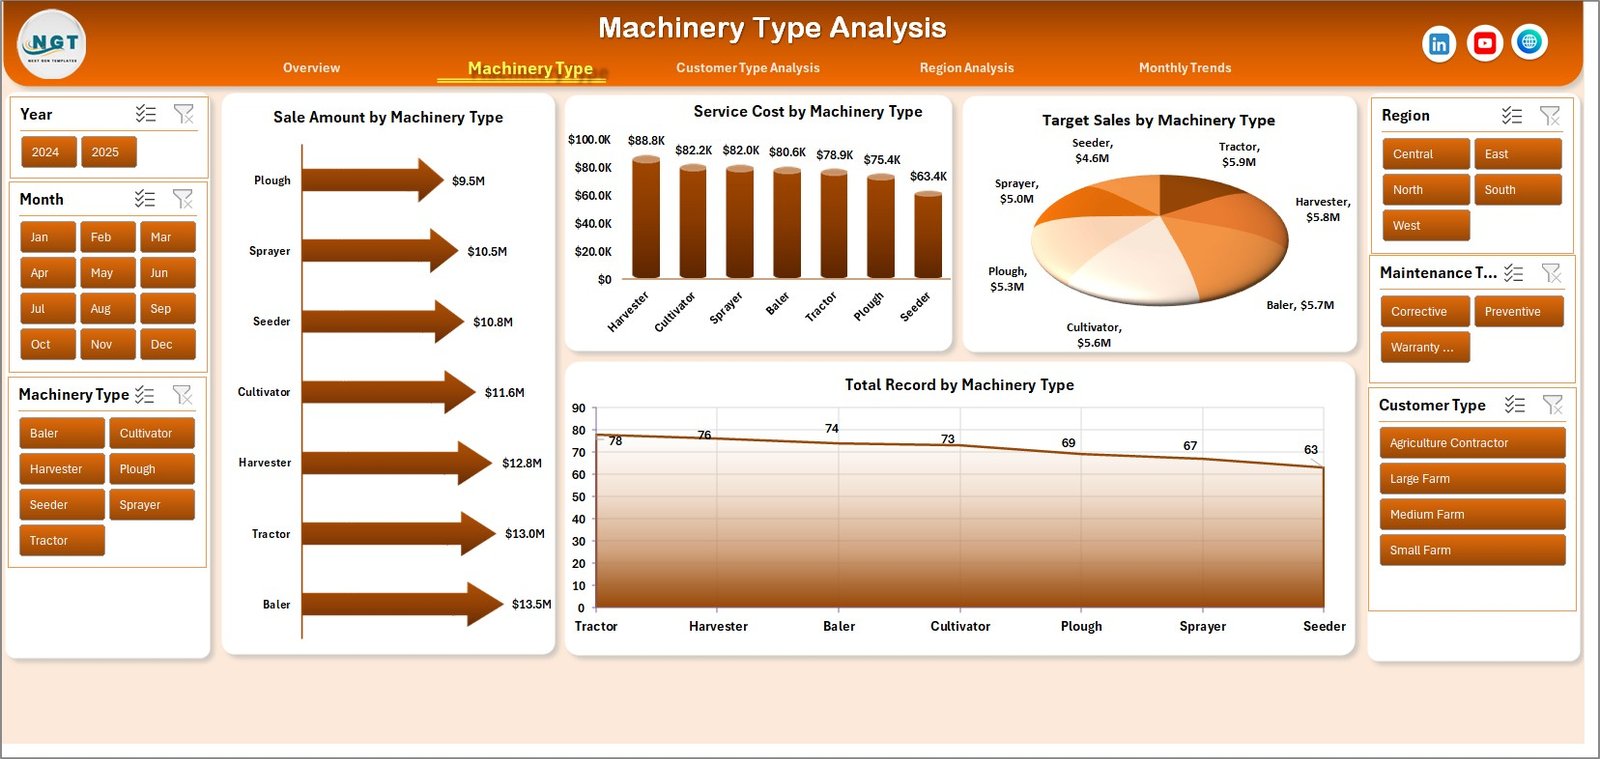
Machinery Type Analysis
This page analyzes machinery performance by equipment category.
Charts included:
Service Cost by Machinery Type
Target Sales by Machinery Type
Sales Amount by Machinery Type
Total Records by Machinery Type
This analysis helps organizations identify high-demand machinery types.
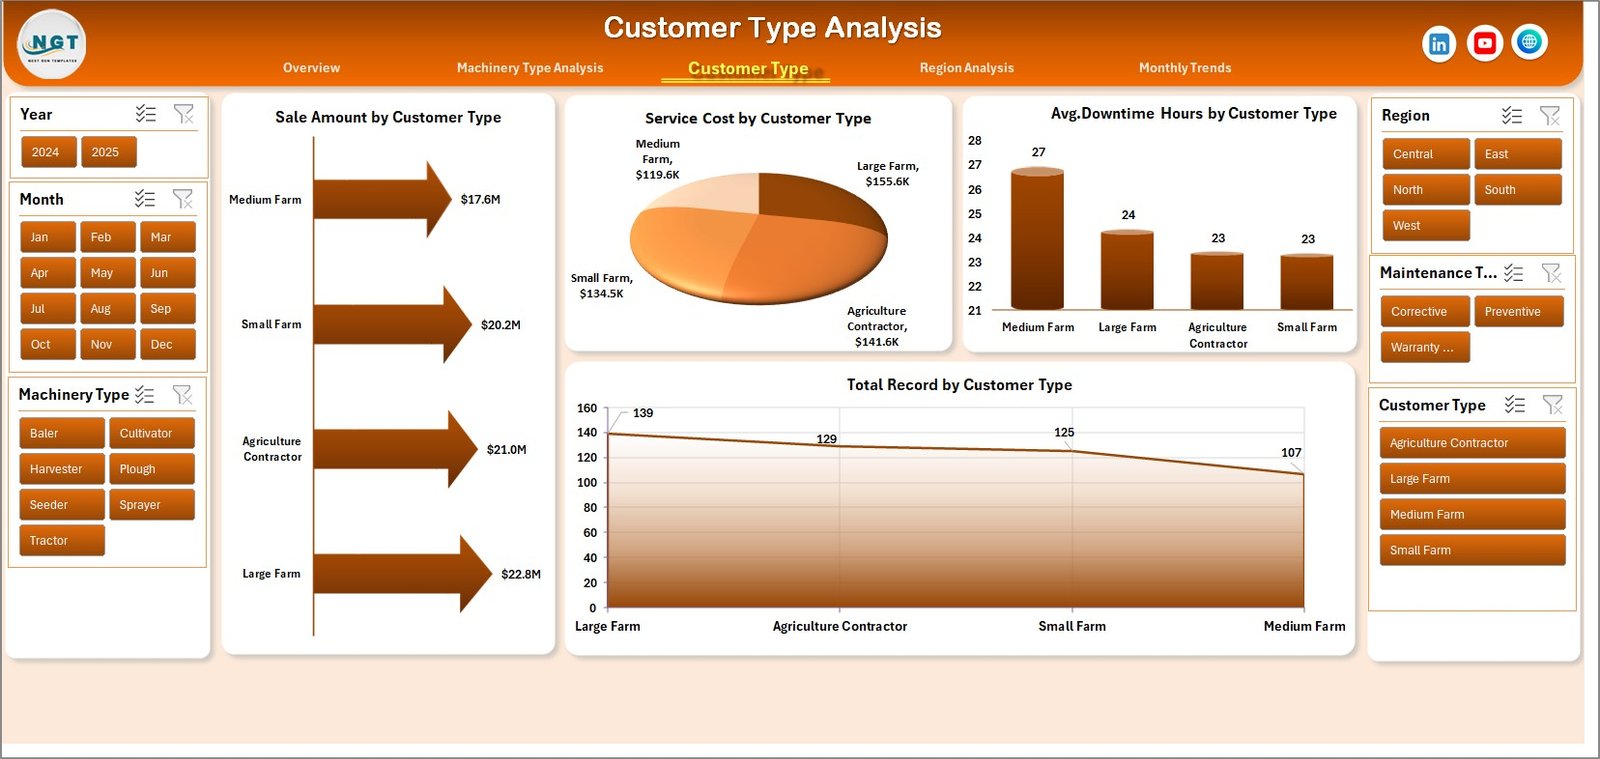
Customer Type Analysis
The Customer Type Analysis Page evaluates purchasing behavior across different customer segments.
Charts included:
Service Cost by Customer Type
Sales Amount by Customer Type
Average Downtime Hours by Customer Type
Total Records by Customer Type
This analysis helps businesses identify profitable customer segments.
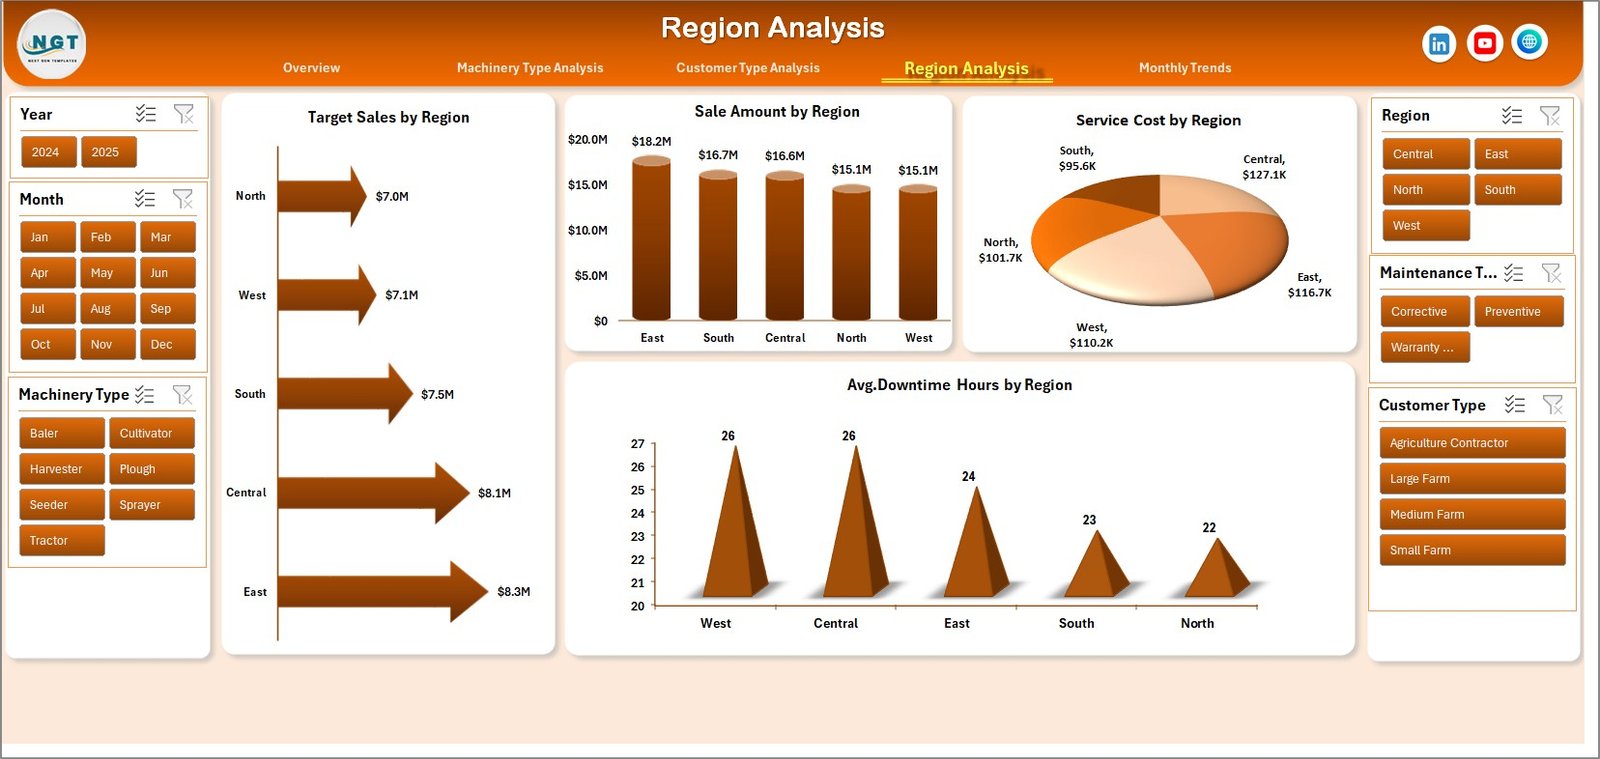
Region Analysis
Agricultural demand varies across geographic regions.
Charts included:
Service Cost by Region
Sales Amount by Region
Average Downtime Hours by Region
Target Sales by Region
This analysis helps companies identify high-performing markets.
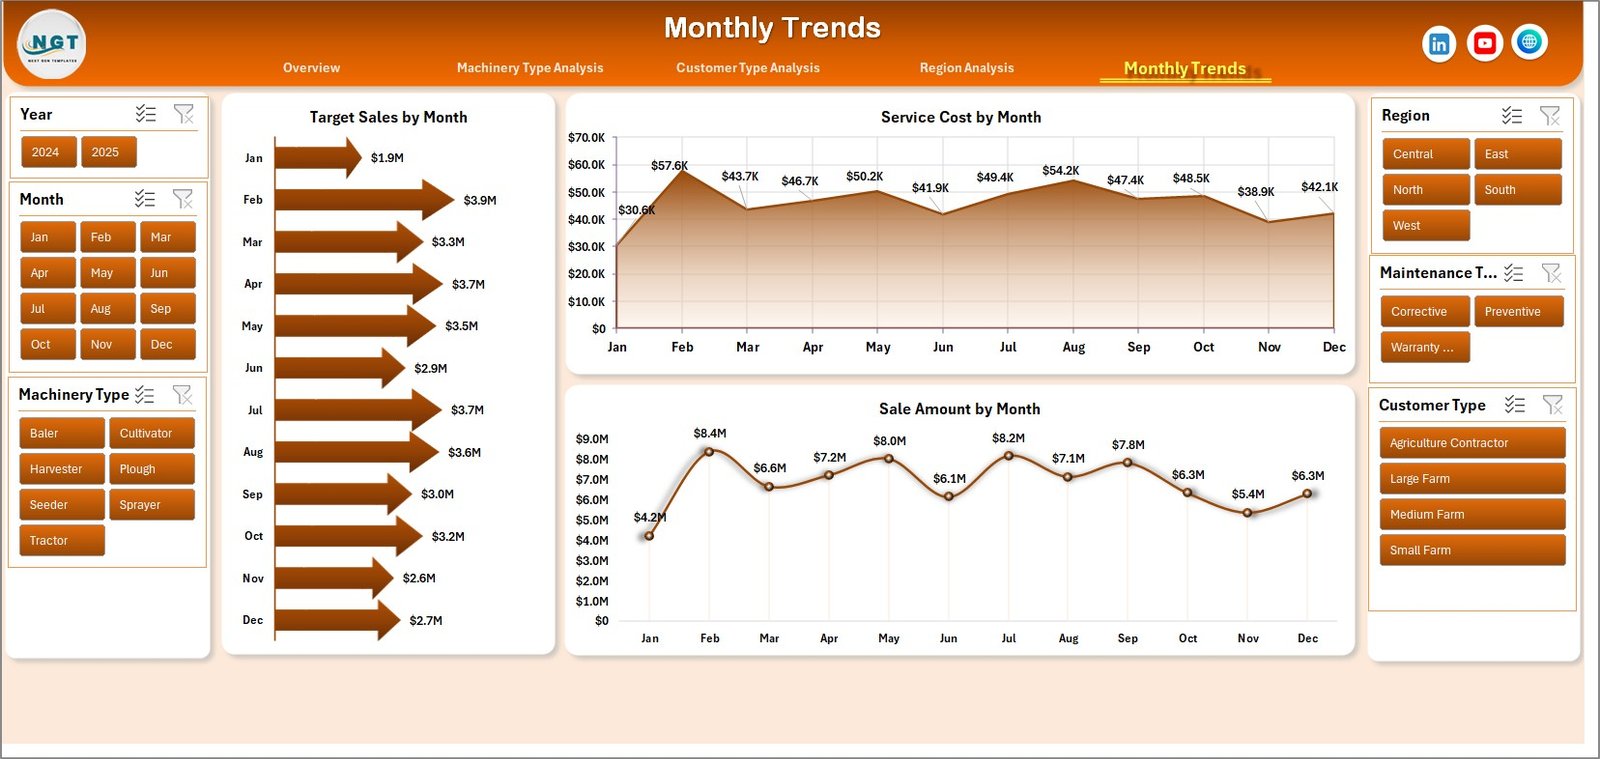
Month Analysis
Agricultural machinery demand is highly seasonal.
Charts included:
Service Cost by Month
Sales Amount by Month
Target Sales by Month
These insights help companies prepare inventory and sales strategies for seasonal demand.
⚙️ How to Use the Agricultural Machinery Dashboard
Using this dashboard is simple and efficient.
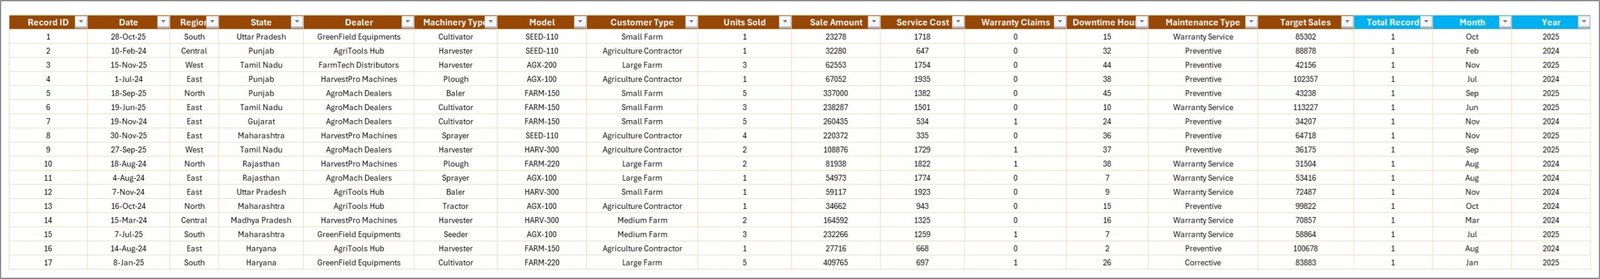
1️⃣ Enter machinery operational data in the Data Sheet.
2️⃣ Update fields such as machinery type, dealer name, region, customer type, sales amount, service cost, and downtime hours.
3️⃣ Refresh pivot tables to update dashboard charts.
4️⃣ Use slicers to filter data by region, machinery type, or customer category.
5️⃣ Analyze charts and KPIs to monitor machinery performance.
Once the dataset is updated, the dashboard automatically refreshes insights.
👥 Who Can Benefit from This Dashboard
This dashboard is designed for professionals working in agricultural equipment and agribusiness industries.
It is particularly useful for:
🚜 Agricultural Machinery Manufacturers
🏪 Equipment Dealers
🛠 Service Managers
📊 Agribusiness Analysts
🌾 Farm Equipment Distributors
📈 Sales Managers
Because the dashboard combines operational metrics, financial insights, and customer analytics, multiple teams can use it effectively.
💡 Why Agricultural Businesses Use Machinery Dashboards
✔ Centralized monitoring of machinery sales and operations
✔ Improved maintenance cost management
✔ Better monitoring of machinery downtime
✔ Enhanced dealer performance tracking
✔ Clear visibility into regional market demand
✔ Customer segmentation insights
✔ Improved seasonal sales planning
✔ Data-driven decision-making
Instead of relying on manual reporting, agricultural businesses can use interactive Excel analytics to monitor equipment performance effectively.
This dashboard converts machinery data into actionable insights that help businesses improve operational efficiency and profitability.
### Click here to read the Detailed blog post
Visit our YouTube channel to learn step-by-step video tutorials
Youtube.com/@PKAnExcelExpert