Managing agricultural equipment manufacturing can quickly become complicated when production data is scattered across multiple reports and spreadsheets. Manufacturers must track production output, control costs, monitor defective units, and analyze profitability across different machines, departments, and regions.
The Agricultural Equipment Production Dashboard in Excel is a powerful, ready-to-use Excel template designed to simplify production monitoring and provide instant insights into manufacturing operations. Instead of manually reviewing dozens of spreadsheets, this dashboard transforms complex production data into interactive charts, KPI indicators, and visual reports.
With the help of Excel features such as Pivot Tables, slicers, formulas, and dynamic charts, this dashboard enables production managers to quickly evaluate performance, identify operational issues, and make data-driven decisions that improve manufacturing efficiency and profitability.
Whether you manage tractors, harvesters, seeders, sprayers, or other agricultural machinery, this dashboard helps you monitor your entire production ecosystem in one place.
🚜 Key Feature of Agricultural Equipment Production Dashboard in Excel
The dashboard provides powerful production insights through interactive visuals and KPIs. It allows manufacturing teams to monitor production efficiency, analyze costs, and track product quality.
Some of the most powerful features include:
📊 Comprehensive Production Overview
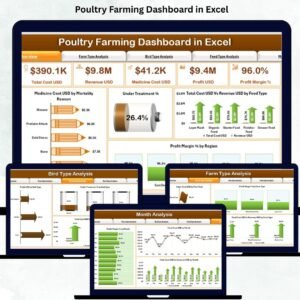
Quickly monitor critical KPIs such as Total Units Produced, Revenue, Production Cost, Defective Units, and Completed Orders.
📈 Production Achievement Monitoring
Track the Production Achievement Rate (%) to understand how effectively teams meet production targets.
🏭 Equipment-Wise Production Insights
Analyze production performance across different machinery types including tractors, harvesters, and other equipment.
💰 Cost Monitoring by Department
Identify which departments generate the highest production expenses and manage costs efficiently.
🌍 Regional Production Analysis
Compare manufacturing performance across multiple production locations or regions.
⚙ Production Line Performance Tracking
Evaluate which production lines produce the highest output and identify bottlenecks.
📉 Quality Control Monitoring
Track defective units and analyze defect rates by department, shift, and equipment category.
📆 Monthly Production Trend Analysis
Monitor seasonal production trends, machine downtime hours, and delayed orders.
Because all these insights are available in one centralized dashboard, managers can quickly detect problems and improve operational efficiency.
📊 What’s Inside the Agricultural Equipment Production Dashboard in Excel
This dashboard is designed with multiple analytical sheets that provide insights into different areas of manufacturing operations.
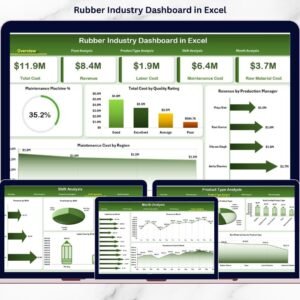
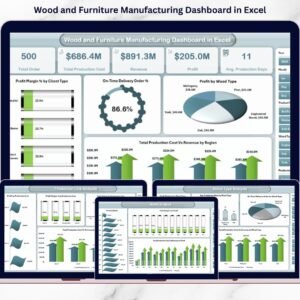
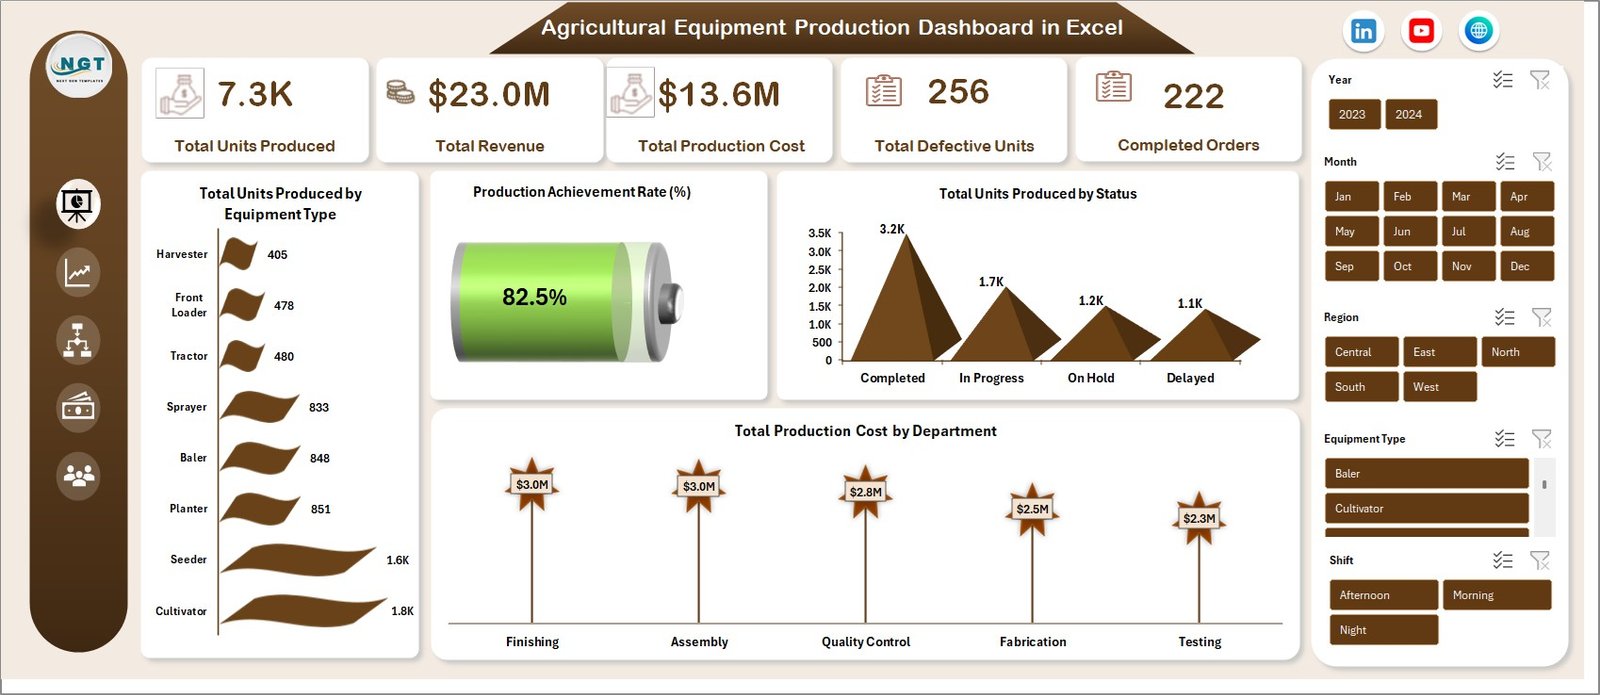
1️⃣ Overview Dashboard
The Overview page provides a quick summary of production performance.
Key KPIs displayed include:
-
Total Units Produced
-
Total Revenue
-
Total Production Cost
-
Total Defective Units
-
Completed Orders
Important charts include:
-
Total Units Produced by Equipment Type
-
Production Achievement Rate (%)
-
Total Units Produced by Status
-
Total Production Cost by Department
This page acts as a central monitoring screen for production managers.
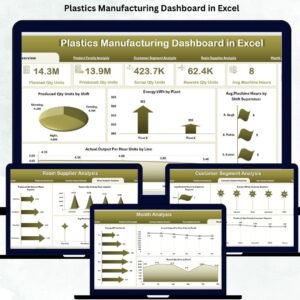
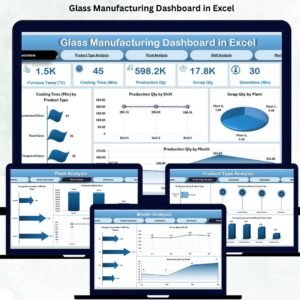
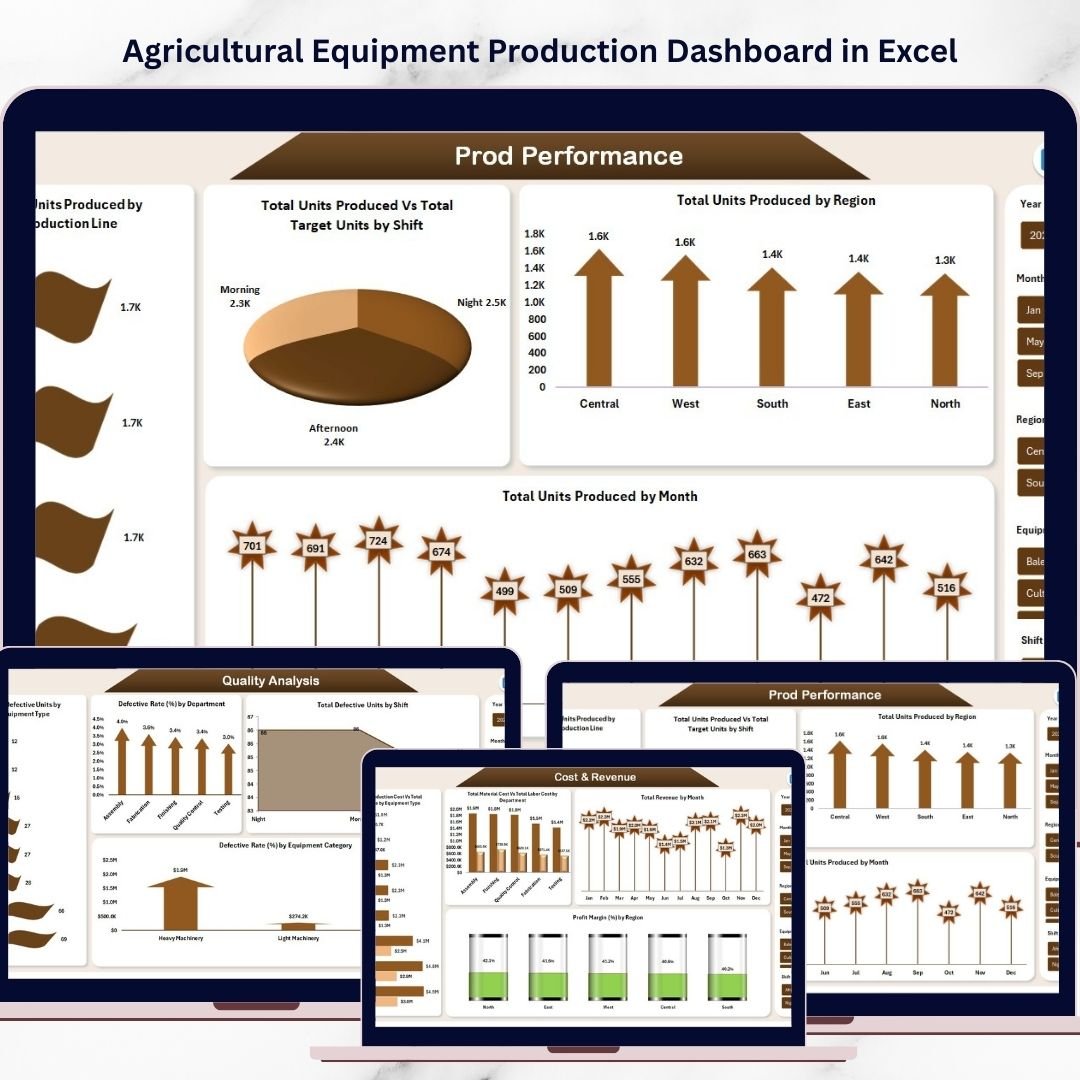
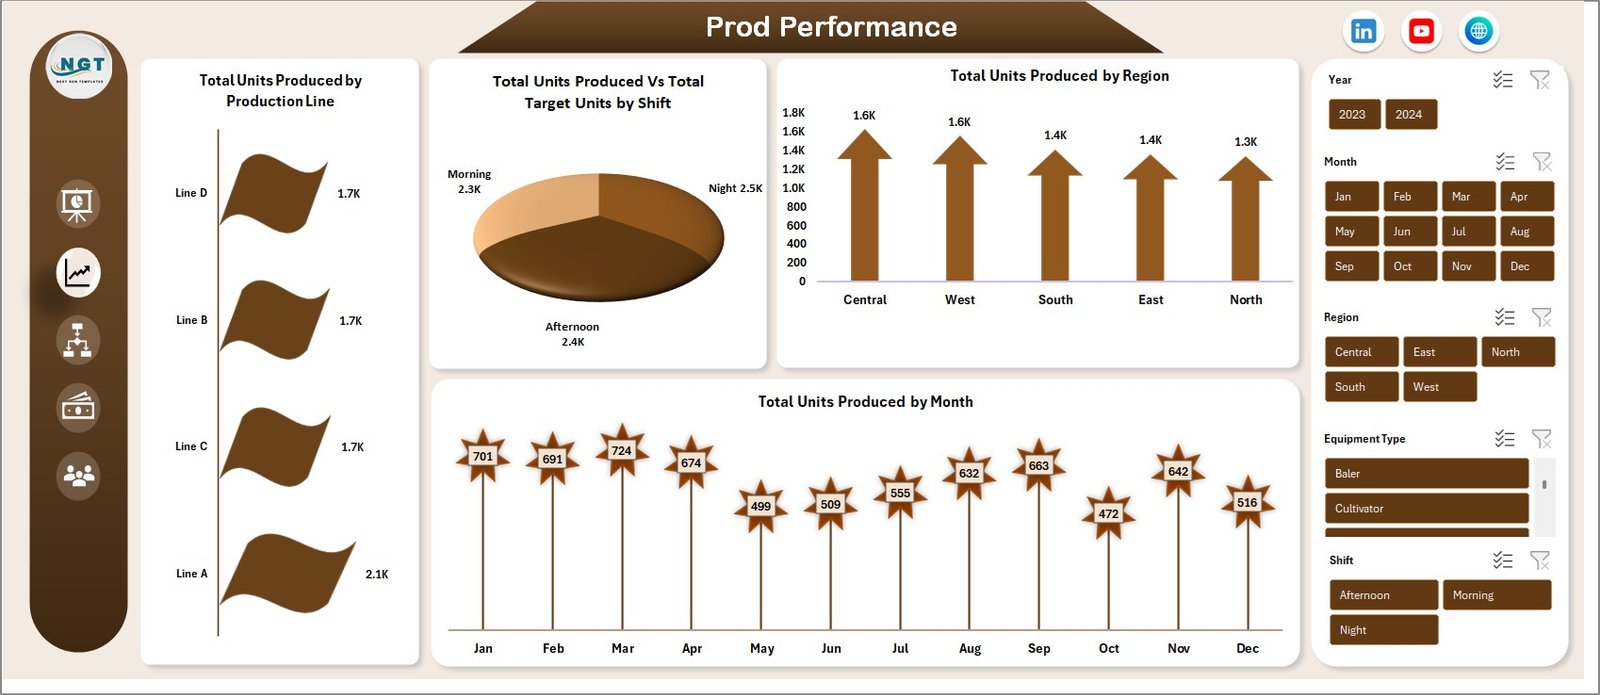
2️⃣ Production Performance Analysis
This sheet focuses on evaluating production efficiency.
Key charts include:
-
Total Units Produced by Production Line
-
Total Units Produced vs Target Units by Shift
-
Total Units Produced by Region
-
Total Units Produced by Month
These insights help production managers optimize shift performance and improve manufacturing output.
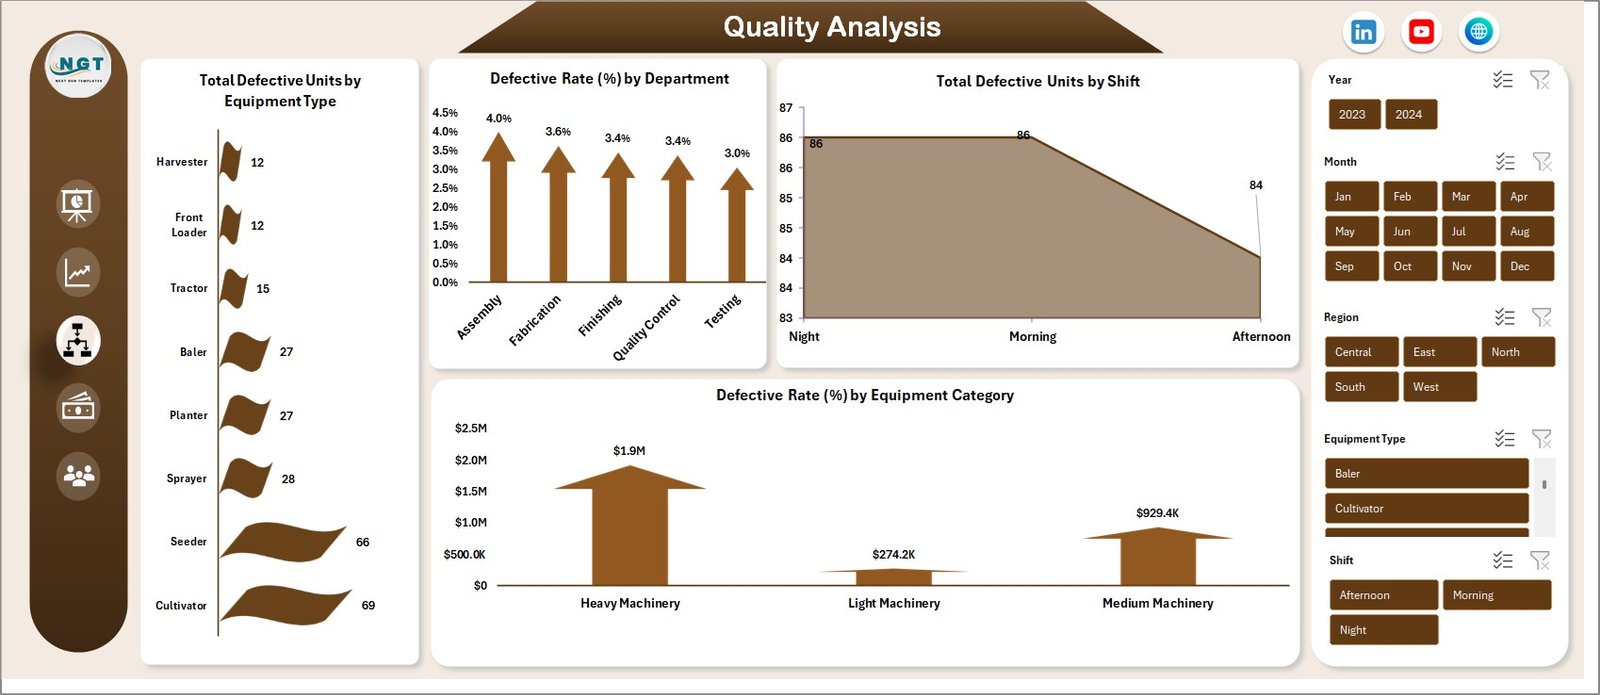
3️⃣ Quality Analysis
Quality monitoring is essential in agricultural equipment manufacturing.
This sheet includes:
-
Total Defective Units by Equipment Type
-
Defective Rate (%) by Department
-
Total Defective Units by Shift
-
Defective Rate (%) by Equipment Category
These visual insights help quality teams quickly identify production defects and implement corrective actions.
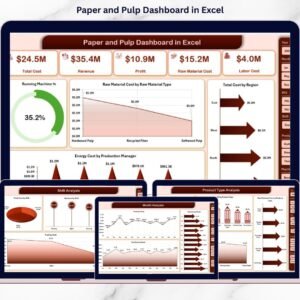
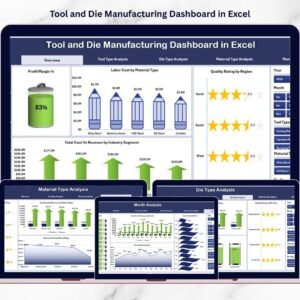
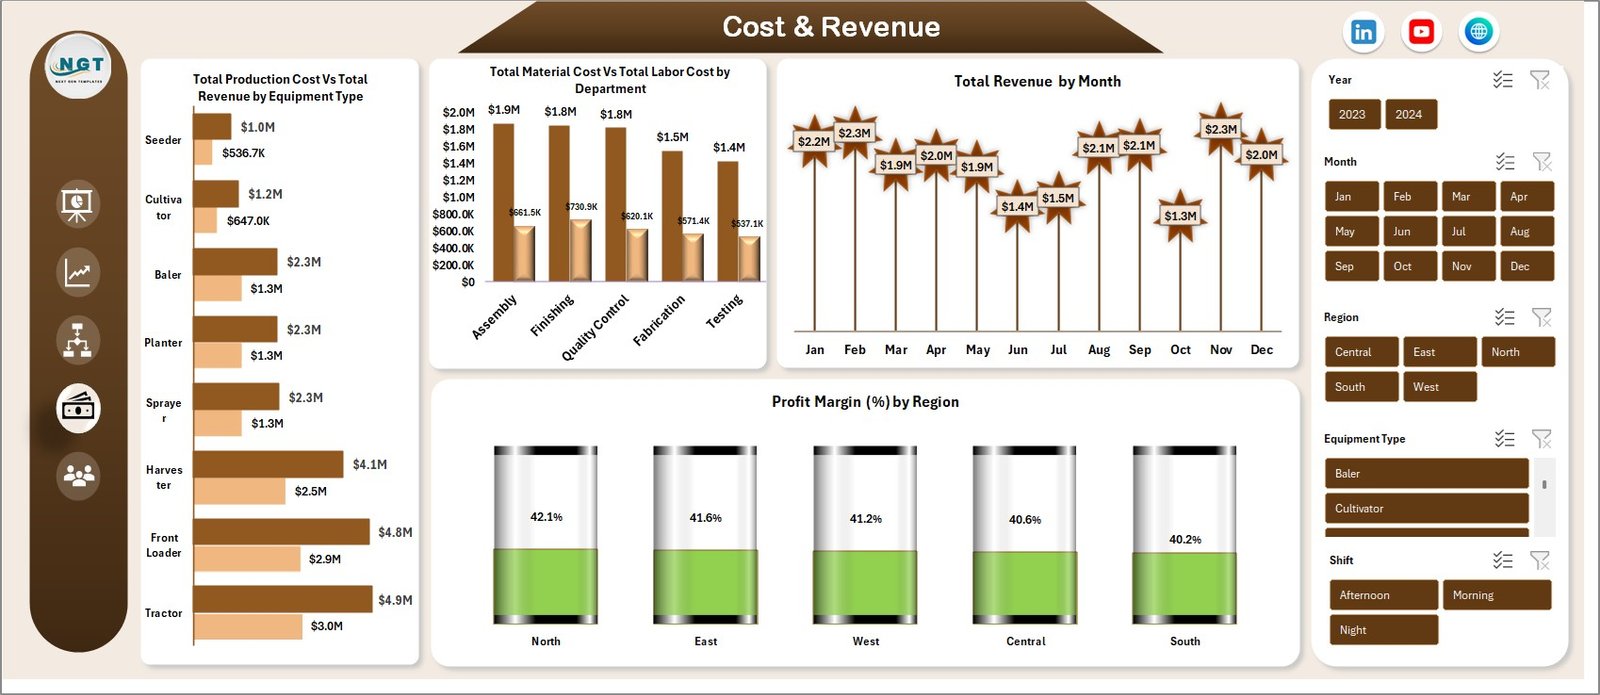
4️⃣ Cost and Revenue Analysis
Understanding profitability is critical for manufacturing organizations.
This sheet analyzes financial performance using charts such as:
-
Total Production Cost vs Total Revenue by Equipment Type
-
Total Material Cost vs Total Labor Cost by Department
-
Total Revenue by Month
-
Profit Margin (%) by Region
These insights help managers identify cost-reduction opportunities and improve profit margins.
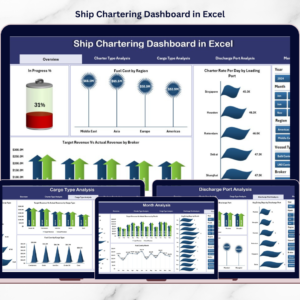
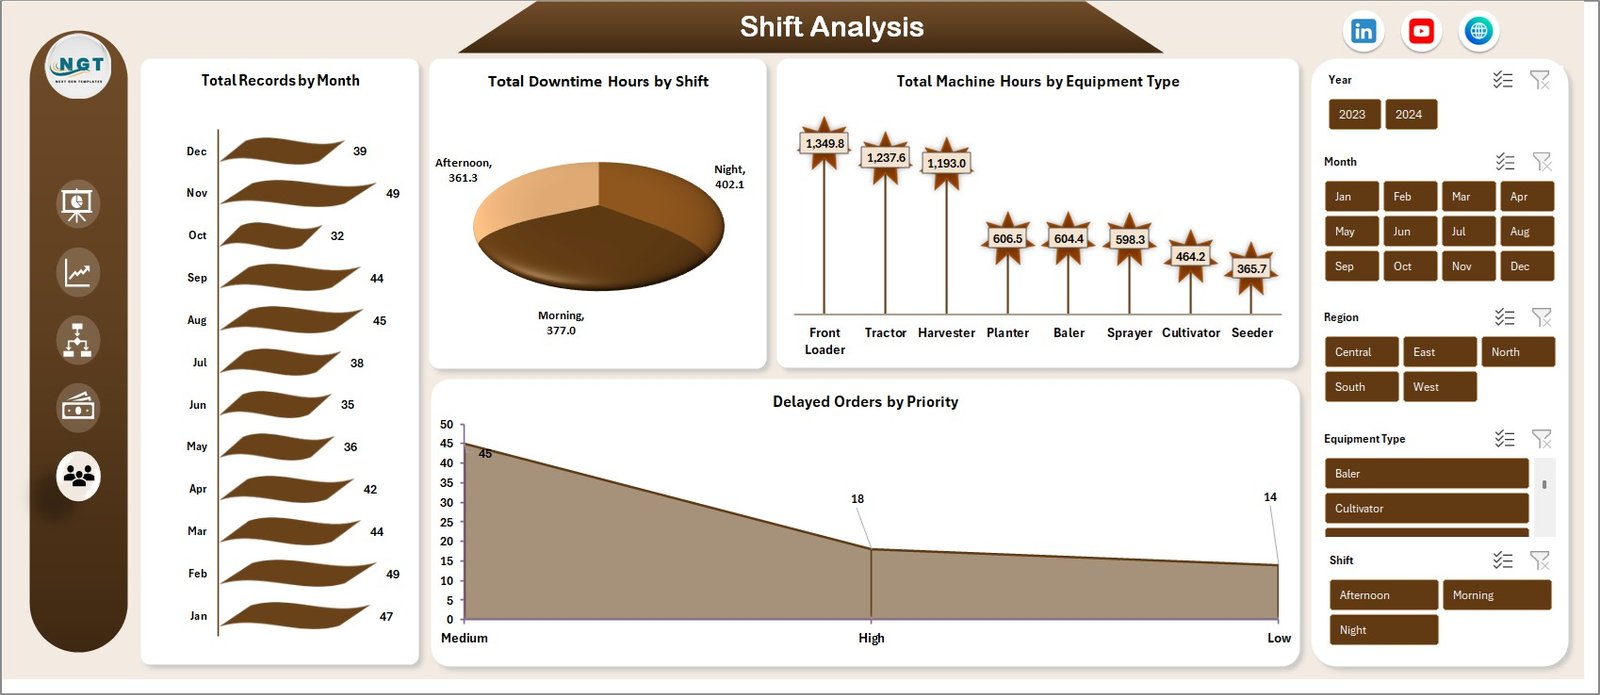
5️⃣ Monthly Production Trends
Manufacturing operations often experience seasonal trends and operational disruptions.
This sheet analyzes:
-
Total Records by Month
-
Total Downtime Hours by Shift
-
Total Machine Hours by Equipment Type
-
Delayed Orders by Priority
These insights allow managers to optimize production planning and reduce operational downtime.
⚙ How to Use the Agricultural Equipment Production Dashboard in Excel
Using this dashboard is extremely simple and does not require advanced Excel knowledge.
Follow these steps:
1️⃣ Enter your production data into the data input sheet.
2️⃣ Update fields such as equipment type, department, shift, region, cost, and production units.
3️⃣ Refresh the Pivot Tables to update all charts automatically.
4️⃣ Use slicers to filter data by equipment type, region, department, or month.
5️⃣ Analyze the dashboard visuals to identify production trends, cost patterns, and quality issues.
Within seconds, managers can convert raw production data into clear, actionable insights.
👨🌾 Who Can Benefit from This Agricultural Equipment Production Dashboard
This dashboard is useful for multiple roles within manufacturing organizations.
👨🏭 Production Managers
Monitor production output, track targets, and improve operational efficiency.
⚙ Operations Teams
Analyze machine performance, shift productivity, and regional output.
🔍 Quality Control Teams
Identify defect patterns and improve manufacturing quality.
💼 Finance Teams
Track production costs, revenue trends, and profitability.
📊 Senior Management
Review overall production performance and make strategic decisions.
Manufacturers producing tractors, harvesters, seeders, irrigation equipment, and other agricultural machinery can significantly benefit from this dashboard.
Click here to read the Detailed blog post
Watch the step-by-step video tutorial: