
Adventure Tourism Dashboard has become one of the fastest-growing segments of the global travel industry. Travelers today seek thrilling experiences such as trekking, rafting, mountain biking, wildlife safaris, scuba diving, and other adventure activities. Because of this rising demand, tourism companies must efficiently manage bookings, customer satisfaction, seasonal demand, safety monitoring, and revenue performance.
However, managing adventure tourism operations can become complex. Tour operators often work with multiple destinations, tour packages, booking channels, and customer feedback systems. When businesses rely only on manual reports or scattered spreadsheets, it becomes difficult to analyze performance trends.
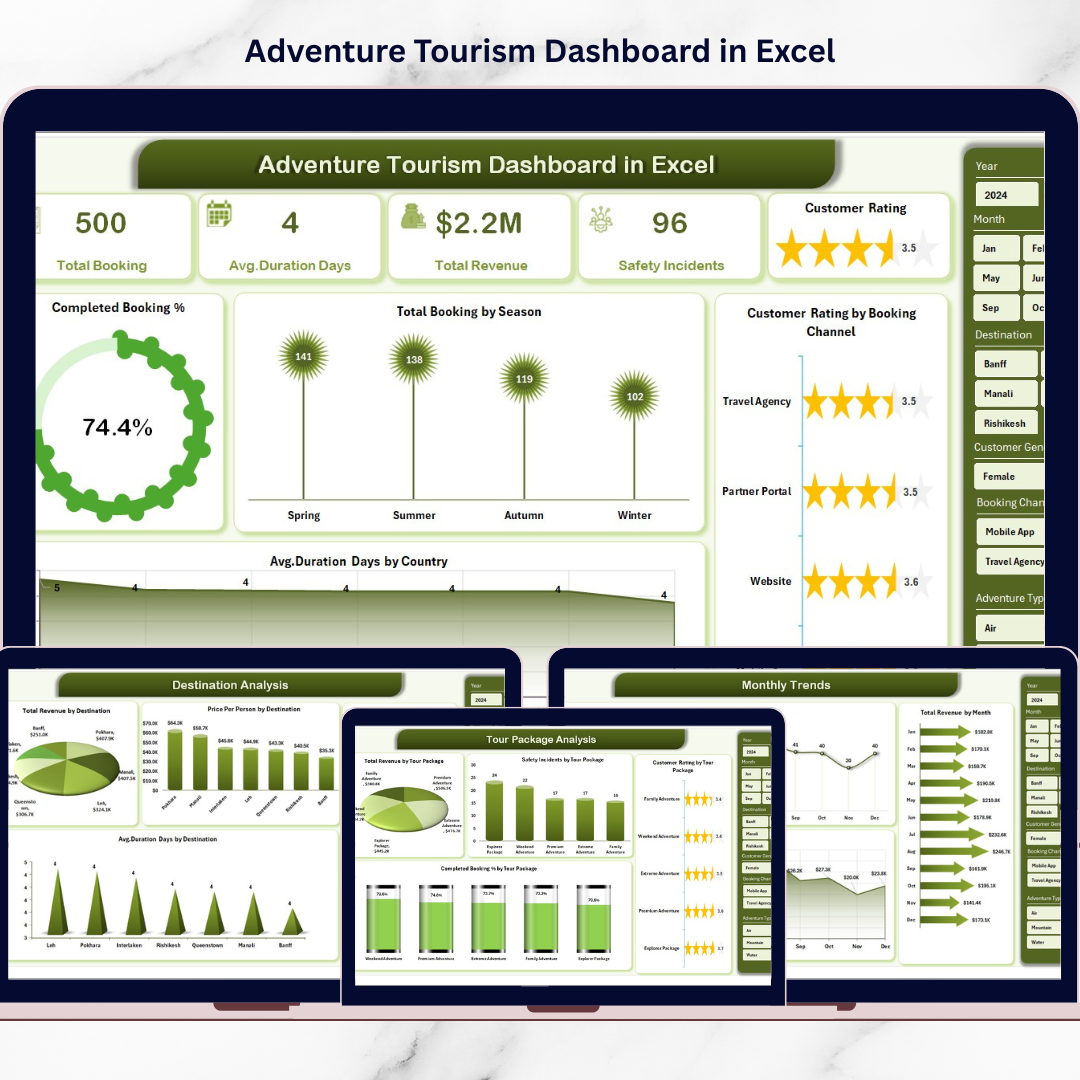
This is where the Adventure Tourism Dashboard in Excel becomes extremely valuable.
This ready-to-use Excel dashboard helps tourism companies track bookings, analyze revenue performance, monitor customer satisfaction, and evaluate safety incidents from one centralized system. Instead of reviewing long spreadsheets, managers can quickly analyze performance using interactive charts, KPI indicators, and filters.
Because Excel provides powerful pivot tables, charts, and data visualization tools, tourism companies can transform raw data into meaningful insights and make informed business decisions.
If you want to improve tourism performance monitoring, optimize tour packages, and enhance customer experiences, this dashboard provides a practical solution.
🌍 Key Feature of Adventure Tourism Dashboard in Excel
This dashboard includes powerful analytical features designed to monitor adventure tourism operations effectively.
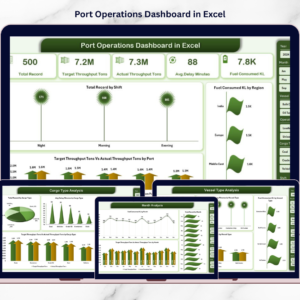
📊 Centralized Tourism Performance Dashboard – Monitor bookings, revenue, ratings, and operational metrics in one place.
📈 Booking Performance Monitoring – Track total bookings and completed booking percentages.
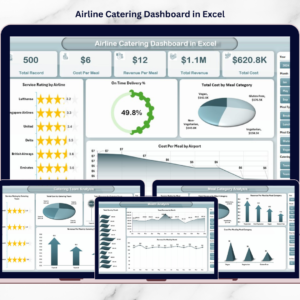
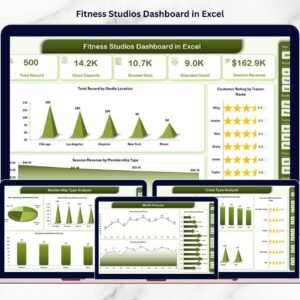
⭐ Customer Satisfaction Tracking – Analyze average customer ratings across booking channels and activities.
🌍 Destination Performance Analysis – Identify destinations generating the highest revenue and customer engagement.
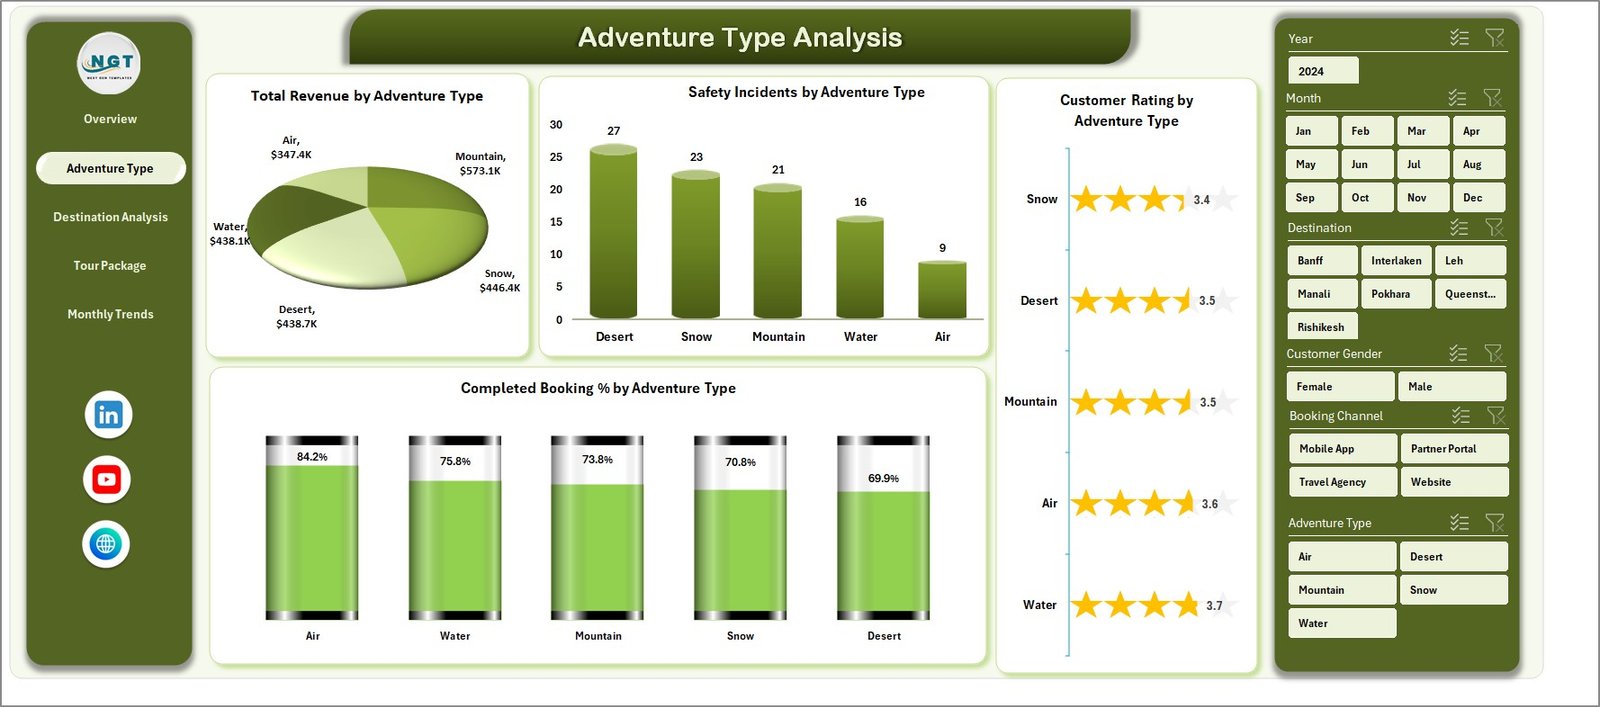
🏔 Adventure Type Performance Analysis – Evaluate revenue, safety incidents, and ratings by activity type.
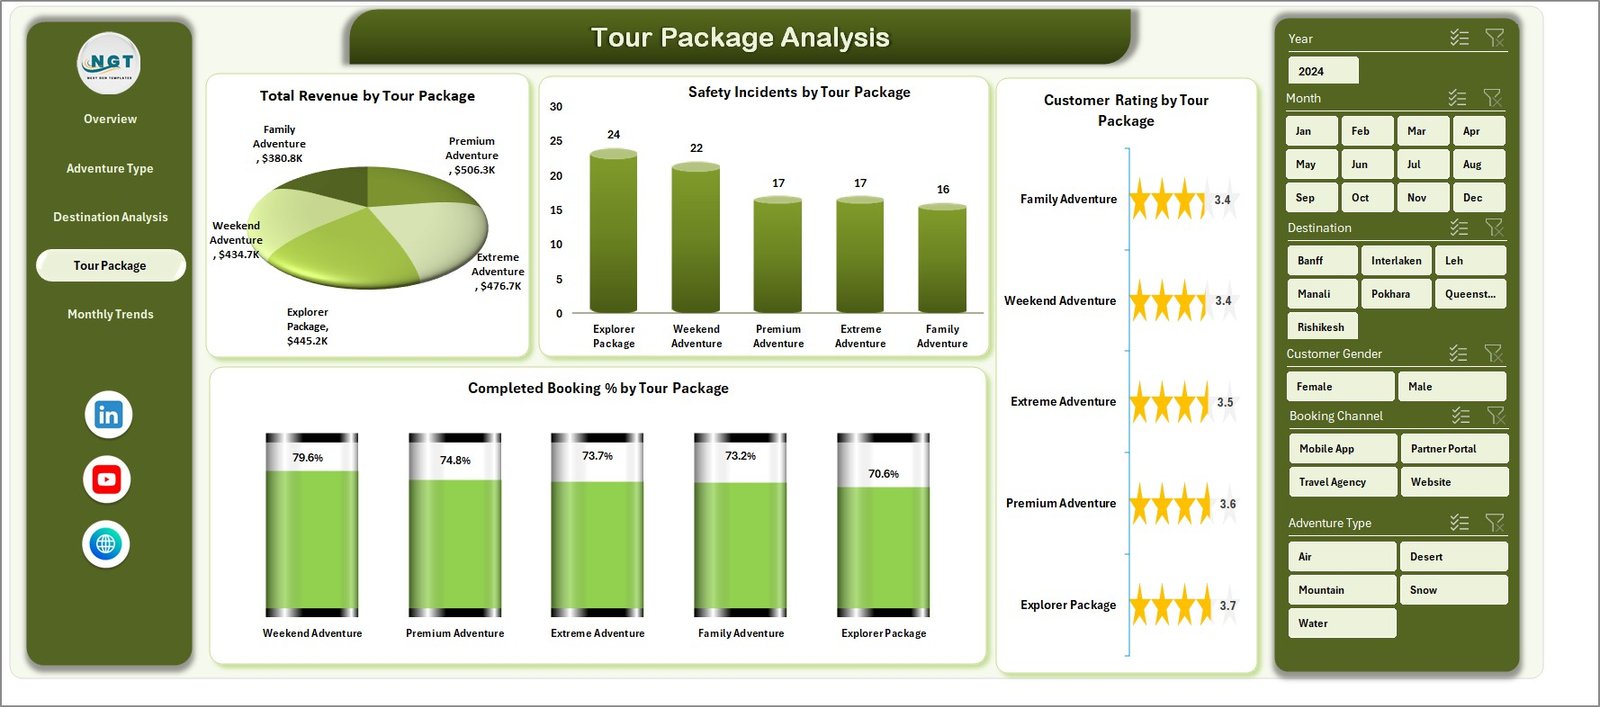
🎒 Tour Package Performance Monitoring – Compare booking completion rates and revenue across tour packages.
⚠ Safety Incident Monitoring – Track safety-related events for adventure activities and packages.
📅 Seasonal Booking Analysis – Understand booking demand patterns across seasons.
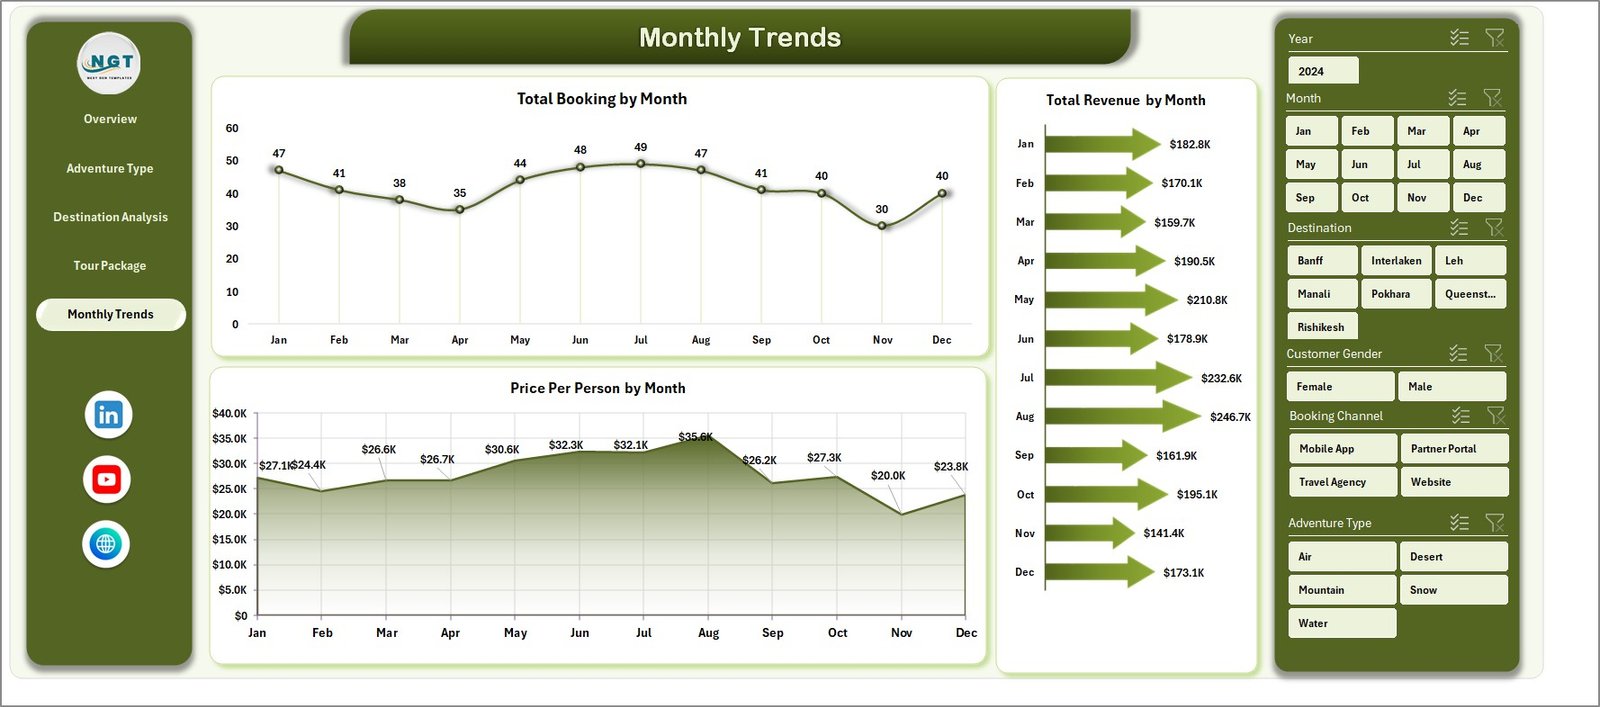
📈 Monthly Revenue & Booking Trends – Analyze performance fluctuations across different months.
🔎 Interactive Filters & Slicers – Explore tourism insights dynamically using pivot filters.
Because of these features, tourism managers gain full visibility into adventure tourism operations.
📦 What’s Inside the Adventure Tourism Dashboard in Excel
This ready-to-use Excel template includes five analytical dashboard pages supported by structured data sheets.
Inside the dashboard you will find:
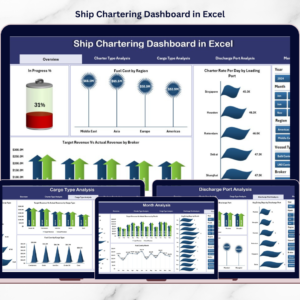
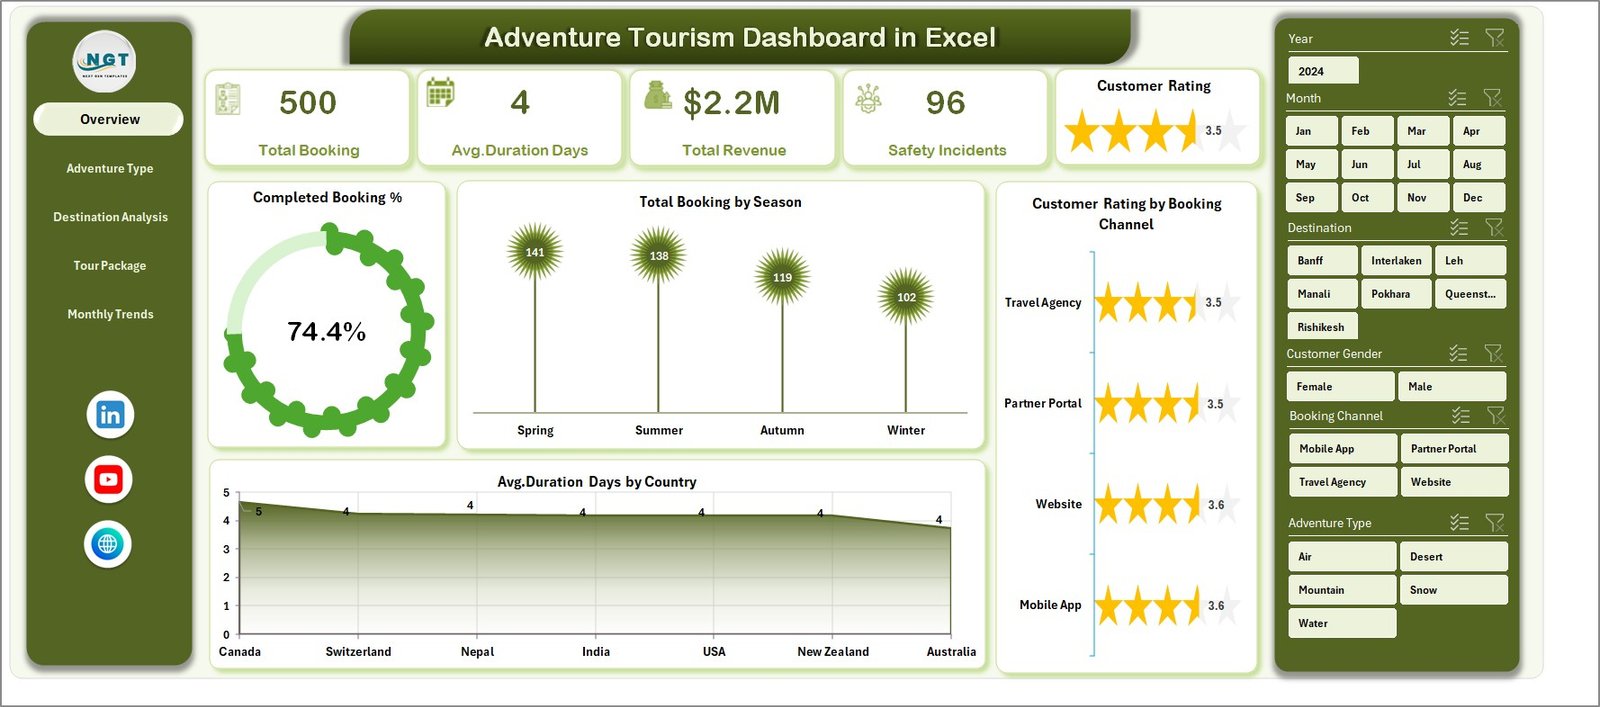
✅ Overview Page – High-level tourism performance monitoring
✅ Adventure Type Analysis Page – Performance analysis by adventure activity
✅ Destination Analysis Page – Destination-level tourism performance insights
✅ Tour Package Analysis Page – Tour package performance evaluation
✅ Month Analysis Page – Monthly tourism performance trends
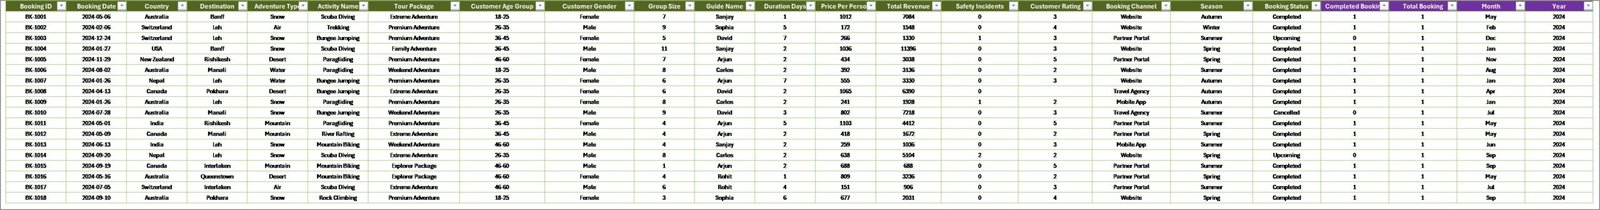
✅ Data Sheet – Main dataset storing tourism records
✅ Support Sheet – Backend pivot tables and calculations
The dashboard analyzes important tourism metrics such as:
Total Bookings
Completed Booking %
Customer Ratings
Total Revenue
Price Per Person
Safety Incidents
Destination Performance
Adventure Activity Performance
Tour Package Performance
Seasonal Demand Trends
Because the dashboard organizes these metrics visually, managers can quickly identify trends and optimize tourism operations.
⚙️ How to Use the Adventure Tourism Dashboard in Excel
Using this dashboard is simple and user-friendly.
1️⃣ Enter tourism data into the Data Sheet.
2️⃣ Include details such as booking records, destinations, adventure types, packages, revenue, and ratings.
3️⃣ Refresh pivot tables to update dashboard visuals.
4️⃣ Use filters and slicers to analyze data by adventure type, destination, package, or month.
5️⃣ Review charts and KPI indicators to evaluate tourism performance.
Once data is updated, the dashboard automatically refreshes charts and insights.
Within seconds, managers can understand booking performance, revenue trends, and customer satisfaction levels.
👥 Who Can Benefit from This Adventure Tourism Dashboard
This dashboard is designed for professionals involved in tourism management and adventure travel operations.
It is particularly useful for:
🌍 Adventure Tour Operators
🏕 Travel Agencies
📊 Tourism Analysts
🏞 Destination Management Companies
🎒 Adventure Activity Providers
📈 Tourism Business Owners
Because the dashboard combines operational, financial, and customer insights, multiple tourism teams can benefit from using it.
💡 Why Tourism Companies Use Adventure Tourism Dashboards
✔ Centralized monitoring of tourism operations
✔ Better booking and revenue tracking
✔ Improved customer satisfaction analysis
✔ Enhanced safety monitoring for adventure activities
✔ Identification of high-performing destinations and packages
✔ Faster decision-making using visual insights
✔ Better seasonal demand planning
✔ Improved marketing and pricing strategies
Instead of relying on manual reporting, tourism businesses can analyze operations using structured visual analytics.
This dashboard converts tourism data into actionable insights that help companies improve customer experiences and increase profitability.
### Click here to read the Detailed blog post
Visit our YouTube channel to learn step-by-step video tutorials
Youtube.com/@PKAnExcelExpert