Modern adhesives and sealants manufacturing requires precision, speed, and data-driven decision-making. With complex production processes, strict quality standards, and cost-sensitive operations, manufacturers can no longer rely on manual reporting or disconnected spreadsheets. Without real-time performance visibility, organizations struggle to identify operational gaps, monitor targets, and respond quickly to performance issues.
The Adhesives and Sealants KPI Dashboard in Power BI is a powerful, ready-to-use business intelligence solution designed to transform manufacturing data into actionable insights. Built using interactive Power BI visuals and automated calculations, this dashboard allows organizations to monitor key performance indicators (KPIs) in one centralized reporting environment.
Instead of spending hours compiling reports, decision-makers gain instant access to performance trends, KPI comparisons, and operational insights through dynamic dashboards. As data updates, visuals refresh automatically, ensuring accurate and real-time performance monitoring.
Whether you are managing production efficiency, quality performance, supply chain operations, or financial metrics, this dashboard helps organizations move toward smarter and faster decision-making.
🚀 Key Features of Adhesives and Sealants KPI Dashboard in Power BI
✅ Interactive KPI monitoring with dynamic slicers
✅ Centralized performance overview with visual KPI cards
✅ MTD and YTD performance tracking
✅ Target vs Actual and Previous Year comparisons
✅ Automated visual indicators for KPI status
✅ Dynamic KPI trend analysis charts
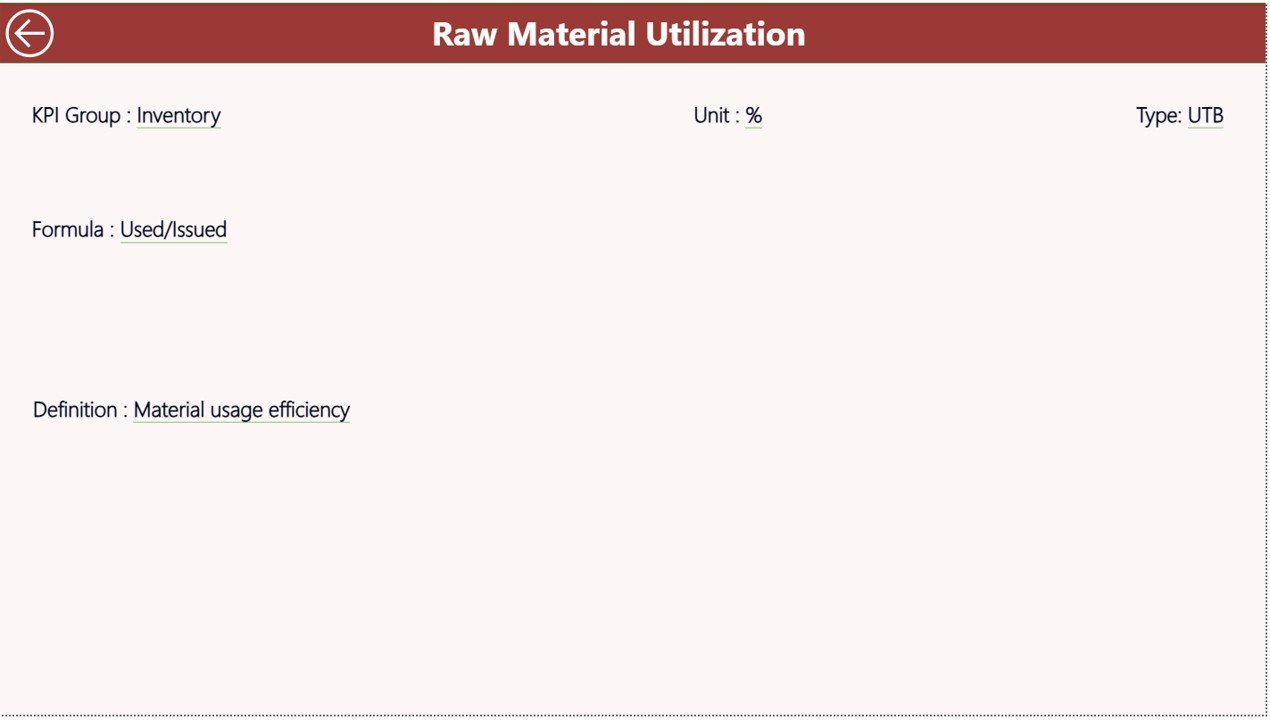
✅ Drill-through KPI definition analysis
✅ Excel-based data source integration
✅ Professional manufacturing analytics layout
✅ Real-time dashboard refresh capability
These intelligent features simplify complex manufacturing analytics and allow teams to identify performance issues instantly.
📦 What’s Inside the Adhesives and Sealants KPI Dashboard in Power BI
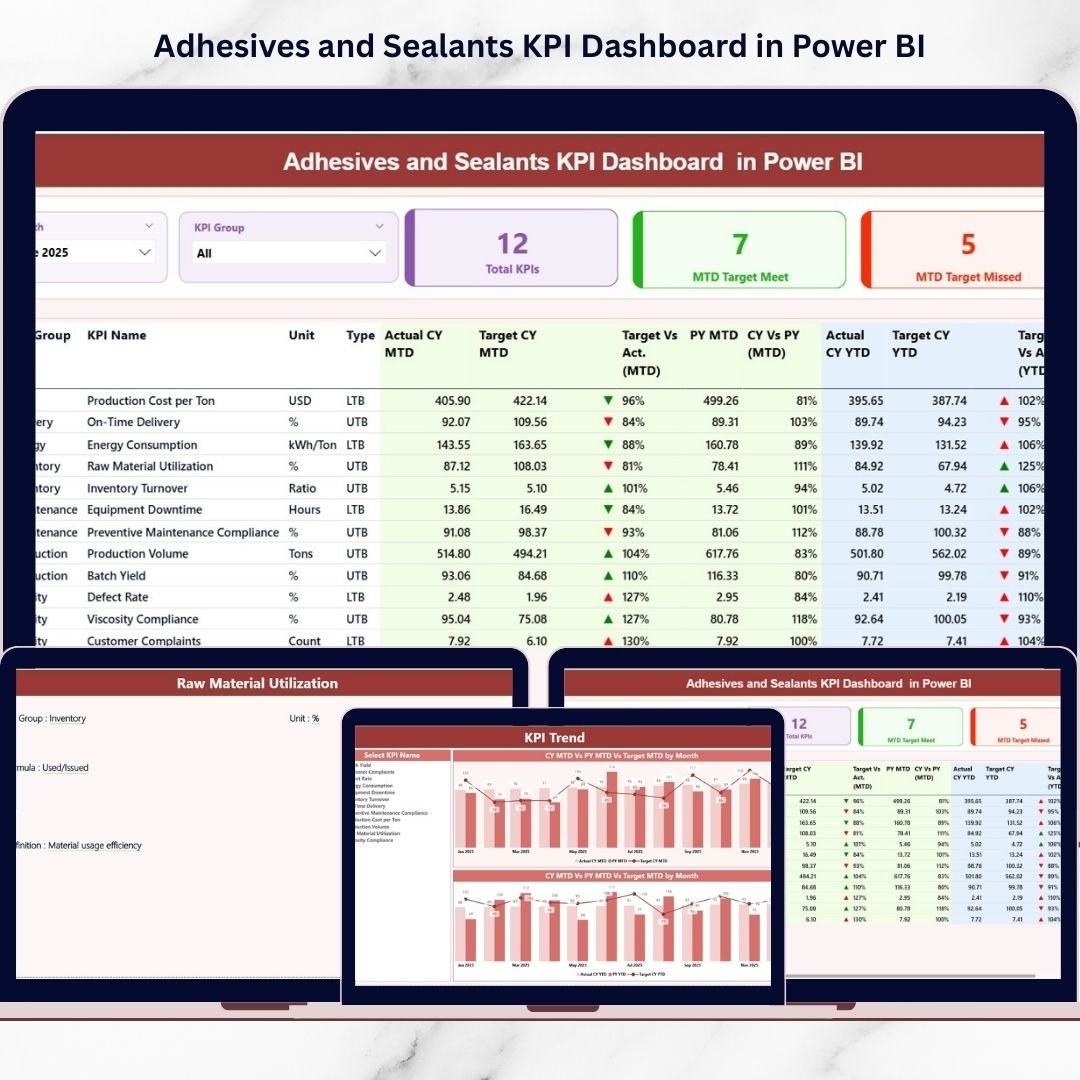
This dashboard includes three professionally structured report pages designed for complete performance analysis:
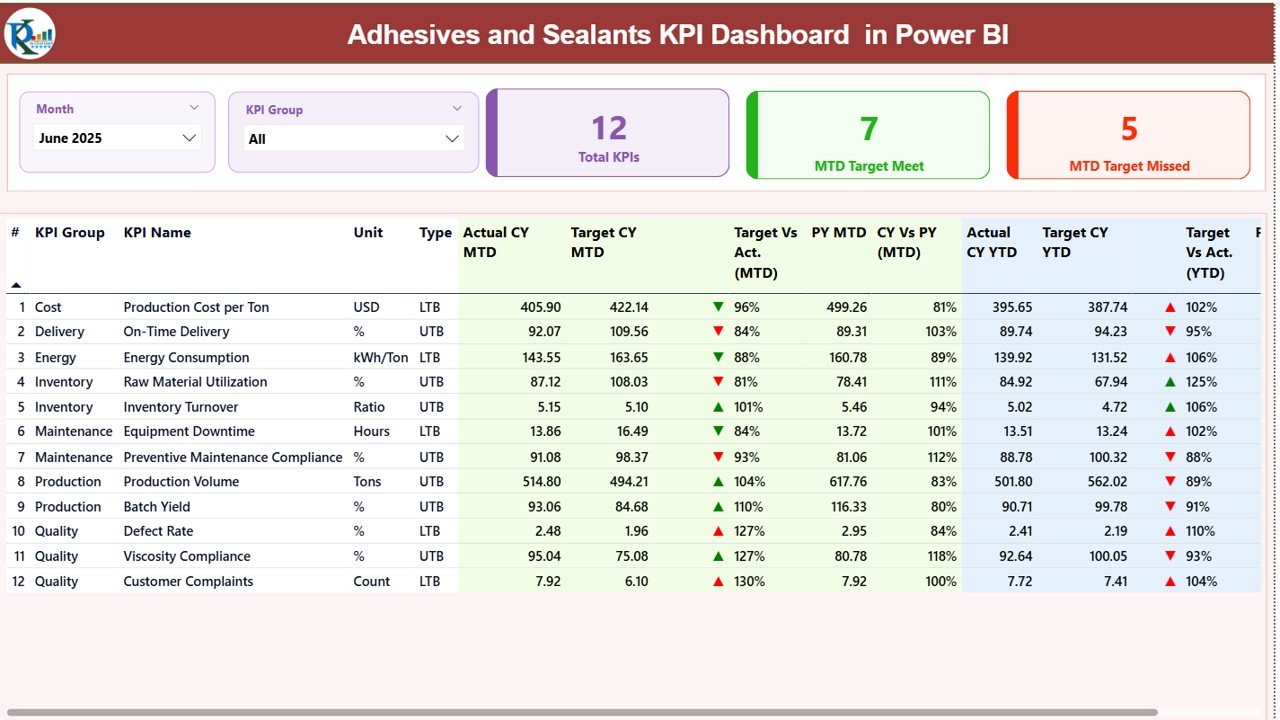
📊 Summary Page – The main control center displaying KPI cards, filters, and detailed KPI performance tables with visual indicators.
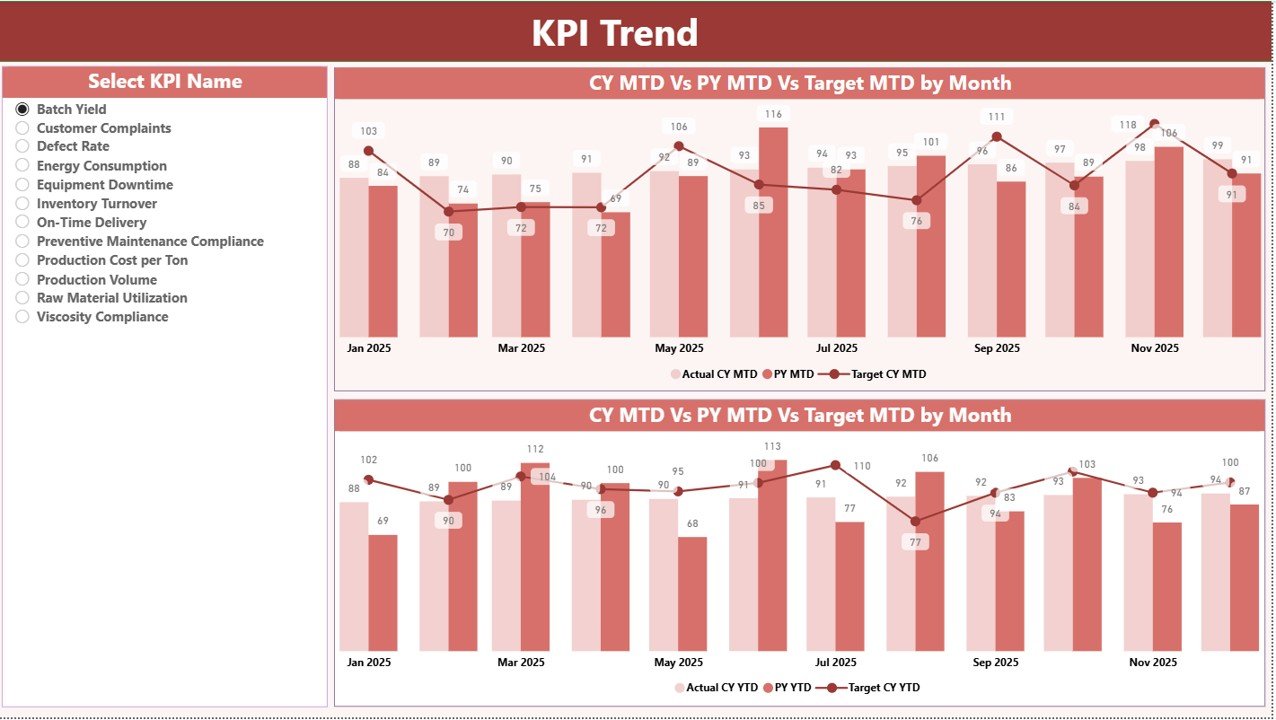
📈 KPI Trend Page – Interactive trend visualization showing Actual vs Target vs Previous Year comparisons for both MTD and YTD performance.
📘 KPI Definition Page – Drill-through analysis page providing KPI formulas, definitions, and classification details for better understanding.
Additionally, the dashboard connects seamlessly with an Excel data source containing:
🧾 Input Actual Sheet – Enter operational KPI values.
🎯 Input Target Sheet – Define monthly performance targets.
📚 KPI Definition Sheet – Maintain KPI documentation and logic.
Together, these components create a scalable and structured performance monitoring system.
⚙️ How to Use the Adhesives and Sealants KPI Dashboard in Power BI
Using this dashboard is straightforward and business-user friendly:
1️⃣ Maintain KPI data in the Excel input sheets.
2️⃣ Update Actual and Target performance values regularly.
3️⃣ Refresh Power BI to load updated data automatically.
4️⃣ Use slicers to filter KPIs by month or category.
5️⃣ Analyze performance through visuals, charts, and indicators.
Because automation handles calculations and visualization, users focus more on insights rather than report preparation.
👥 Who Can Benefit from This Adhesives and Sealants KPI Dashboard in Power BI
This dashboard is ideal for professionals across manufacturing organizations:
🏭 Adhesives and sealants manufacturers
📊 Production and plant managers
🔬 Quality assurance teams
📦 Supply chain professionals
💼 Operations executives and decision-makers
📈 Business analysts and consultants
🏢 Small to enterprise-level manufacturing companies
Any organization seeking structured KPI monitoring and performance visibility can benefit from this solution.
By centralizing KPIs into one intelligent platform, organizations gain improved transparency, faster reporting cycles, and stronger operational control. Visual indicators highlight performance gaps instantly, enabling proactive decision-making instead of reactive problem-solving.
Power BI’s interactive capabilities combined with Excel data flexibility make this dashboard both powerful and easy to maintain. As manufacturing analytics continues evolving, this dashboard provides a future-ready foundation for performance management.
Implementing the Adhesives and Sealants KPI Dashboard in Power BI helps organizations improve efficiency, strengthen accountability, and drive continuous operational improvement through data-driven insights.
Click here to read the Detailed blog post
Visit our YouTube channel to learn step-by-step video tutorials
👉 Youtube.com/@PKAnExcelExpert