The 3D Printing Manufacturing Dashboard in Excel is a powerful, ready-to-use analytics tool designed to help manufacturers monitor production performance, track operational costs, and improve profitability. As 3D printing technology continues to transform modern manufacturing, businesses must carefully analyze production data such as material usage, labor hours, machine costs, and revenue.
However, many manufacturing teams still rely on scattered spreadsheets or manual reports, which makes it difficult to identify performance issues and optimize production efficiency.
This is where the 3D Printing Manufacturing Dashboard in Excel becomes extremely valuable.
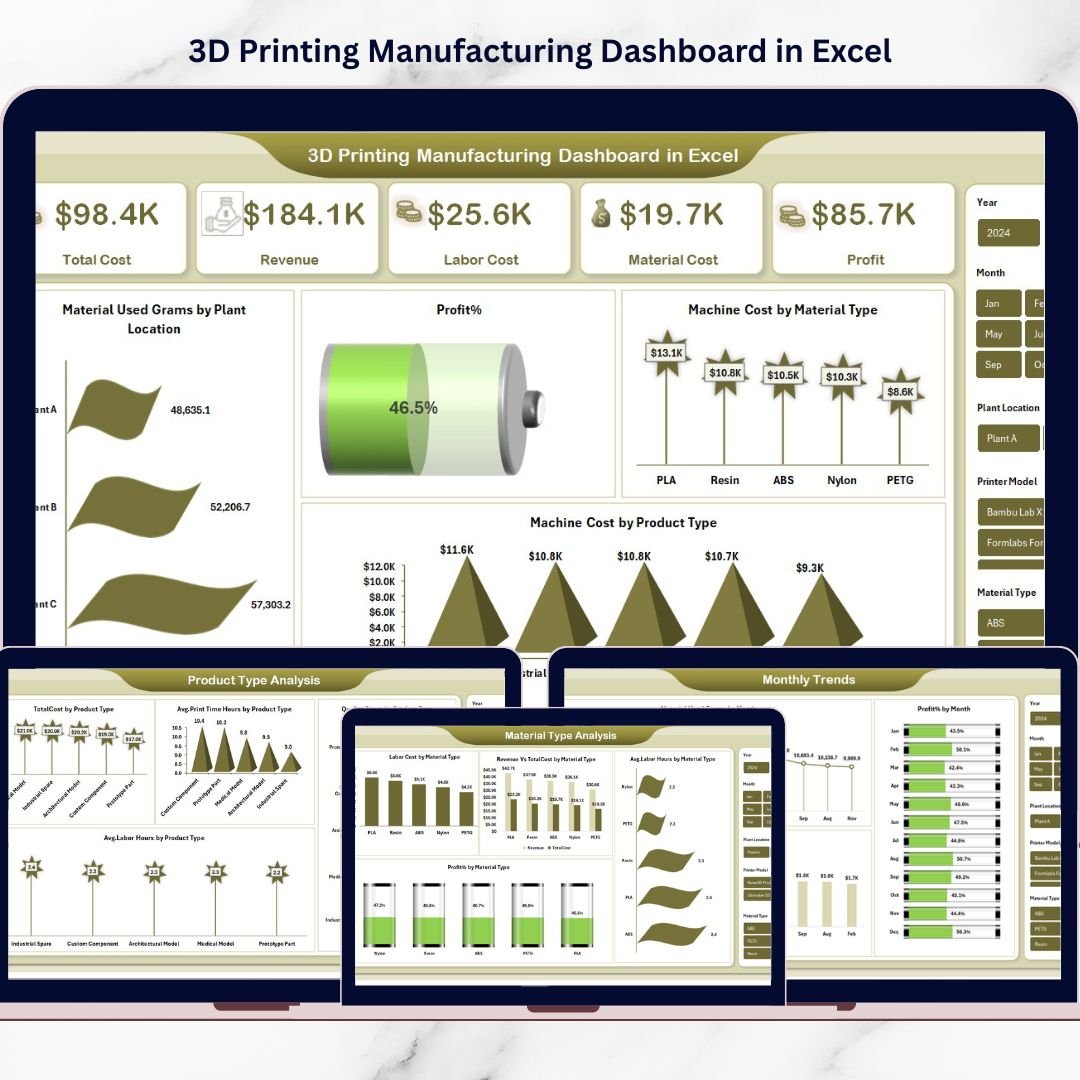
This dashboard converts complex manufacturing data into clear visual insights using Excel charts, pivot tables, slicers, and interactive analytics. Instead of reviewing multiple reports, managers can monitor all key production KPIs from a single dashboard interface.
The dashboard also provides multi-dimensional analysis across plant locations, material types, product categories, and monthly performance trends, helping organizations make smarter operational decisions.
🚀 Key Feature of 3D Printing Manufacturing Dashboard in Excel
The dashboard includes multiple analytical pages that provide deep insights into production performance.
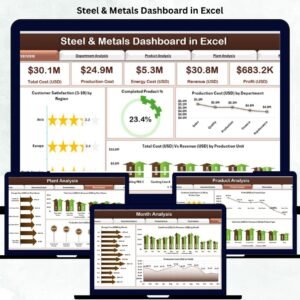
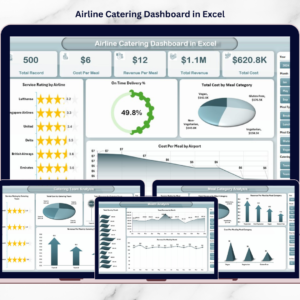
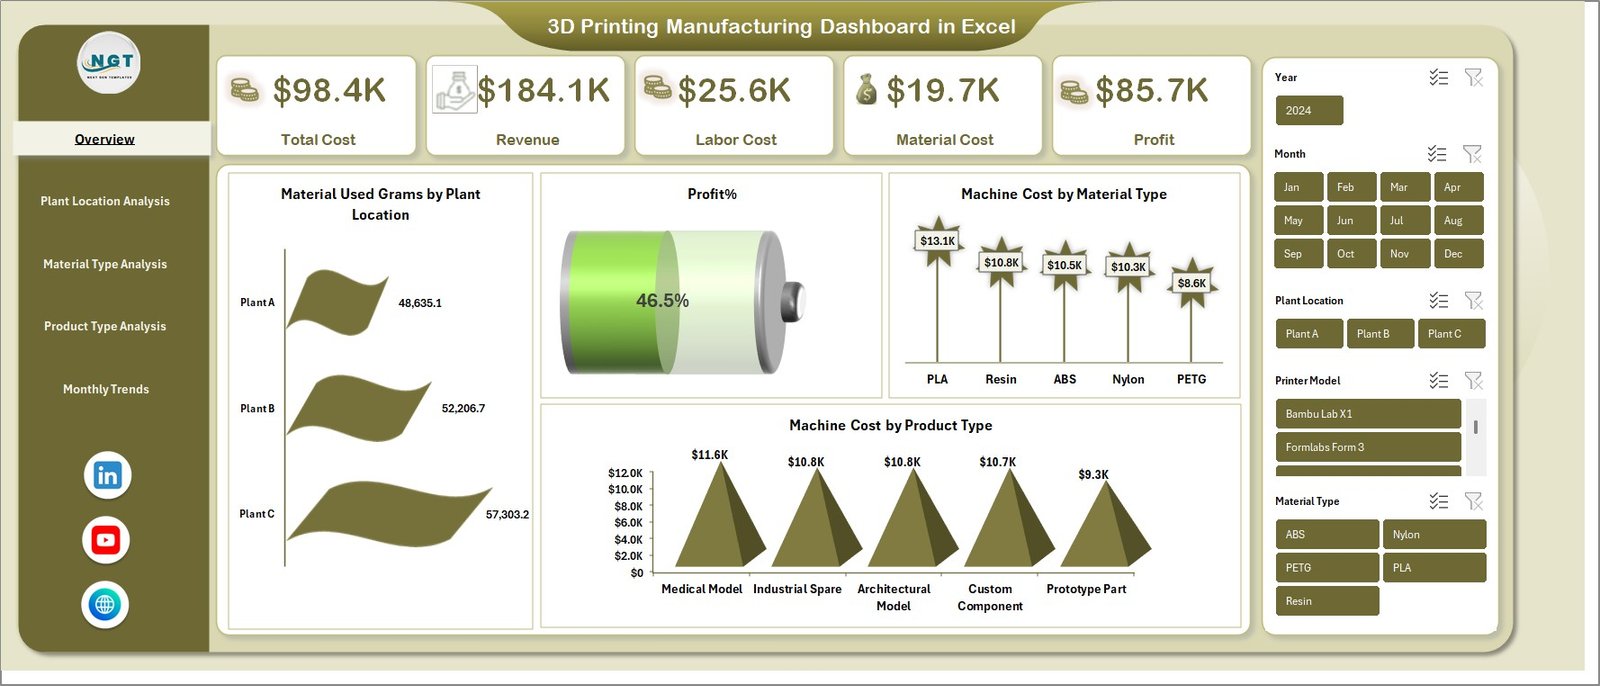
📊 Overview Dashboard for Complete Manufacturing Insights
The Overview page acts as the main control center of the dashboard. It displays important KPIs such as Total Cost, Revenue, Labor Cost, Material Cost, and Profit Percentage, giving managers an instant snapshot of manufacturing performance.
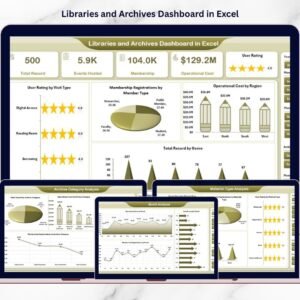
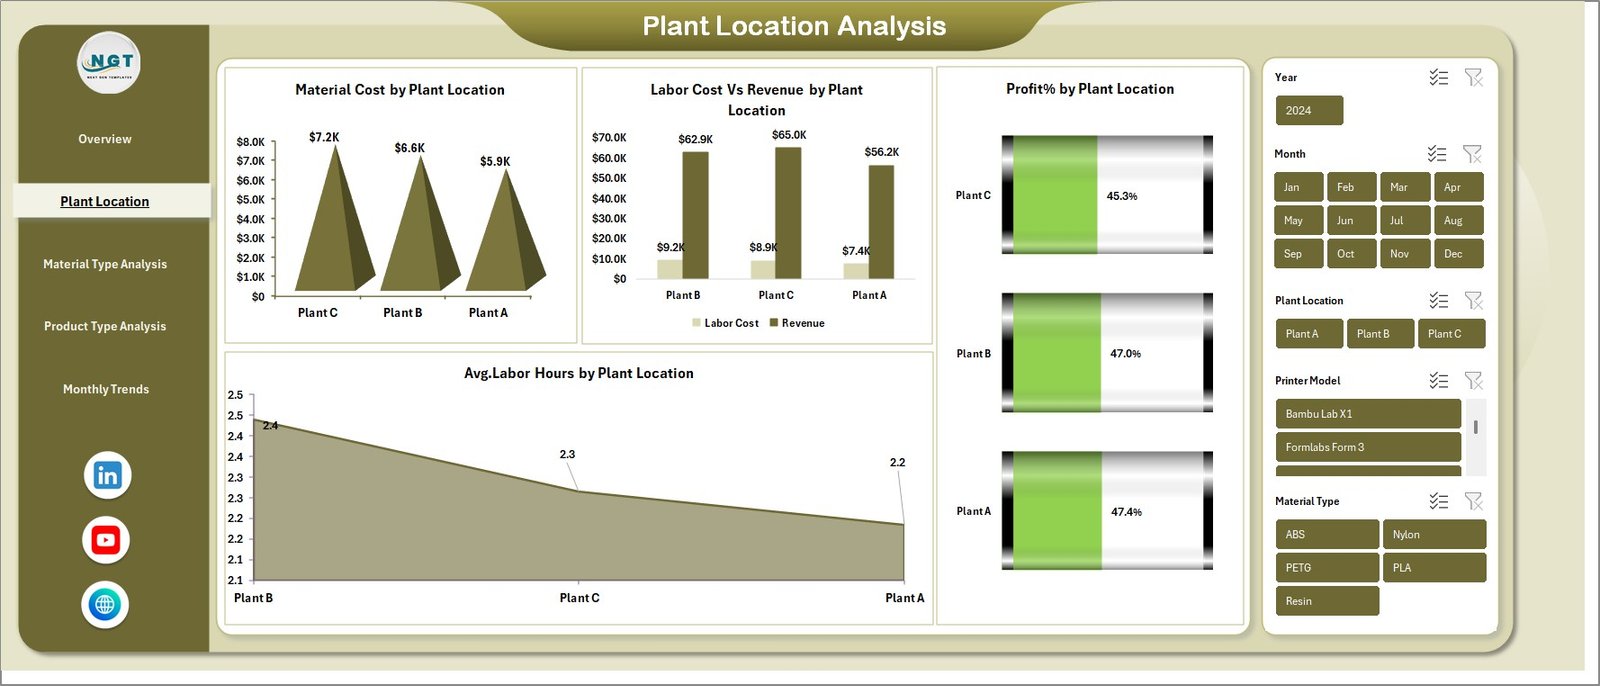
🏭 Plant Location Performance Analysis
Manufacturers operating multiple facilities can easily compare production efficiency across plants. Charts like Material Cost by Plant Location, Labor Cost vs Revenue, Profit % by Plant Location, and Average Labor Hours help identify top-performing facilities.
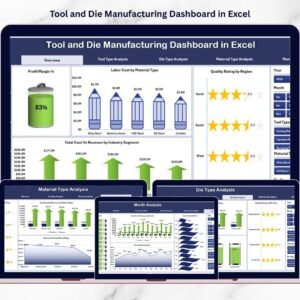
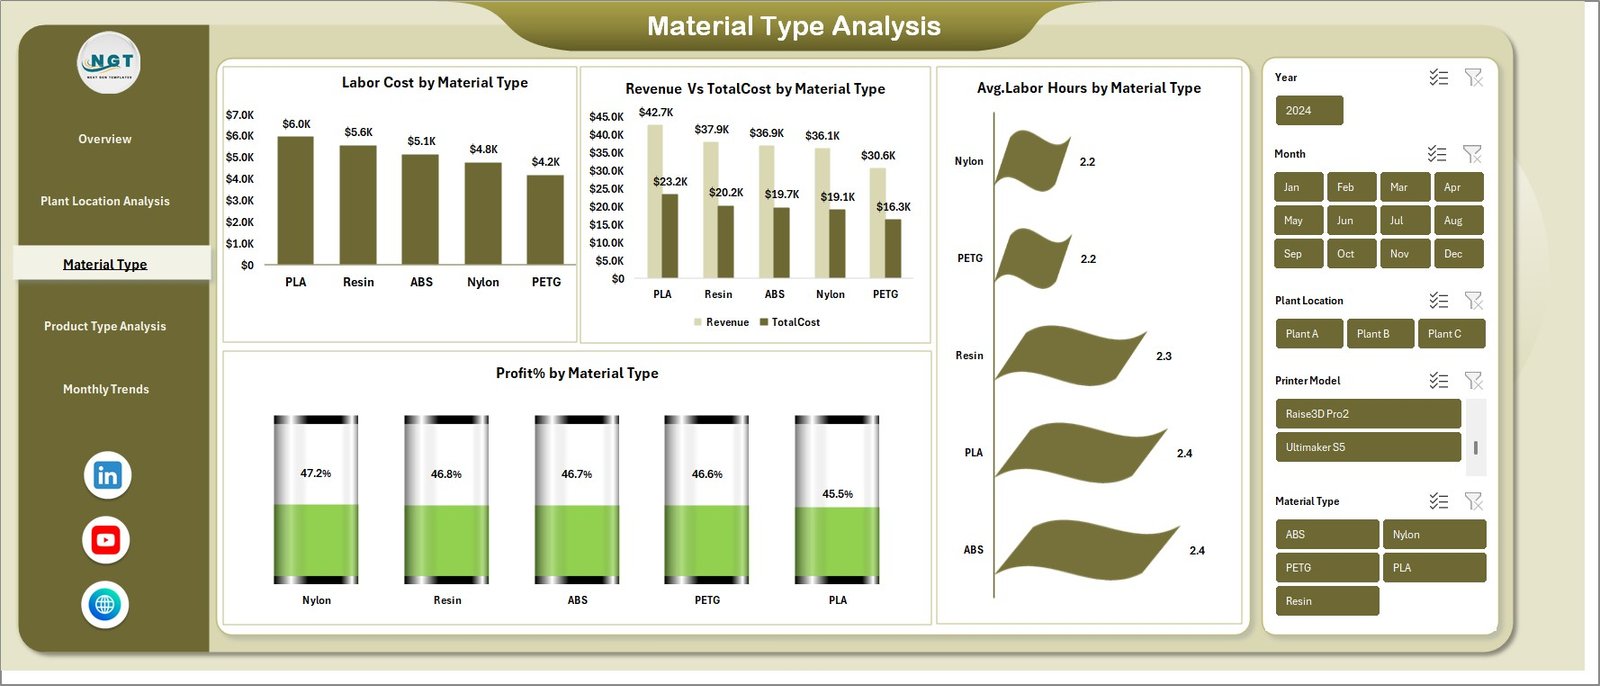
🧪 Material Type Profitability Analysis
Different materials impact cost, machine time, and labor requirements. This page analyzes Labor Cost by Material Type, Revenue vs Total Cost, Average Labor Hours, and Profit Percentage, helping organizations choose the most profitable materials.
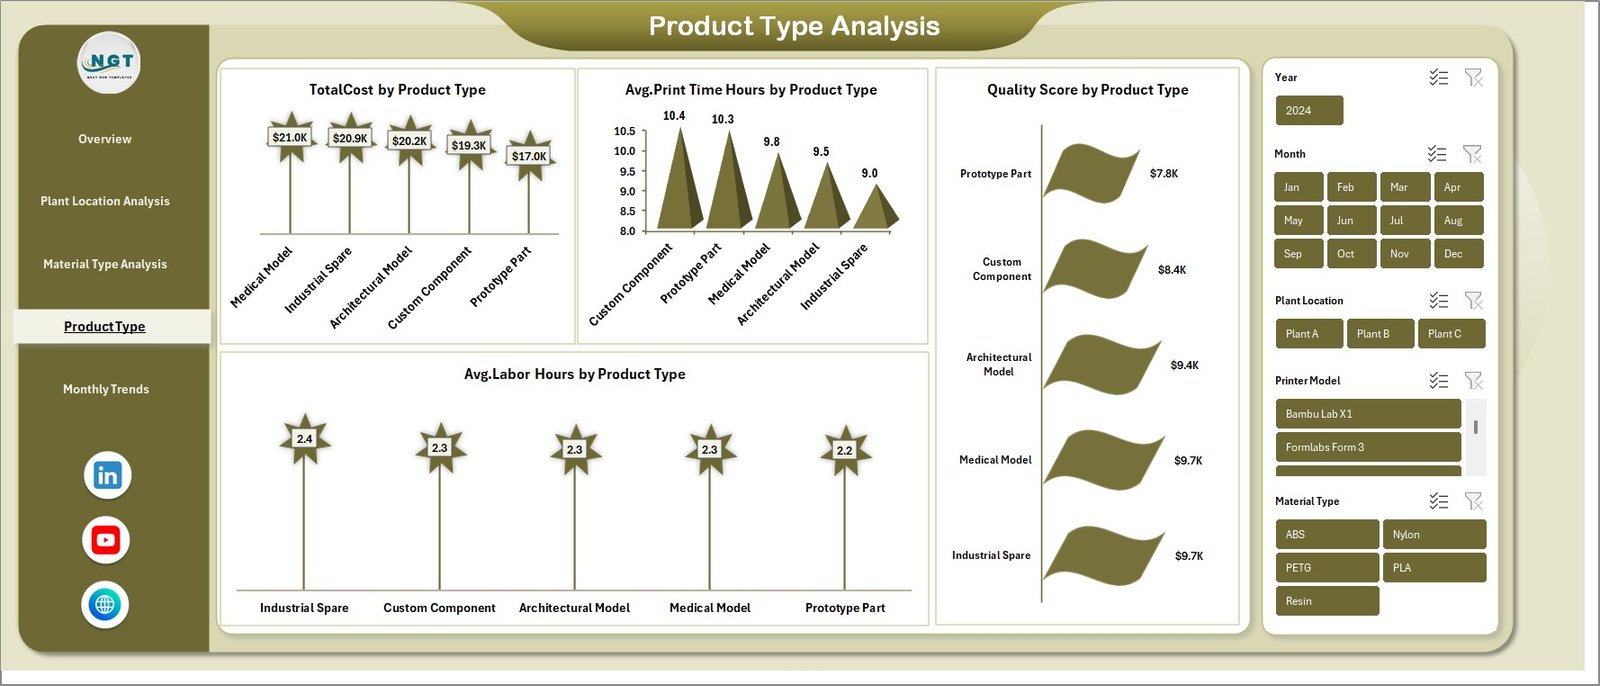
📦 Product Type Performance Monitoring
Not every product category generates the same profitability. The dashboard evaluates Total Cost, Average Print Time Hours, Average Labor Hours, and Quality Score by Product Type so manufacturers can focus on high-margin product categories.
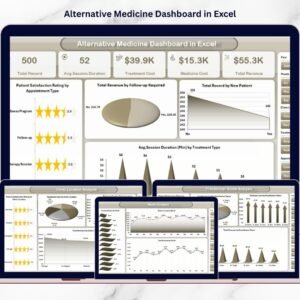
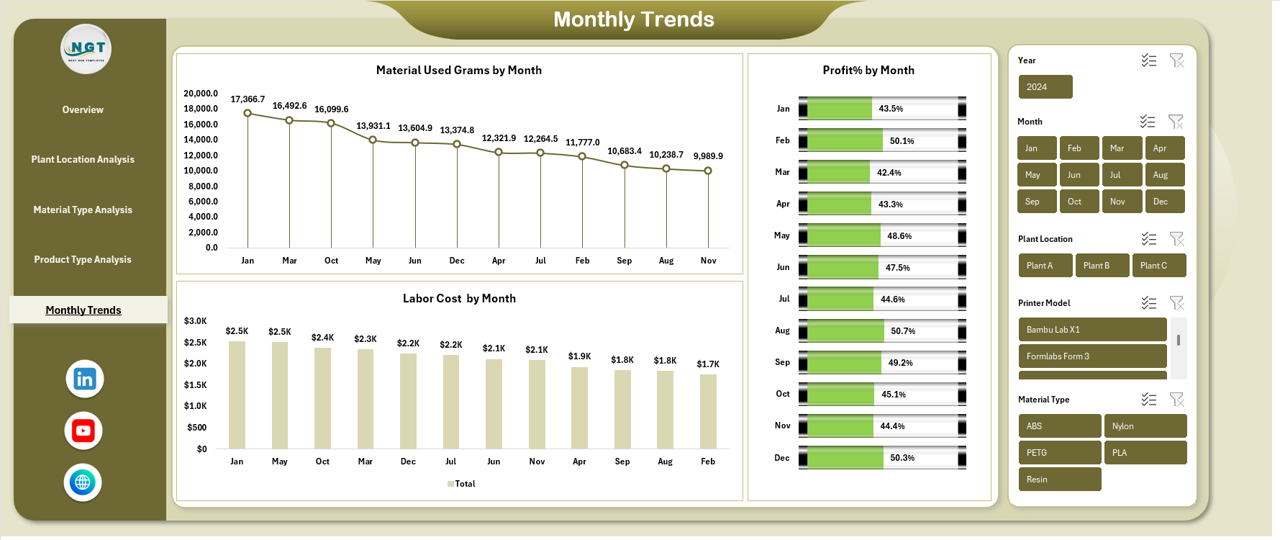
📅 Monthly Production Trend Analysis
Manufacturing performance often changes throughout the year. The monthly trends page shows Material Usage, Labor Cost, and Profit Percentage by Month, helping organizations understand seasonal patterns and cost fluctuations.
📂 What’s Inside the 3D Printing Manufacturing Dashboard in Excel
When you download this dashboard, you receive a fully structured Excel analytics system designed for manufacturing performance monitoring.
Inside the template you will find:
📊 Interactive Dashboard Sheets that display visual manufacturing analytics
📈 Pivot Table Driven Charts for dynamic production analysis
🎯 Key Performance Indicators (KPIs) including production cost, revenue, labor hours, and profit margin
🏭 Multi-Plant Production Analysis Tools for comparing facility performance
🧪 Material-Level Cost and Profit Analysis
📦 Product Category Performance Insights
📅 Monthly Trend Monitoring System
All visualizations are built using Excel pivot tables and charts, making the dashboard flexible and easy to update.
⚙️ How to Use the 3D Printing Manufacturing Dashboard in Excel
Using this dashboard is simple and requires no advanced technical knowledge.
1️⃣ Enter Your Manufacturing Data
Add production data such as plant location, material type, product category, labor hours, machine costs, and revenue.
2️⃣ Refresh the Pivot Tables
The dashboard automatically updates charts and KPIs once the pivot tables are refreshed.
3️⃣ Analyze Key Manufacturing Metrics
Monitor KPIs like Total Cost, Profit %, Material Usage, and Labor Efficiency to evaluate production performance.
4️⃣ Compare Performance Across Dimensions
Use the dashboard pages to analyze performance by plant location, material type, product type, and month.
5️⃣ Make Data-Driven Decisions
Identify cost drivers, improve resource allocation, and optimize manufacturing strategies.
👨🏭 Who Can Benefit from This 3D Printing Manufacturing Dashboard in Excel
This dashboard is designed for professionals involved in manufacturing operations and production analytics.
👨🏭 Manufacturing Managers – Monitor production costs and plant performance.
📊 Operations Analysts – Analyze production efficiency and identify operational improvements.
🏭 Factory Supervisors – Track labor hours, material usage, and machine costs.
💼 Business Owners – Evaluate manufacturing profitability and production trends.
📈 Data Analysts – Use structured data to build deeper manufacturing insights.
Both small manufacturing companies and large industrial organizations can use this dashboard to improve operational efficiency.
Click here to read the Detailed blog post
Watch the step-by-step video tutorial: