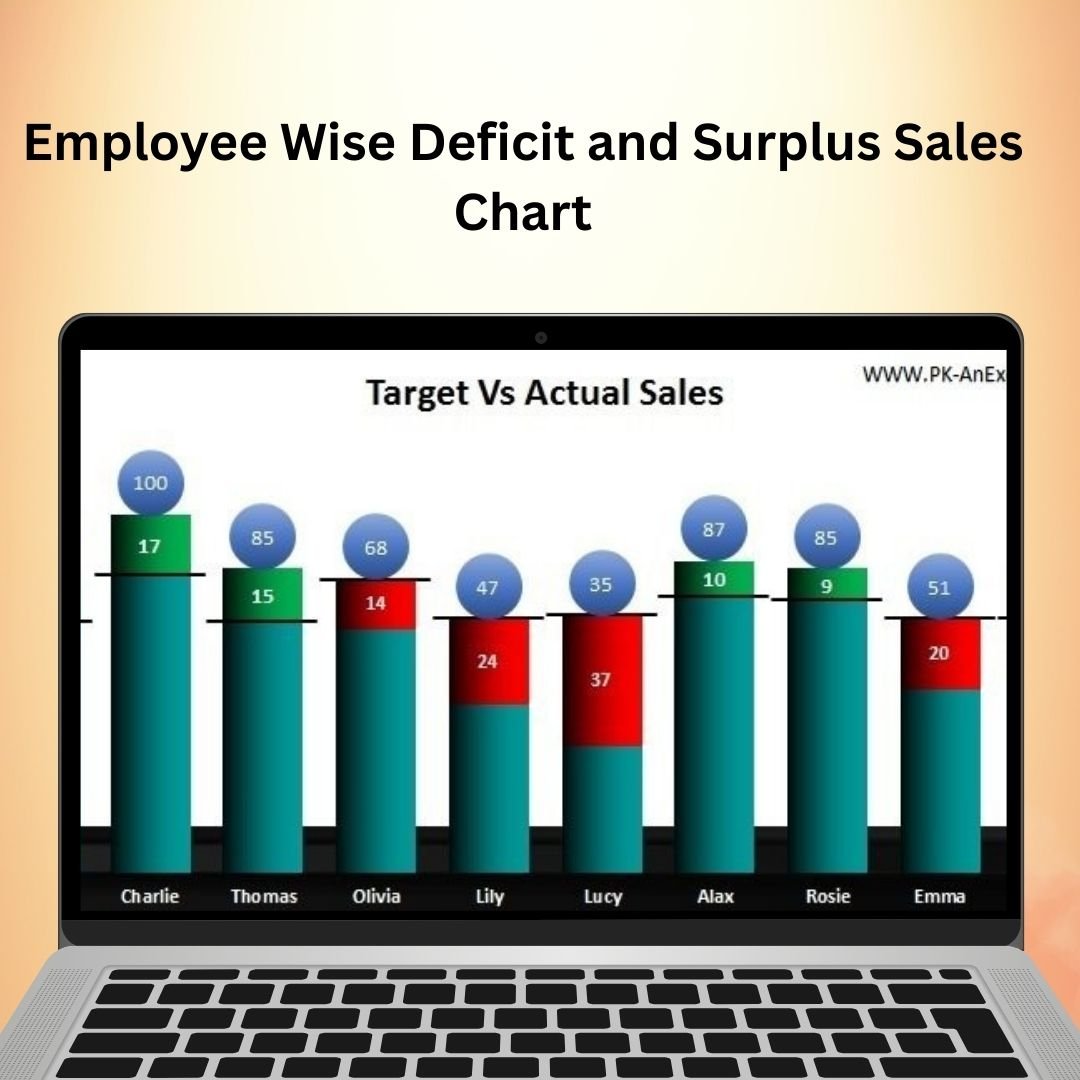
The Employee Wise Deficit and Surplus Sales Chart is a powerful Excel tool designed to help businesses track sales performance across different employees. Whether you’re managing a sales team, an individual contributor, or an entire department, this chart provides a comprehensive overview of sales deficits and surpluses, helping you make informed decisions and improve team performance.
This chart allows you to monitor each employee’s sales performance, compare it to set targets, and identify areas where they are underperforming or exceeding expectations. With dynamic data inputs, the chart automatically updates and calculates deficits and surpluses, providing real-time insights that can help you drive better performance and optimize sales strategies.
Key Features of the Employee-Wise Deficit and Surplus Sales Chart:
📊 Track Sales Deficit and Surplus
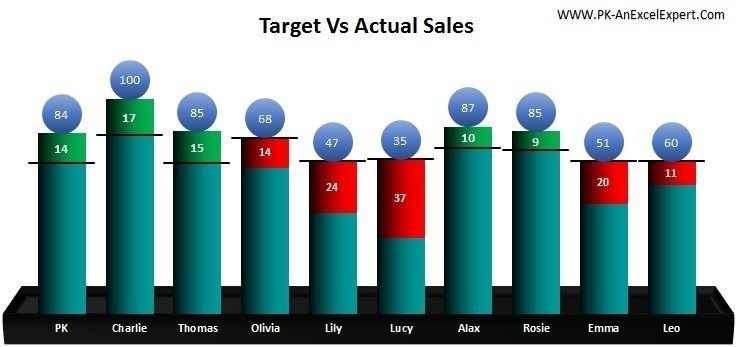
This chart provides a clear, visual representation of both sales deficits and surpluses. It allows you to compare actual sales against targets, helping you identify which employees are meeting, exceeding, or falling short of their goals.
🔄 Real-Time Updates
With every data entry, the chart automatically recalculates sales performance, adjusting the deficit and surplus amounts in real-time. This makes it easier to track progress, identify trends, and take quick action when necessary.
📝 Employee-Specific Insights
Track sales performance for each individual employee, and generate insights on who needs support and who’s exceeding their targets. This makes it easy to tailor training and development plans to ensure everyone reaches their potential.
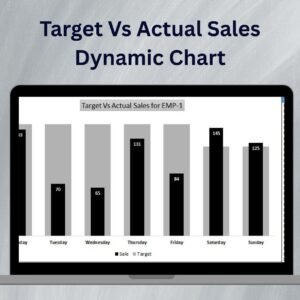
📈 Dynamic Graphs and Visualizations
Visualize employee performance through clear graphs and charts that represent surplus and deficit amounts, giving you a quick and easy-to-understand view of sales trends.
⚙️ Customizable and Scalable
Easily modify the chart to accommodate different sales targets, quotas, and team structures. Whether you have a small team or a large sales force, the chart can be adjusted to suit your organization’s needs.
Why You’ll Love This Employee-Wise Deficit and Surplus Sales Chart:
✅ Optimize Sales Performance – Quickly identify which employees need additional support or coaching, and recognize top performers to motivate and reward them. ✅ Simplifies Sales Tracking – No more manual calculations! This chart automatically tracks deficits and surpluses, saving you time and effort. ✅ Boosts Accountability – By assigning clear sales targets and visualizing progress, employees are more accountable for meeting their goals. ✅ Improves Decision-Making – Use real-time data to make better, data-driven decisions on sales strategy, employee performance, and resource allocation. ✅ Customizable for Any Team Size – Adjust the chart to suit the specific needs of your business, from small teams to large departments.
What’s Inside the Employee-Wise Deficit and Surplus Sales Chart:
- Employee Sales Data – Input actual sales figures and target values for each employee.
- Deficit and Surplus Calculation – Automatically calculate how each employee’s sales compare to their targets, with results displayed clearly.
- Visual Representations – Dynamic bar and line graphs that display employee performance in a visually appealing way.
- Individual Performance Insights – Easily view each employee’s deficit or surplus and compare across different periods.
- Customizable Input Fields – Adjust fields to fit your team’s specific sales targets and performance metrics.
How to Use the Employee-Wise Deficit and Surplus Sales Chart:
1️⃣ Download the Template – Get instant access to your Excel file after purchase. 2️⃣ Input Employee Data – Add employee names, actual sales, and target sales figures. 3️⃣ Track Performance – Watch the chart automatically calculate deficits and surpluses. 4️⃣ Review Performance – Use the graphs and data to analyze employee performance and make adjustments as needed.
Who Can Benefit from This Employee-Wise Deficit and Surplus Sales Chart?
- Sales Managers & Directors
- HR and Sales Teams
- Business Analysts
- Team Leaders
- Small and Medium Businesses (SMBs)
- Enterprises and Large Corporations
Get a clear picture of how your sales team is performing and take action to boost results with this easy-to-use, customizable Excel chart.
Click here to read the Detailed blog post
https://www.pk-anexcelexpert.com/employee-wise-deficit-and-surplus-sales-chart/


Reviews
There are no reviews yet.