Managing street lighting infrastructure is essential for every modern city. Proper lighting improves road safety, enhances public security, and supports urban development. However, managing thousands of streetlights across different locations can be extremely challenging without a structured monitoring system.
Many municipalities still track maintenance performance, energy consumption, repair activities, and operational costs using scattered spreadsheets or manual reports. As a result, managers struggle to evaluate performance trends, monitor maintenance efficiency, and identify operational gaps.
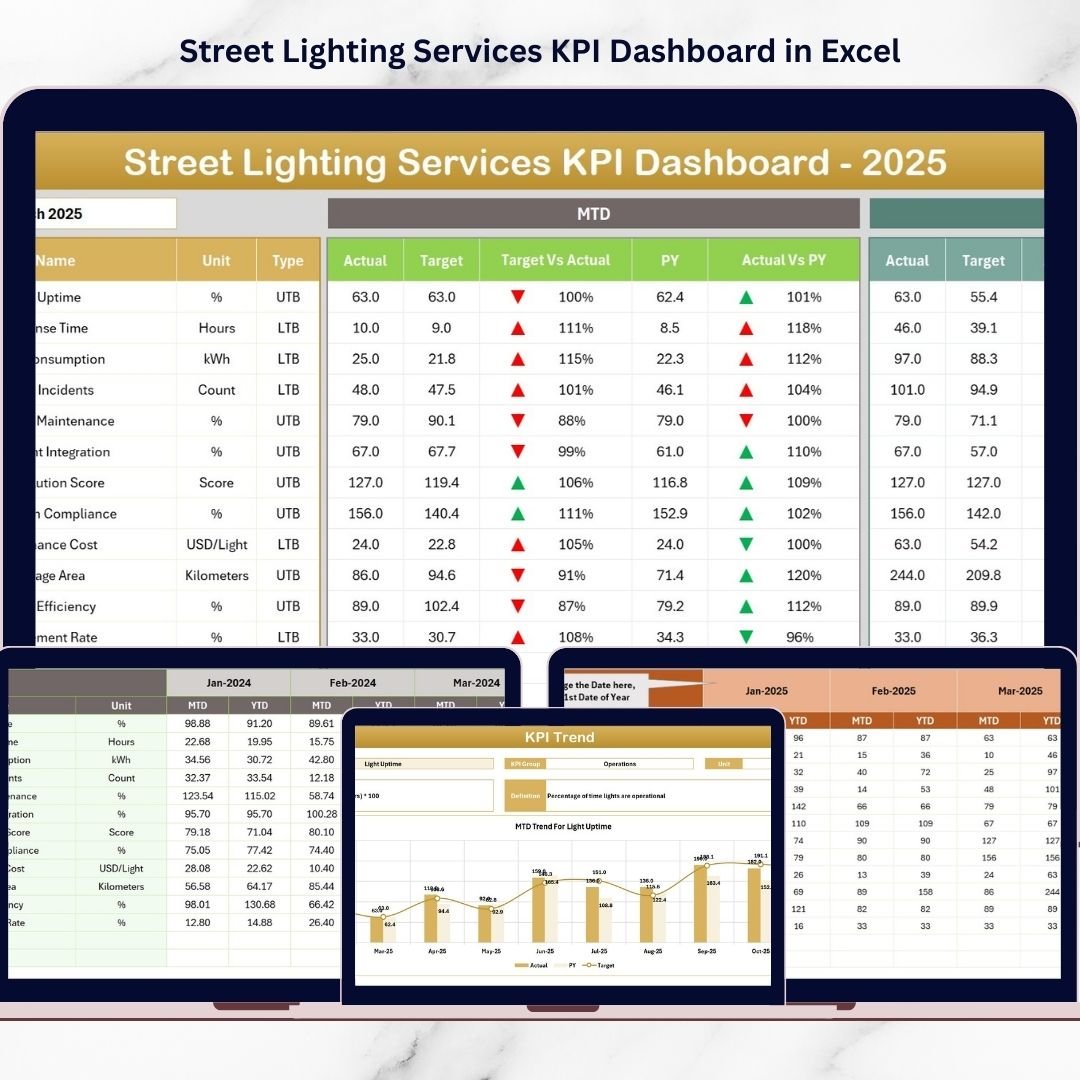
The Street Lighting Services KPI Dashboard in Excel provides a powerful and ready-to-use analytics solution that helps municipalities and infrastructure teams monitor street lighting performance efficiently. This Excel template converts complex operational data into clear KPI indicators, interactive charts, and performance reports, enabling decision-makers to evaluate service performance and improve operational efficiency.
With this dashboard, city authorities can track maintenance performance, service requests, energy efficiency, operational costs, and reliability metrics in one centralized system. Because the template includes dynamic calculations, automated comparisons, and visual analytics, managers can quickly identify issues and take corrective actions.
⚡ Key Features of Street Lighting Services KPI Dashboard in Excel
📊 Interactive KPI Dashboard
A centralized dashboard displays important street lighting performance indicators including maintenance efficiency, operational metrics, and service performance.
📅 Monthly Performance Analysis
Select any month from the drop-down menu and instantly analyze service performance for that period.
📈 MTD and YTD KPI Tracking
Monitor Month-to-Date (MTD) and Year-to-Date (YTD) metrics to understand operational performance trends.
🎯 Target vs Actual Performance Comparison
Compare actual KPI performance with targets to identify whether operational goals are achieved.
📉 Previous Year Performance Comparison
Analyze current performance against historical data to evaluate year-over-year improvements.
📊 KPI Trend Analysis Charts
Visual charts display KPI performance trends, helping managers monitor operational progress over time.
🏙 Maintenance Performance Monitoring
Track maintenance completion rates, repair activities, and service efficiency.
⚡ Energy Efficiency Monitoring
Analyze energy usage and identify opportunities to reduce electricity consumption.
📂 Structured Excel Worksheets
Seven well-organized worksheets help manage data, track KPIs, and analyze performance efficiently.
🚀 Fully Automated Reporting System
Once data is entered, the dashboard automatically updates all charts, indicators, and reports.
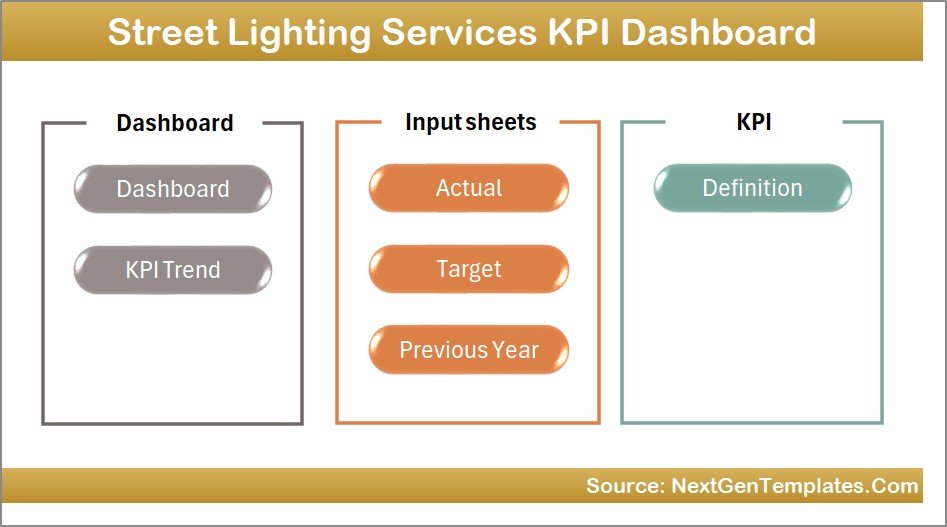
📦 What’s Inside the Street Lighting Services KPI Dashboard
This Excel template contains seven structured worksheets designed to manage data and analyze performance efficiently.
1️⃣ Home Sheet – Navigation Page
The Home sheet acts as the dashboard index page. It includes six navigation buttons that allow users to quickly access different sections of the dashboard.
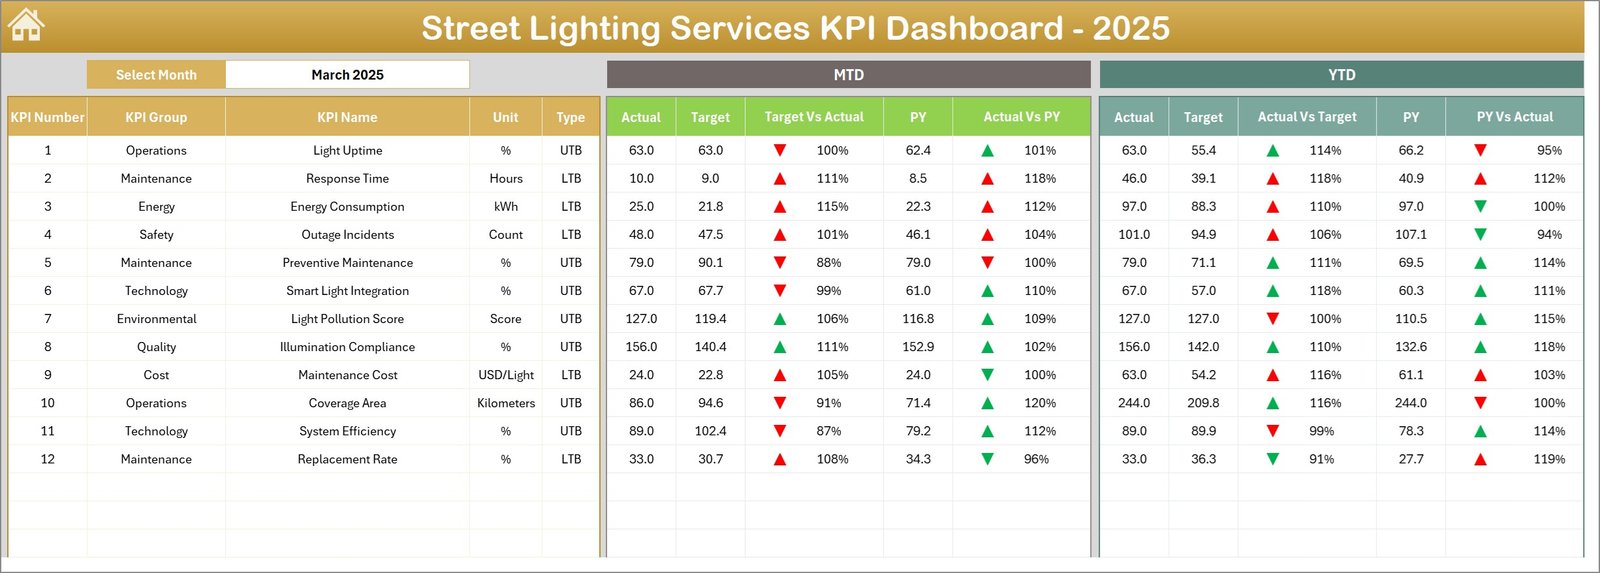
2️⃣ Dashboard Sheet – Main KPI Overview
This is the primary dashboard page displaying all KPI metrics. Users can select the month in cell D3, and the dashboard automatically updates.
The dashboard displays:
-
MTD Actual, Target, and Previous Year values
-
Target vs Actual comparison
-
Previous Year vs Actual comparison
-
YTD Actual, Target, and Previous Year values
Conditional formatting arrows highlight whether performance improves or declines.
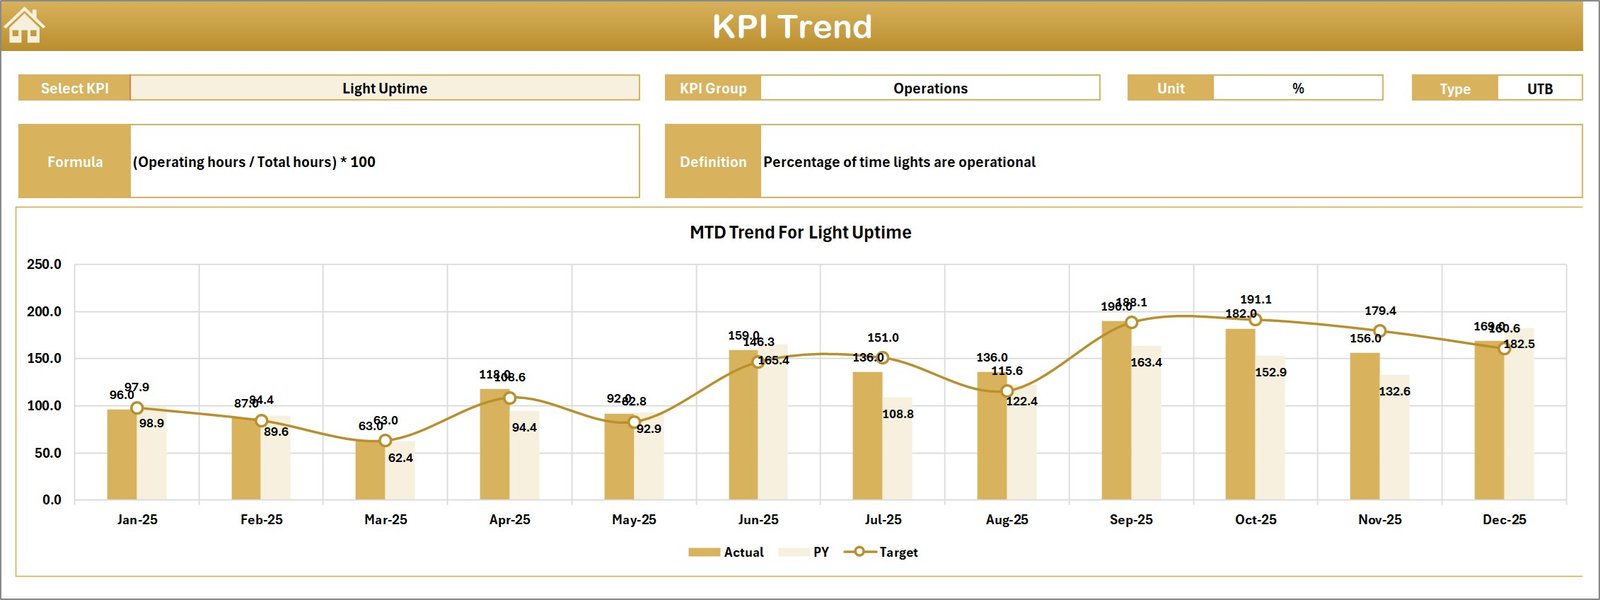
3️⃣ KPI Trend Sheet – KPI Performance Analysis
This sheet allows users to analyze detailed KPI trends.
Users can select a KPI from the drop-down list in cell C3, and the dashboard displays:
-
KPI Group
-
KPI Unit
-
KPI Type (Lower the Better or Upper the Better)
-
KPI Formula
-
KPI Definition
Trend charts display MTD and YTD performance comparisons.
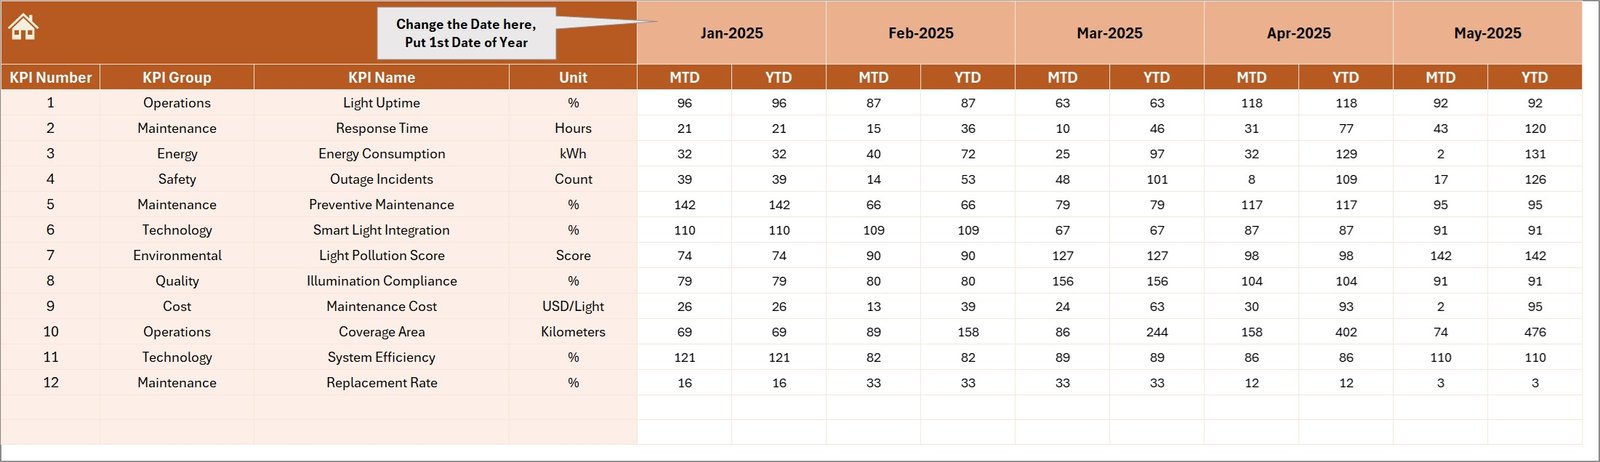
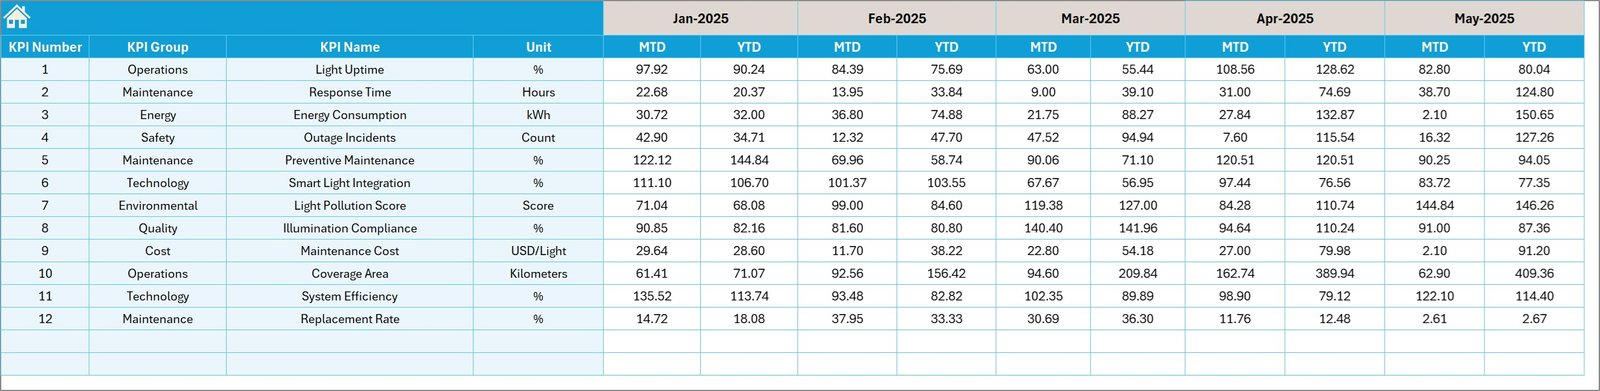
4️⃣ Actual Numbers Input Sheet – Data Entry Page
This sheet is used for entering actual KPI performance data.
Users simply:
-
Enter the starting month of the year
-
Input MTD and YTD actual values for each KPI
Once data is entered, the dashboard automatically updates.
5️⃣ Target Sheet – KPI Target Management
This sheet stores performance targets.
Users enter monthly target values for:
-
MTD Targets
-
YTD Targets
These targets help evaluate operational performance.
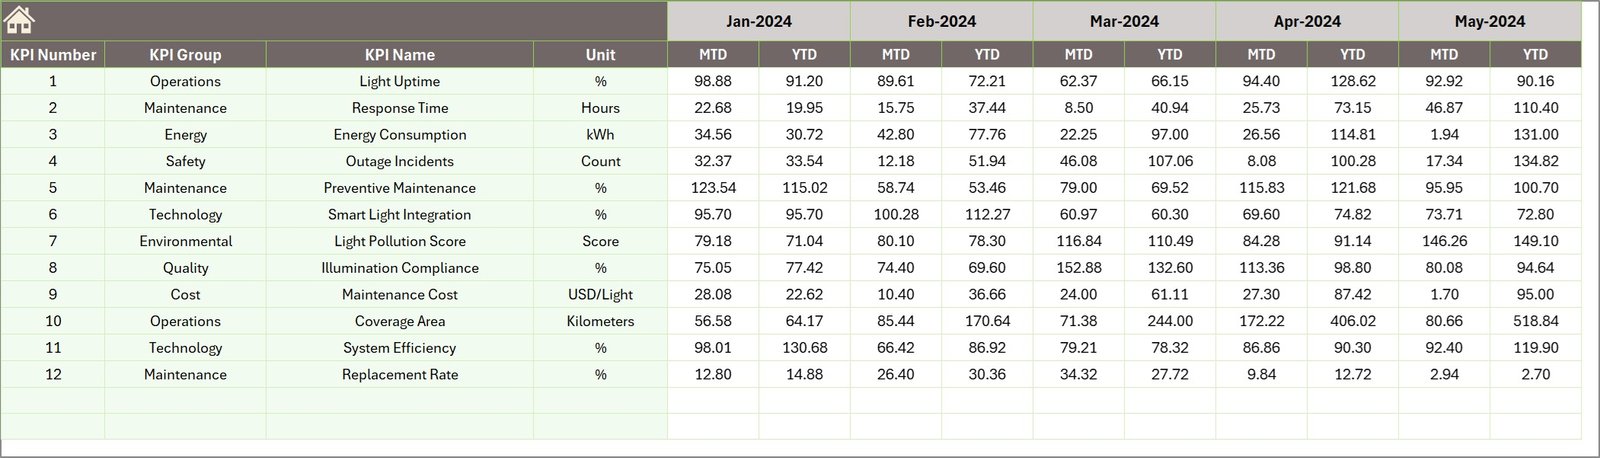
6️⃣ Previous Year Numbers Sheet – Historical Data
This sheet stores historical KPI values for comparison with the current year.
Managers can easily evaluate performance improvements and seasonal trends.
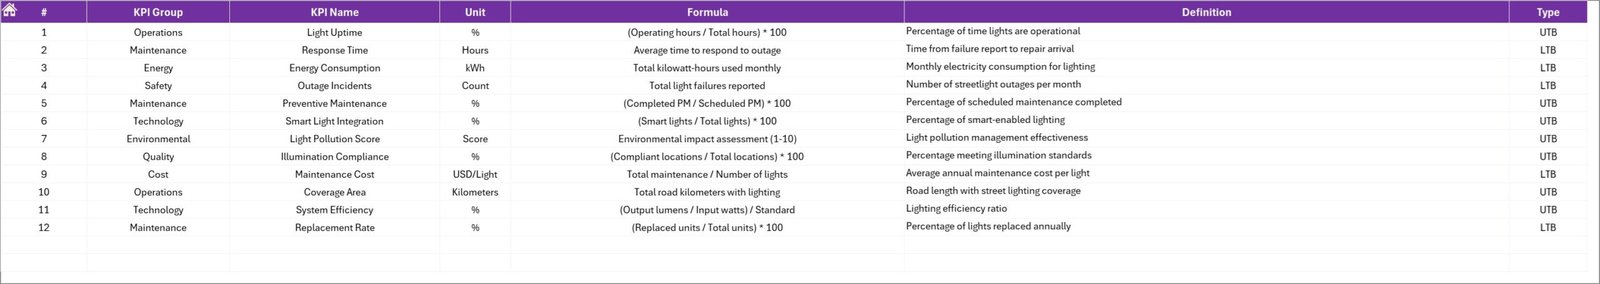
7️⃣ KPI Definition Sheet – KPI Information
This sheet stores detailed information about KPIs including:
-
KPI Name
-
KPI Group
-
KPI Unit
-
KPI Formula
-
KPI Definition
This helps standardize KPI reporting across the organization.
🛠 How to Use the Street Lighting Services KPI Dashboard
Using this Excel dashboard is simple and requires minimal setup.
1️⃣ Define important street lighting KPIs such as maintenance performance and energy efficiency.
2️⃣ Enter KPI definitions in the KPI Definition sheet.
3️⃣ Input target values in the Target sheet.
4️⃣ Enter actual performance data in the Actual Numbers sheet.
5️⃣ Add historical values in the Previous Year sheet.
6️⃣ Monitor KPI trends and performance indicators on the dashboard.
Once the data is entered, the template automatically updates all visual reports and charts.
👨💼 Who Can Benefit from This Street Lighting Services KPI Dashboard?
This dashboard is highly valuable for professionals responsible for managing urban infrastructure.
🏙 Municipal Authorities – Monitor city lighting performance and maintenance efficiency.
⚙ Infrastructure Management Teams – Track operational metrics and service performance.
🔧 Maintenance Teams – Monitor repair activities and service request resolution.
📊 Data Analysts – Analyze lighting performance data and identify operational trends.
🏢 Smart City Project Managers – Improve urban infrastructure monitoring and planning.
🌍 Public Infrastructure Consultants – Evaluate lighting system performance and recommend improvements.
Click here to read the Detailed blog post
Visit our YouTube channel to learn step-by-step video tutorials
👉 YouTube Channel: https://youtube.com/@PKAnExcelExpert


