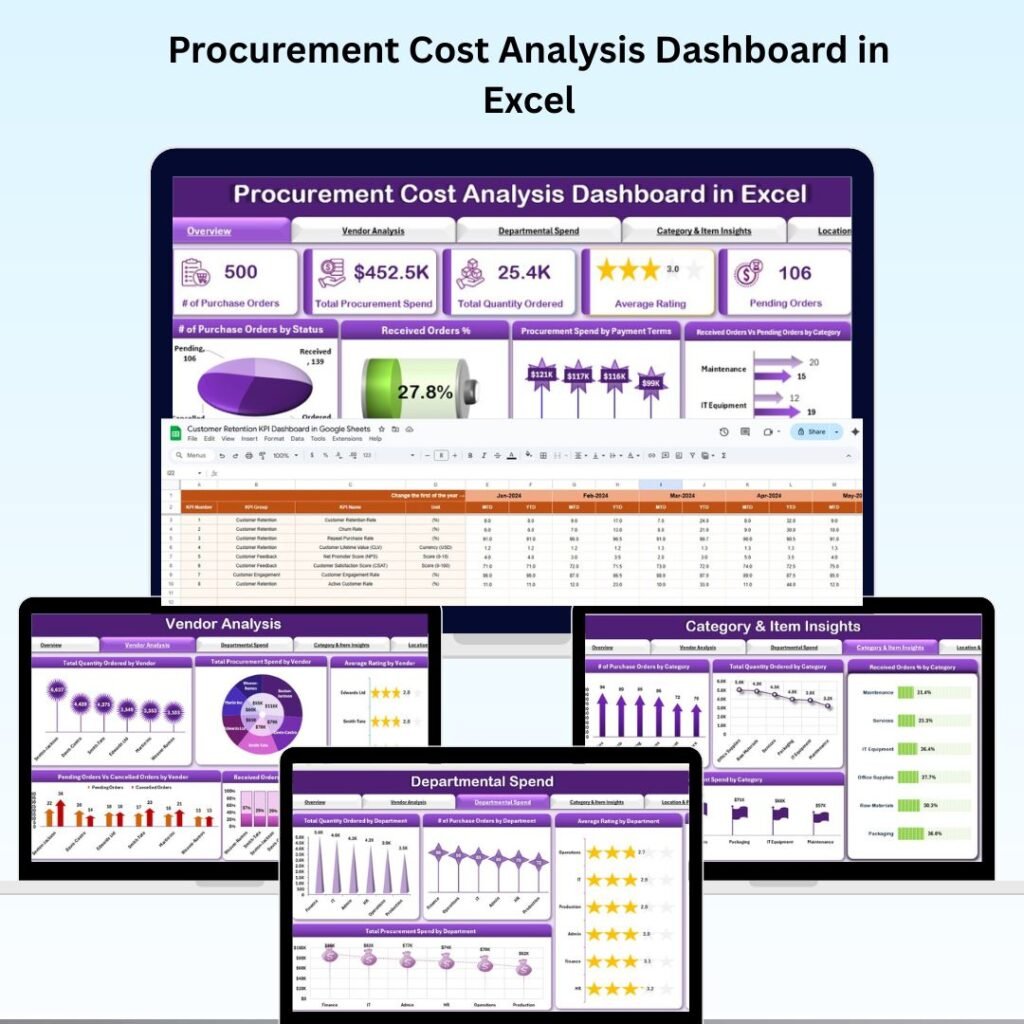
Introducing the Procurement Cost Analysis Dashboard in Excel — a ready-to-use, interactive solution built specifically for procurement professionals who want real-time visibility into costs, vendor performance, and departmental spending. And right now, it’s available for just $14.99 (originally $28.99).procurement cost analysis dashboard
1. 📊 Get a Complete Procurement Overview at a Glance
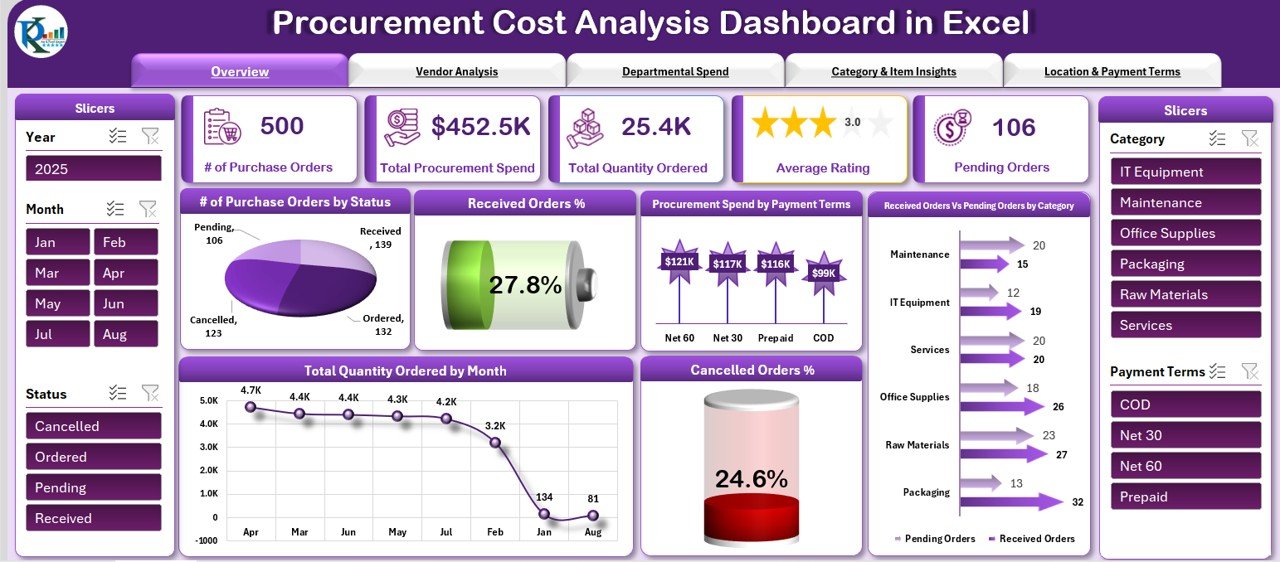
The Overview Sheet is your command center. The moment you open the dashboard, you’re greeted with a clean, visually rich summary of everything that matters — without digging through rows of raw data.procurement cost analysis dashboard
Key metric cards instantly show you:
- Total Purchase Orders
- Total Spend
- Quantity Ordered
- Average Vendor Rating
- Pending Orders
Built-in charts display order status distribution, received vs. pending orders by category, monthly quantity trends, and cancellation percentages — giving you a complete procurement health check at a glance.procurement cost analysis dashboard
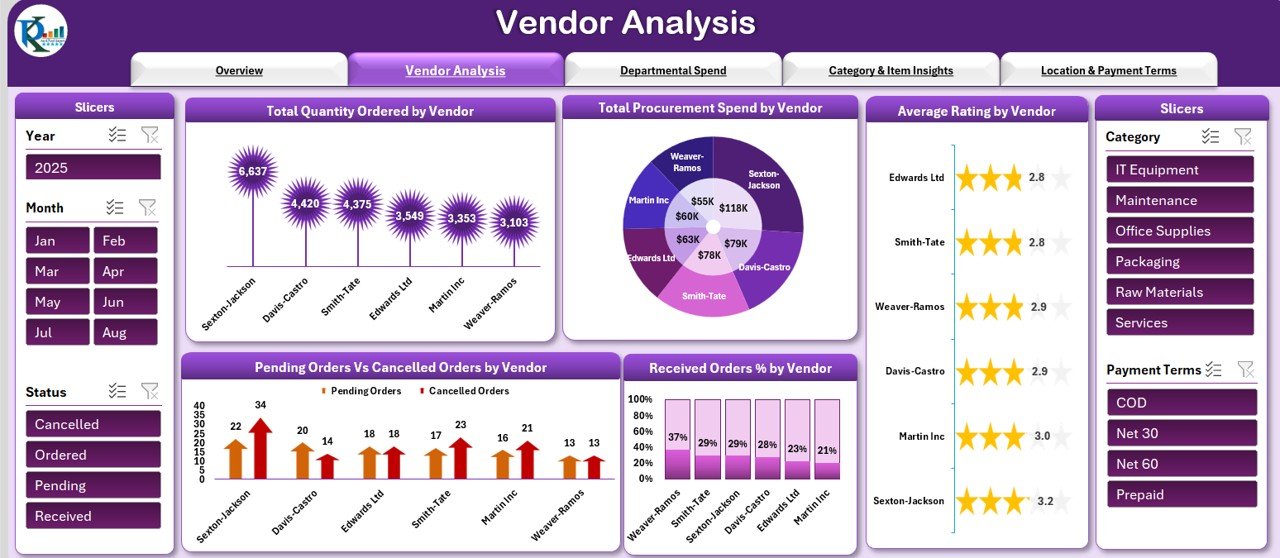
2. 🏭 Analyze Vendor Performance Like Never Before
One of the most powerful sections in this Procurement Cost Analysis Dashboard is the Vendor Analysis Tab. It lets you compare all your suppliers side by side using data that actually matters.procurement cost analysis dashboard
For each vendor, you can track:
- Total Spend and Quantity Ordered
- Average Rating and Order Fulfillment %
- Cancellation rates and pending order volumes
This means no more guesswork. You’ll know exactly which vendors deliver consistent value — and which ones need a serious conversation (or replacement).
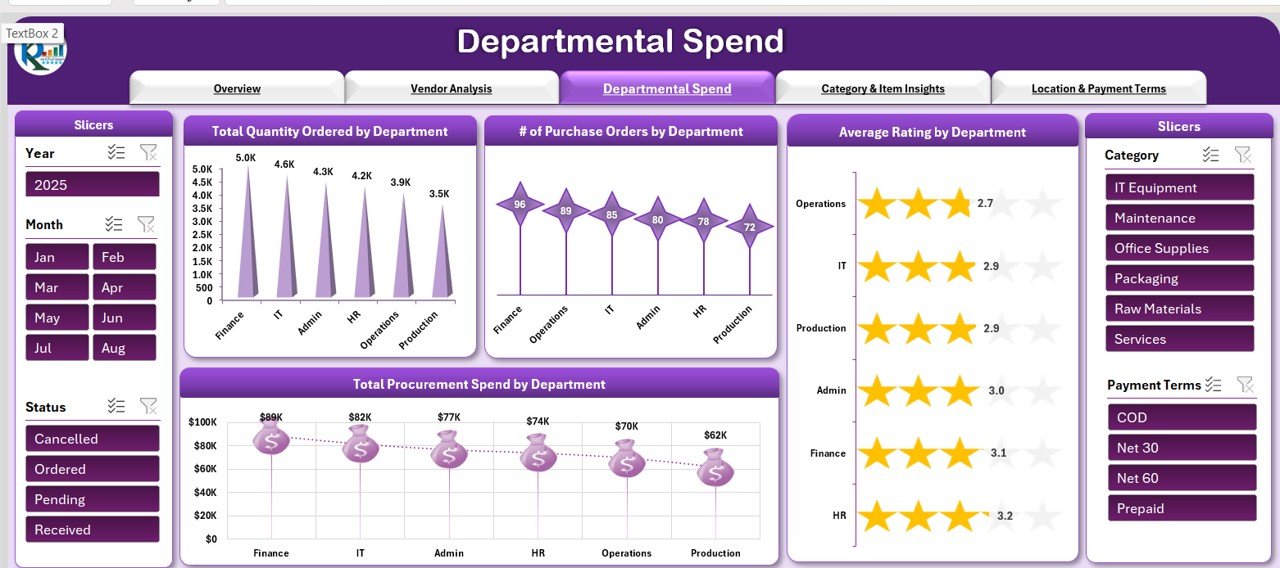
3. 🏢 Keep Departmental Budgets Under Control
Budget overruns in procurement often go unnoticed until it’s too late. The Departmental Spend Tab solves that by giving you a department-by-department breakdown of procurement activity.procurement cost analysis dashboard
You can monitor:
- How much each department is spending
- How many purchase orders they’re raising
- Their average vendor ratings
- Quantities ordered per team
This level of transparency helps finance and operations leaders enforce budget compliance and make smarter resource allocation decisions all year long.
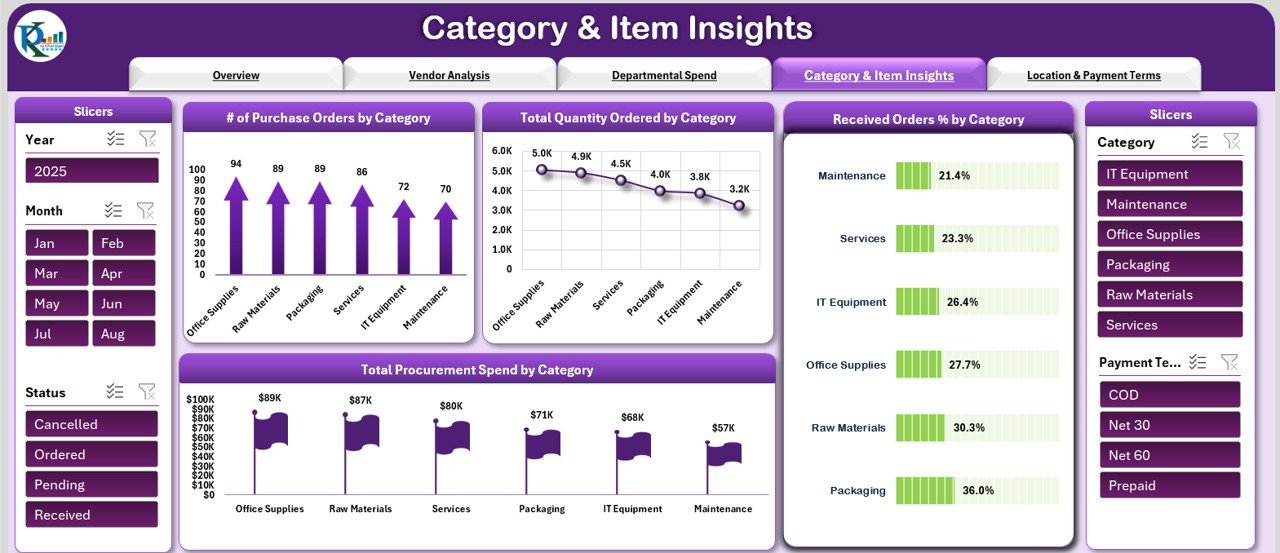
4. 📦 Identify High-Cost Categories and Optimize Spending
Not all procurement categories carry the same weight. Some categories silently drain your budget while others are well-managed. The Category & Item Insights Tab brings these imbalances to light.
With this tab, you can analyze:
- Purchase Orders and quantities per category
- Total spend by product category
- Fulfillment rates for each category
Armed with this data, procurement managers can negotiate better contracts, consolidate orders, and reduce unnecessary spending in high-cost areas — often resulting in significant savings.
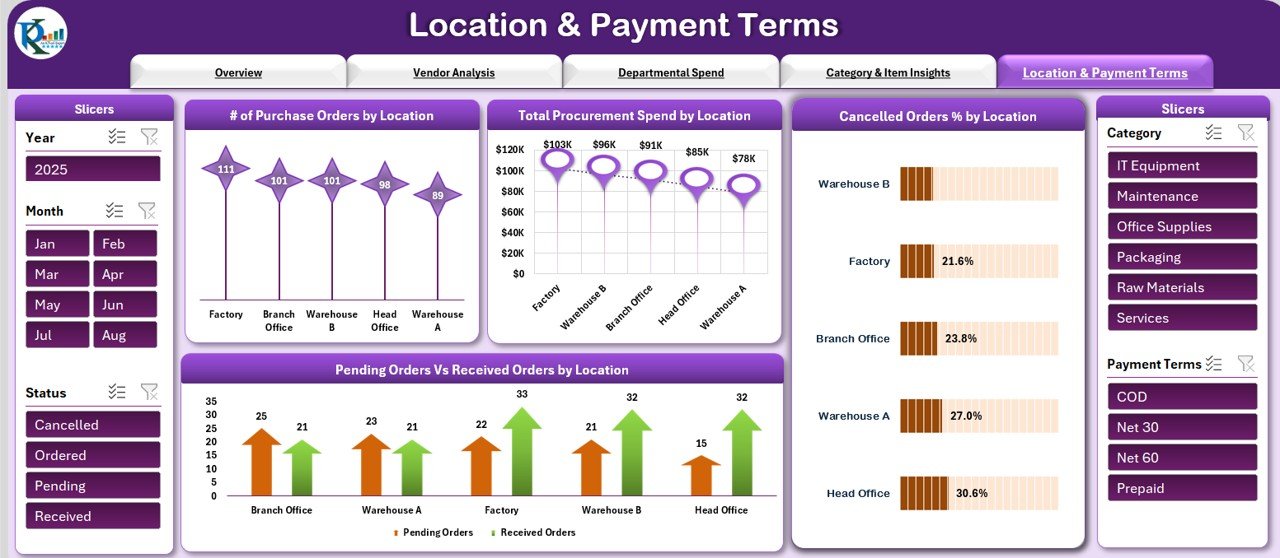
5. 🌍 Track Regional Performance with Location Insights
Managing procurement across multiple offices or warehouses? The Location & Payment Terms Tab gives you a geographic breakdown of your purchasing activity.
You’ll be able to see:
- Spend and order volumes by region or location
- Cancellation rates across different sites
- Payment term breakdowns (Net 30, Net 60, etc.) to manage cash flow strategically
Understanding where your money is being spent — and how it’s being financed — gives your business a significant competitive edge when negotiating with suppliers.
6. 🧾 One Centralized Data Input Sheet — Zero Confusion
A dashboard is only as good as its data. That’s why this tool includes a dedicated Data Input Sheet that acts as the single source of truth for all procurement records.
Here’s what makes it brilliant:
- Enter all procurement data in one place
- All tabs and charts update automatically
- No manual linking or formula editing required
- Easy for non-technical users to operate
Whether you update it daily or weekly, the entire dashboard refreshes instantly — giving you a real-time picture of your procurement operations without extra effort.
7. ✅ Fully Customizable and Ready to Use Immediately
Unlike complex BI tools that require setup, training, or expensive licenses, this Excel Procurement Dashboard is designed to work right out of the box.
- Pre-built charts and formulas — no setup required
- Fully customizable layout to match your organization’s branding
- Works in standard Microsoft Excel — no plugins or add-ons needed
- One-time download, use it forever
It’s practical, affordable, and built for real-world procurement teams.
👥 Who Should Use This Dashboard?
Procurement Managers
Full visibility into costs, vendor performance, and order status — all in one place.
Finance Teams
Track spending patterns and ensure every department stays within budget.
Operations Managers
Spot procurement bottlenecks and streamline purchasing workflows effectively.
Multi-Location Businesses
Compare procurement performance across regions in a single, unified view.
Manufacturing & Retail
Manage supplier relationships and control category spending with confidence.
🚀 How to Get Started in 3 Simple Steps
Ready to Take Control of Your Procurement Costs?
Stop letting inefficiencies drain your budget. Get the full-featured Procurement Cost Analysis Dashboard today and start making smarter, data-driven decisions.
💡 Final Thoughts
Procurement data doesn’t have to be overwhelming. With the right tool, it becomes your greatest asset for making faster, smarter, and more cost-effective decisions.
The Procurement Cost Analysis Dashboard in Excel gives you everything you need — clean visuals, automated calculations, multi-dimensional analysis, and full customization — all in a familiar Excel environment.
Visit our YouTube channel to learn step-by-step video tutorials