Stop guessing where your training dollars go. Get real-time visibility with ready-to-use dashboards built for Excel, Power BI & Google Sheets.training budget dashboard
Is your organization investing thousands in employee training — but struggling to track where every dollar goes? You’re not alone. Most HR and L&D teams deal with scattered spreadsheets, outdated reports, and zero real-time visibility into training budgets. The result? Overspending goes unnoticed, programs underperform, and decision-making becomes guesswork.
The good news? You don’t need a complex analytics system to fix this. At NextGenTemplates.com, we’ve built three ready-to-use Training Budget Dashboards tailored to your preferred platform — Excel, Power BI, and Google Sheets. Each one is packed with interactive visuals, key KPIs, and deep analytical insights that help HR professionals, L&D managers, and finance teams take full control of their training investments.
Why You Need a Training Budget Dashboard
Training budgets are under more scrutiny than ever. Without a structured dashboard, critical questions go unanswered.
Department Overspend
Which departments are going over budget? Without a dashboard, overspending is invisible until it’s too late.
Trainer ROI Blind Spots
Are your trainers delivering results relative to cost? Manual reports can’t give you this clarity fast enough.
Program Efficiency Gaps
Which programs are cost-efficient and which are bleeding money? You need visual data to find out quickly.
No Monthly Trends
How does budget utilization trend over time? Scattered spreadsheets make month-by-month comparison nearly impossible
Training Budget Dashboard in Excel
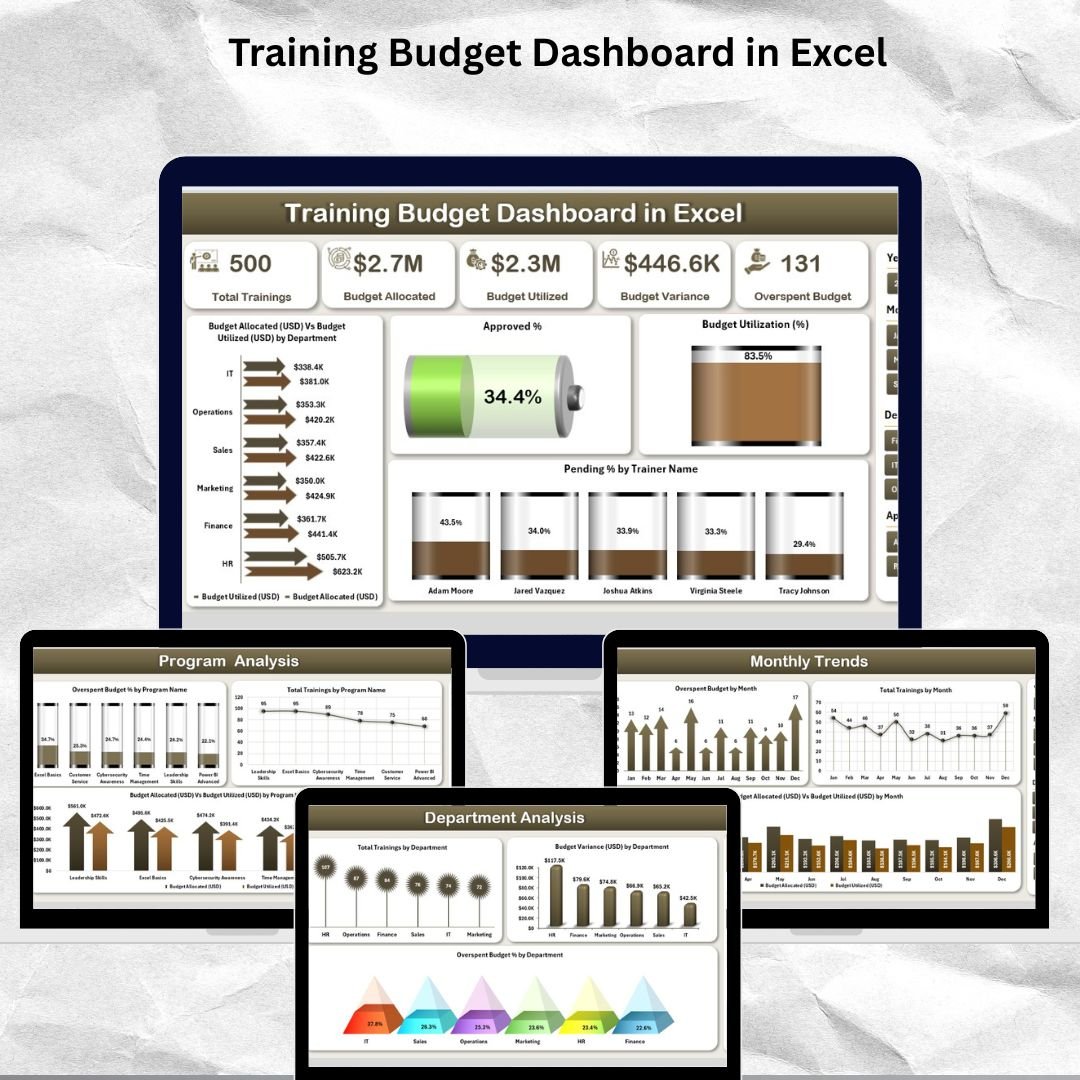
If your team lives in Microsoft Excel, this is the perfect starting point. The Training Budget Dashboard in Excel is a fully interactive, no-macro, no-subscription solution that gives you complete training budget visibility — right inside Excel.
Built with dynamic Pivot Charts, Slicers, and native Excel formulas, this dashboard puts all your data into one sleek, intuitive file. No extra software. No coding required.
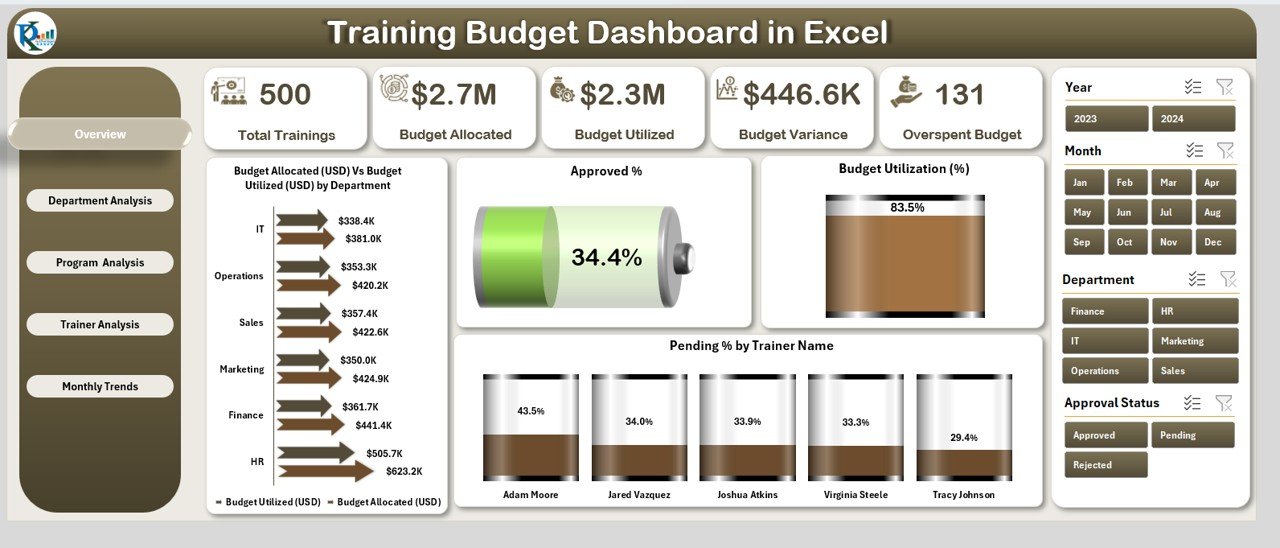
📑 5 Dashboard Pages Included:
- ✅ 5 KPI Cards: Budget Allocated, Utilized, Utilization %, Approved %, Pending %
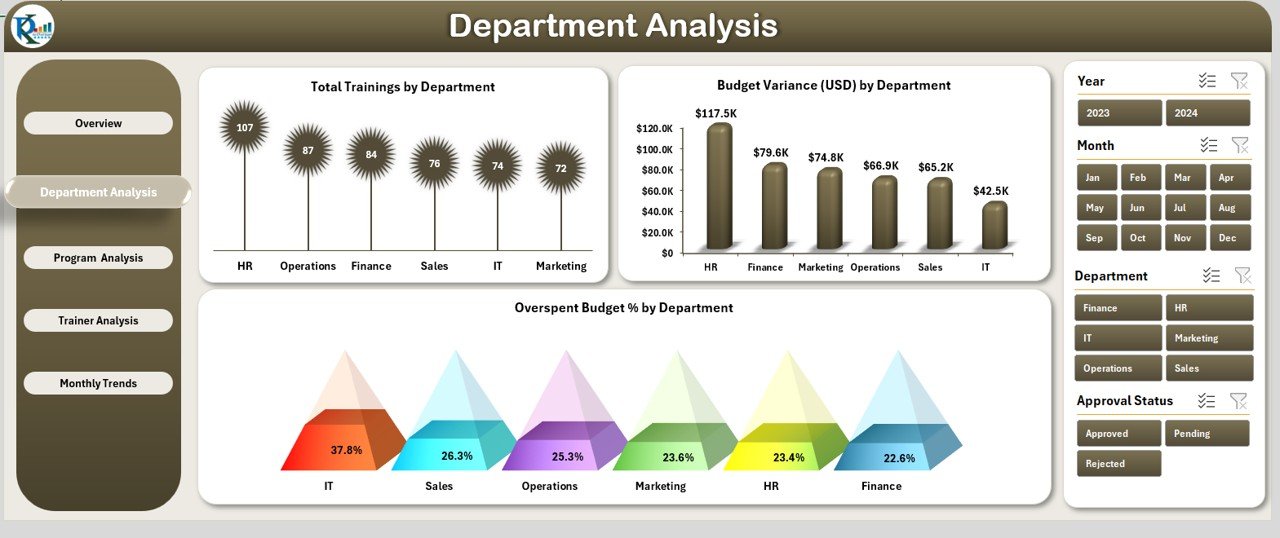
- ✅ Department drill-down: Overspend %, Variance, Total Trainings
- ✅ Trainer-level reject rate, session count & budget impact
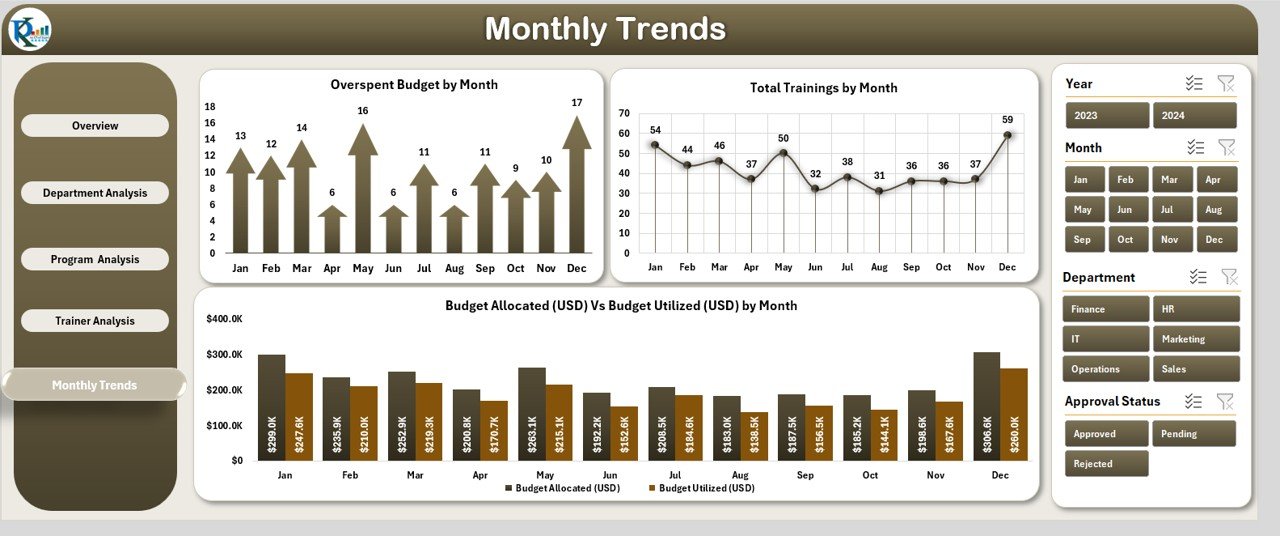
- ✅ Month-by-month budget utilization trend charts
- ✅ Left-side Page Navigator for seamless switching
- ✅ 100% Excel-driven — no VBA, no macros, no subscriptions
HR professionals, finance teams, and L&D managers who prefer working in a familiar Excel environment without needing additional software.
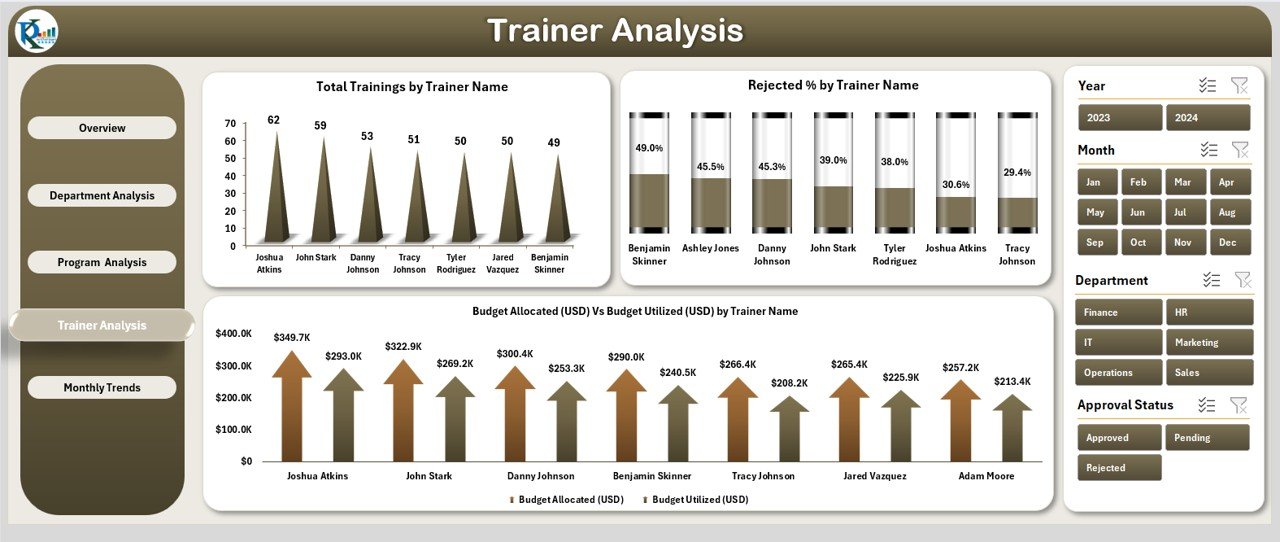
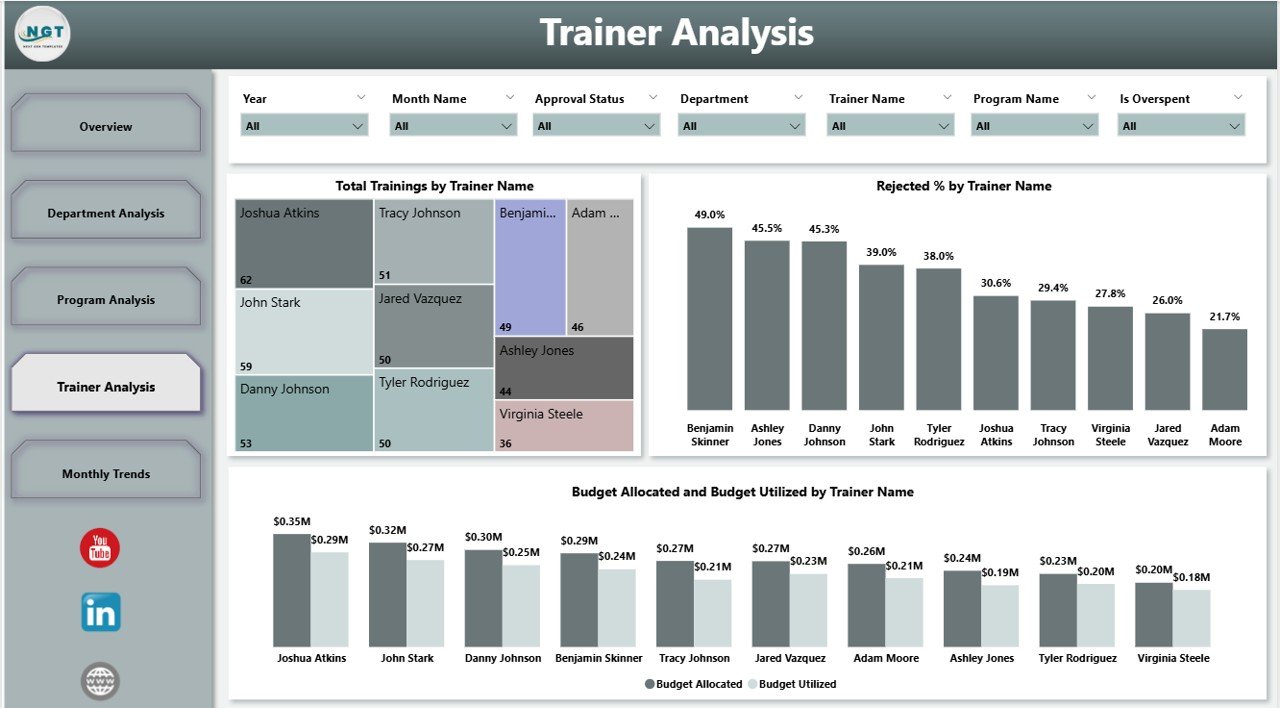
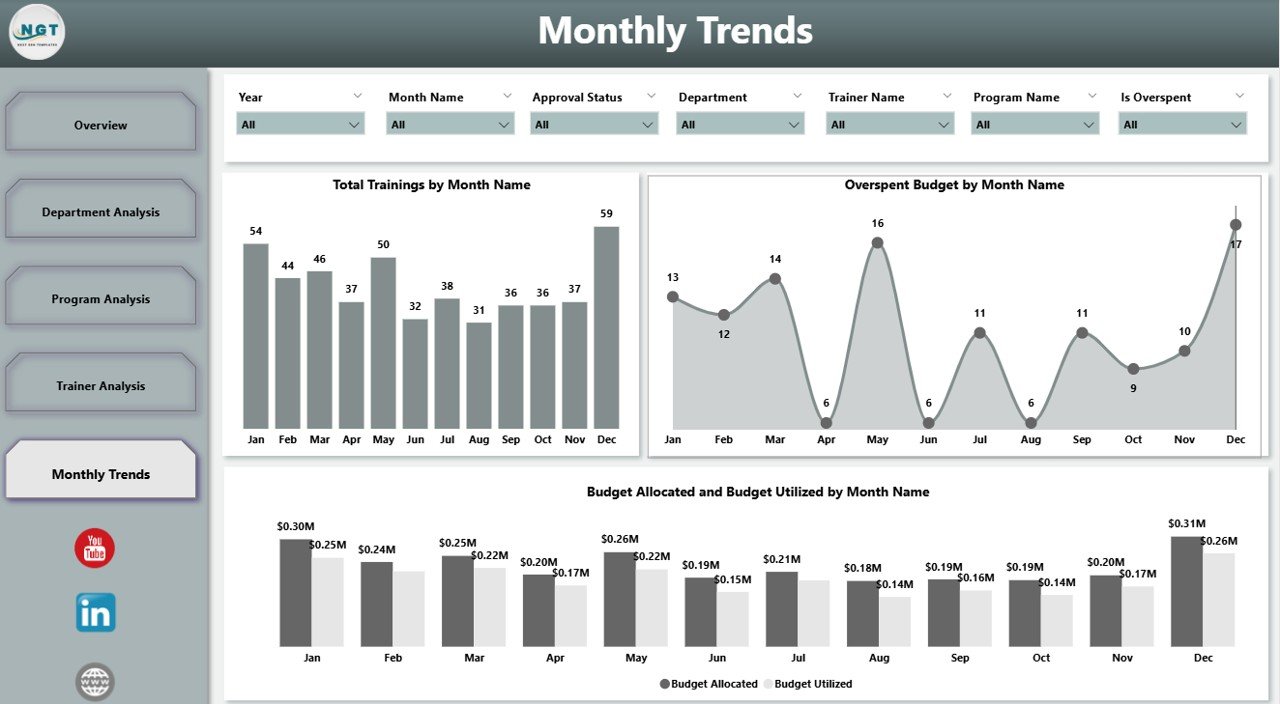
Training Budget Dashboard in Power BI
For teams that need enterprise-grade analytics with real-time interactivity, the Training Budget Dashboard in Power BI is a game-changer. This dashboard connects directly to your Excel data source and transforms rows of numbers into stunning, interactive visuals that refresh automatically.
With Power BI slicers, managers can filter by department, trainer, program, or month — getting instant, pinpoint answers without building a single report manually.
📑 5 Interactive Dashboard Pages:
- ✅ Real-time KPI cards: Approved %, Utilization %, Pending %, Budget Allocation vs. Utilized
- ✅ Interactive filters by department, trainer, program, and month
- ✅ Budget variance and overspend detection across all departments
- ✅ Trainer reject rate, efficiency, and budget consumption analysis
- ✅ Automatic data refresh — no manual report building
- ✅ Scalable for small businesses and large enterprises alike
Organizations looking for enterprise-level insights, data-driven L&D strategy, and visually compelling reports for leadership.


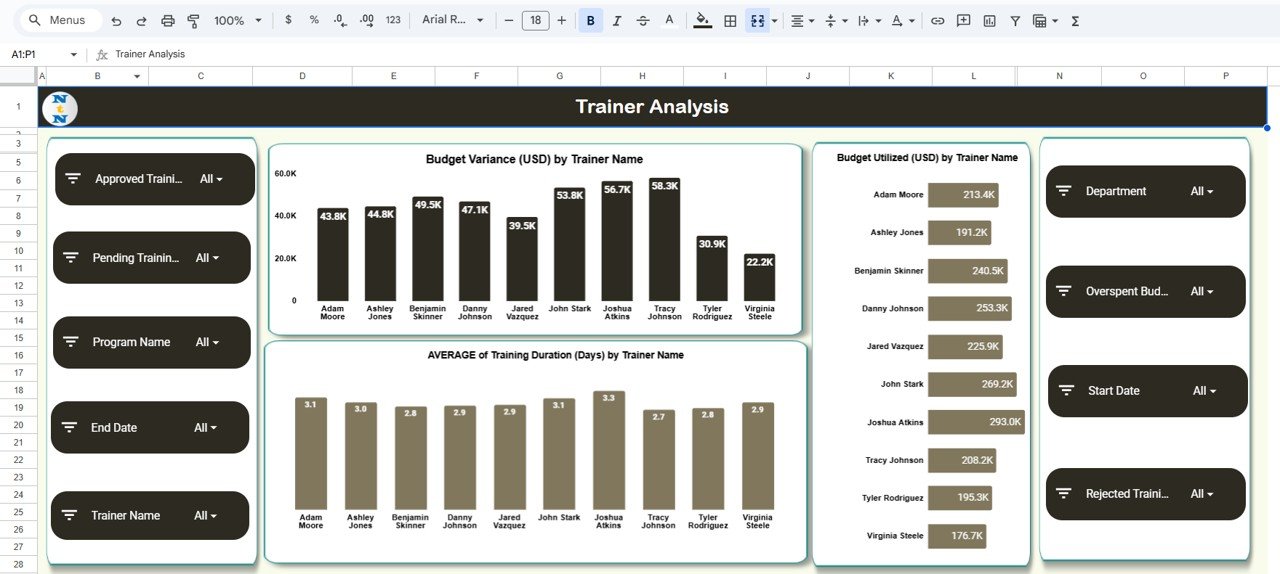
Training Budget Dashboard in Google Sheets
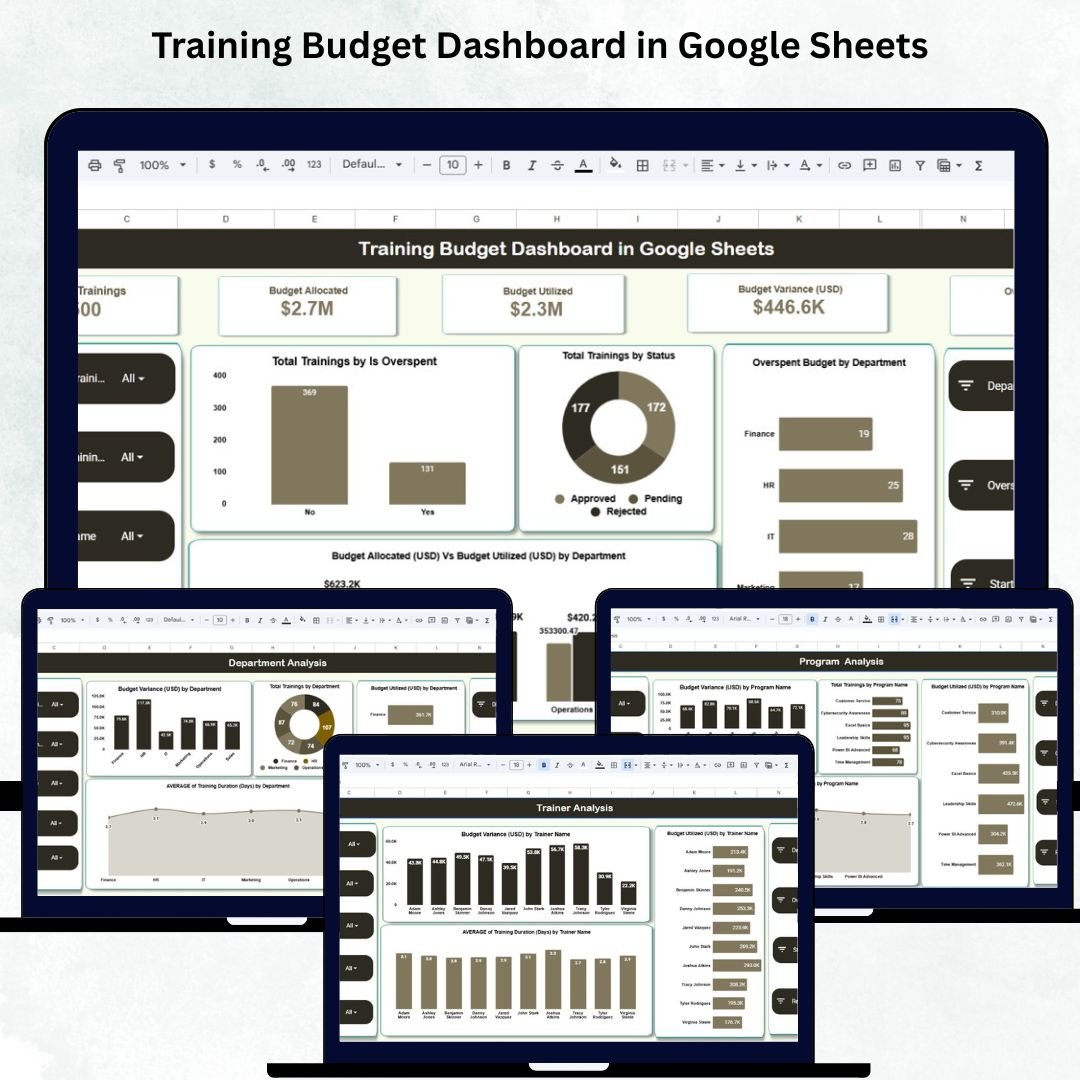
For teams that operate in the cloud and need real-time collaboration, the Training Budget Dashboard in Google Sheets is the ideal pick. Built entirely in Google Sheets, it requires zero coding, zero setup complexity, and works beautifully across devices and browsers.
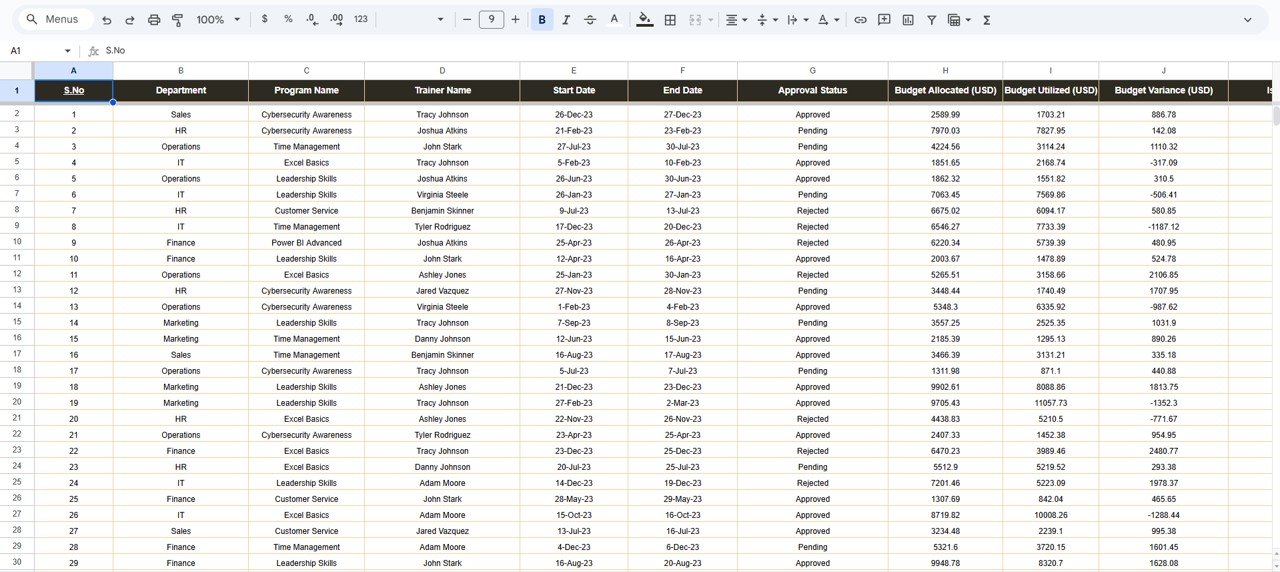
Simply update the Data Sheet, and every chart, KPI card, and metric refreshes automatically — so your entire HR team always has the latest financial picture, even when working from different locations.
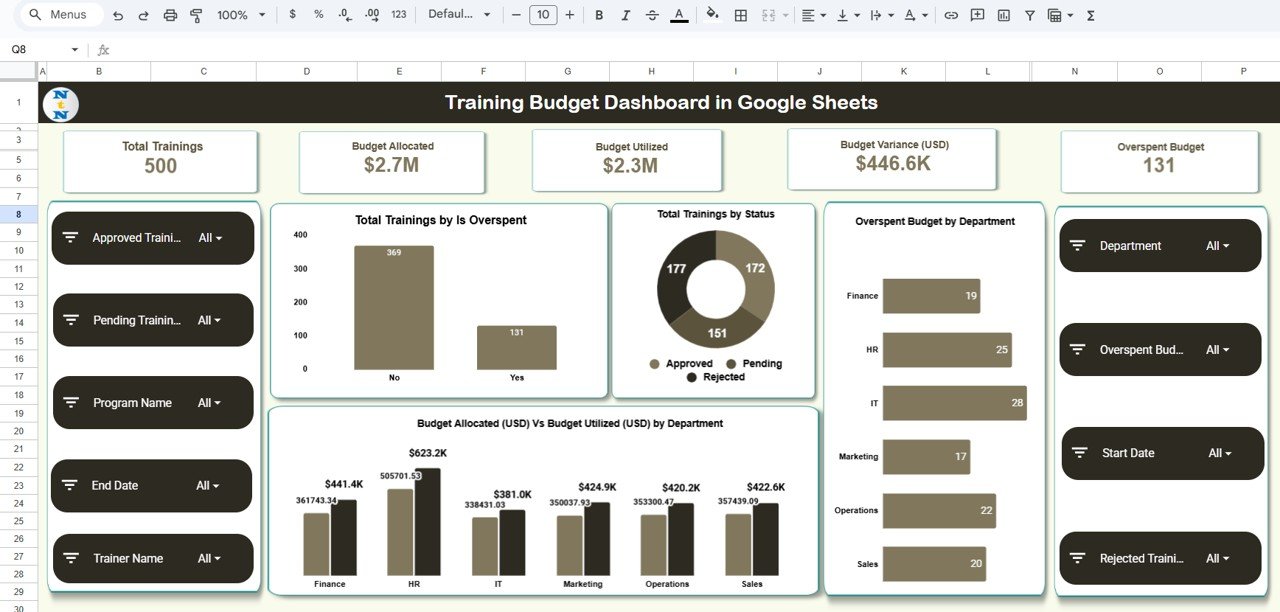
📑 What’s Inside:
- ✅ KPI cards: Total Trainings, Budget Allocated, Utilized, Variance & Overspent Budget
- ✅ Auto-updating charts — refresh instantly as you update data
- ✅ Overspending alerts to flag programs exceeding budget
- ✅ Status-based tracking: Completed, Planned, In Progress & Cancelled
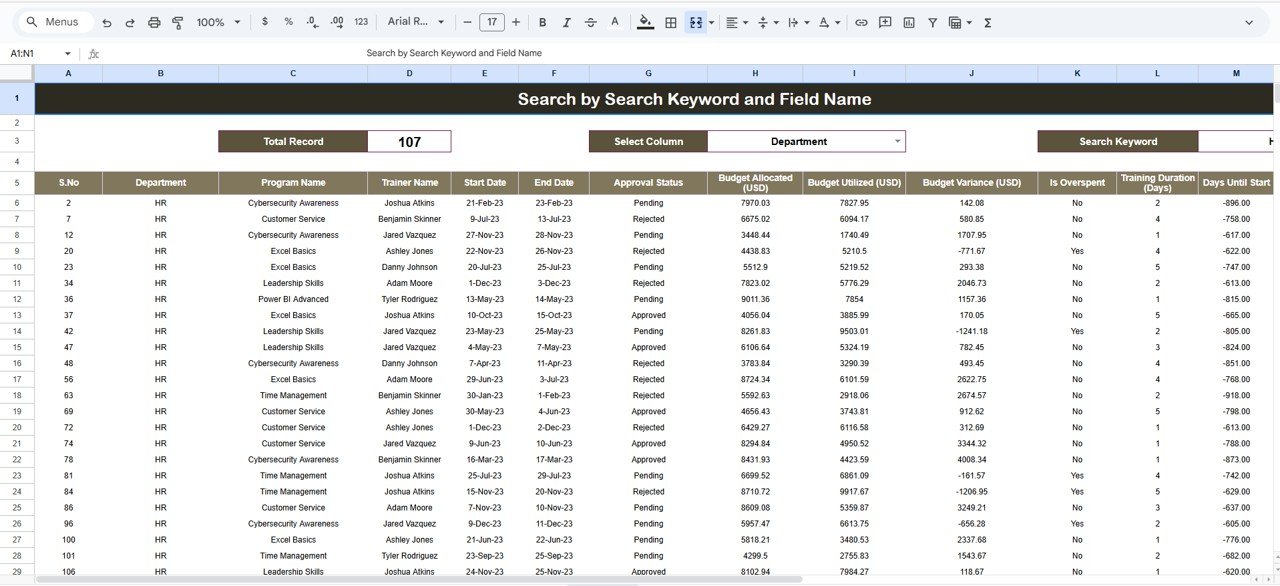
- ✅ Search Tab for instant record lookups without scrolling
- ✅ 100% customizable fields, formulas, and visuals
- ✅ Real-time collaboration — multiple users, one live dashboard
Remote teams, small businesses, HR coordinators, and anyone who needs cloud-based, collaborative training budget tracking from anywhere.
Which Dashboard Is Right for You?
All three cover the same core analytics — your choice simply depends on the tools your team already uses.
| Feature | Excel | Power BI | Google Sheets |
|---|---|---|---|
| Platform | Desktop | Desktop / Web | Cloud / Browser |
| Data Refresh | Manual | Automatic | Automatic |
| Team Collaboration | Limited | Moderate | Excellent |
| Skill Required | Basic Excel | Basic Power BI | Basic Sheets |
| Dashboard Pages | 5 Pages | 5 Pages | 6 Sheets |
| Search / Filter | Slicers | Interactive Slicers | Search Tab + Filters |
| Overspend Alerts | ✅ Visual Charts | ✅ Real-Time Visual | ✅ Dedicated Alert View |
| Price | $14.99 | $17.99 | $14.99 |
| Best For | Offline / Desktop teams | Enterprise analytics | Remote / Cloud teams |
These Dashboards Are Built for You
Whether you manage 10 trainings or 1,000 annually, these tools ensure every dollar is accounted for wisely.