Modern libraries and archives manage far more than books. Today, they handle digital collections, memberships, research archives, events, operational costs, and user engagement simultaneously. However, when data is scattered across multiple spreadsheets, administrators struggle to monitor performance and make timely decisions.
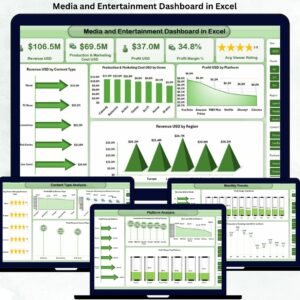
The Libraries and Archives Dashboard in Excel provides a powerful, ready-to-use analytical solution that transforms raw operational data into meaningful insights. Instead of preparing manual reports, library managers can track performance, analyze trends, and improve services using interactive visuals — all within Microsoft Excel.
This dashboard centralizes analytics, automates calculations, and helps institutions make smarter, data-driven decisions while saving valuable reporting time.
⭐ Key Feature of Libraries and Archives Dashboard in Excel
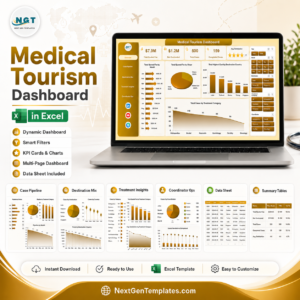
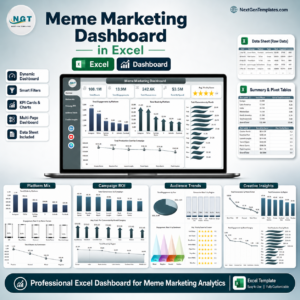
📊 Centralized Library Analytics – Monitor memberships, archives, costs, and engagement in one dashboard.
🧭 Easy Page Navigation – Switch between analysis pages instantly using the built-in navigator.
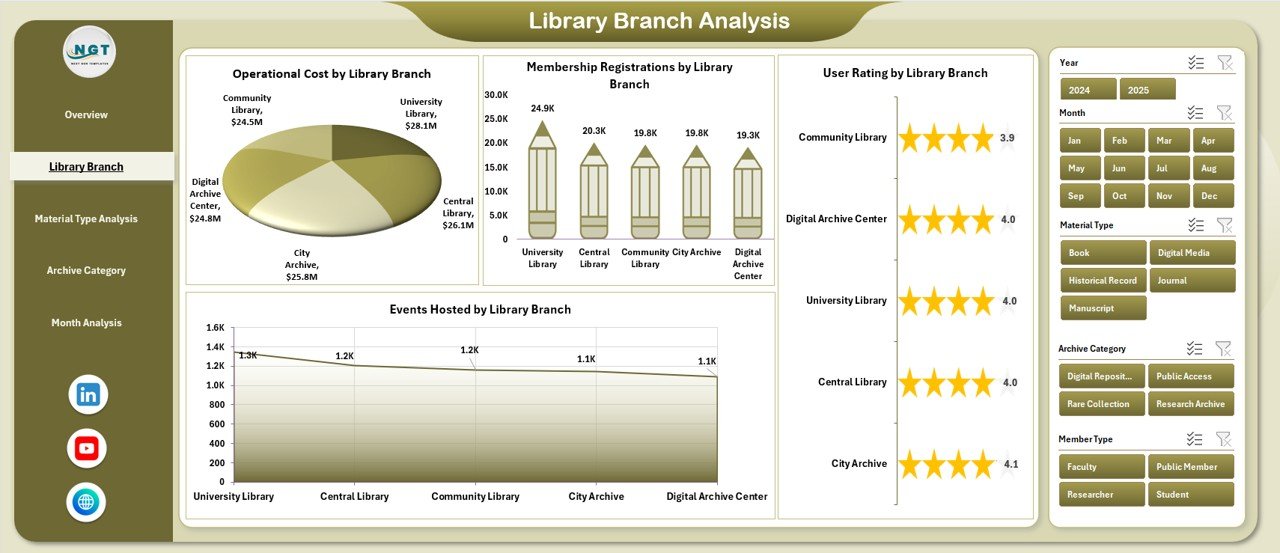
🎯 Interactive Slicers – Filter insights by visit type, branch, material type, archive category, and month.
📈 Visual KPI Cards – Instantly view performance summaries at a glance.
📚 Collection Usage Insights – Identify popular materials and optimize acquisitions.
💰 Operating Cost Monitoring – Track expenses across branches and categories.
📅 Monthly Trend Analysis – Understand seasonal patterns and performance changes.
⚡ Automatic Updates – Dashboard refreshes automatically when data is updated.
📂 What’s Inside the Libraries and Archives Dashboard in Excel
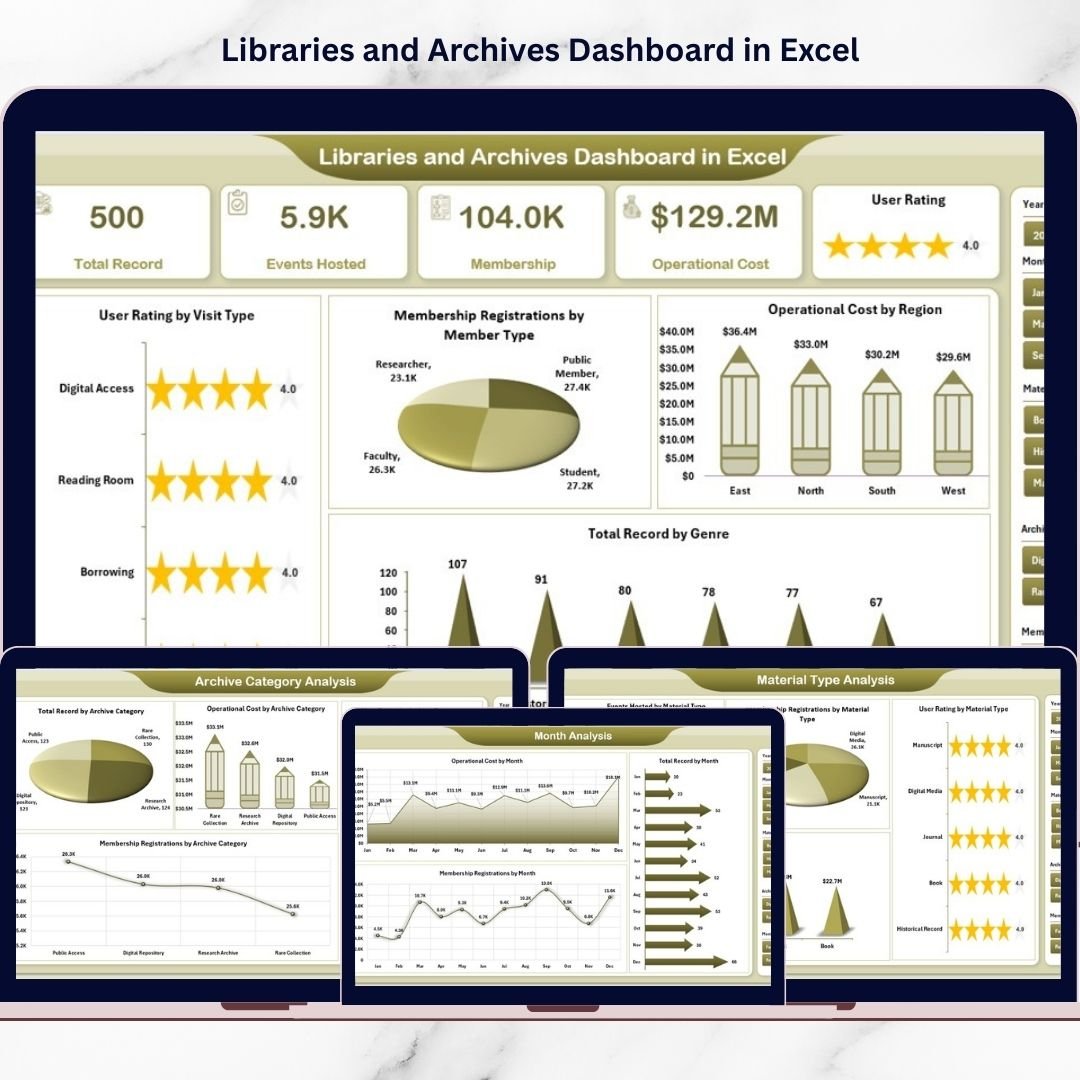
The dashboard includes five analytical pages, each designed to answer key operational questions.
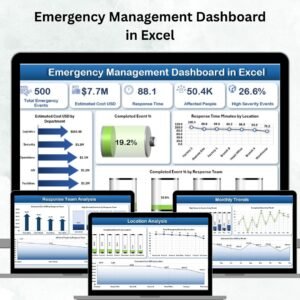
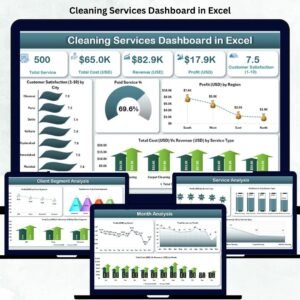
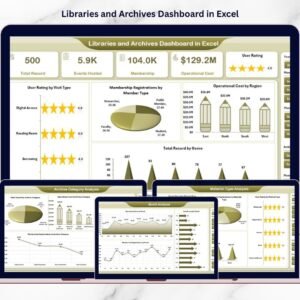
🏠 Overview Page – Overall Library Performance
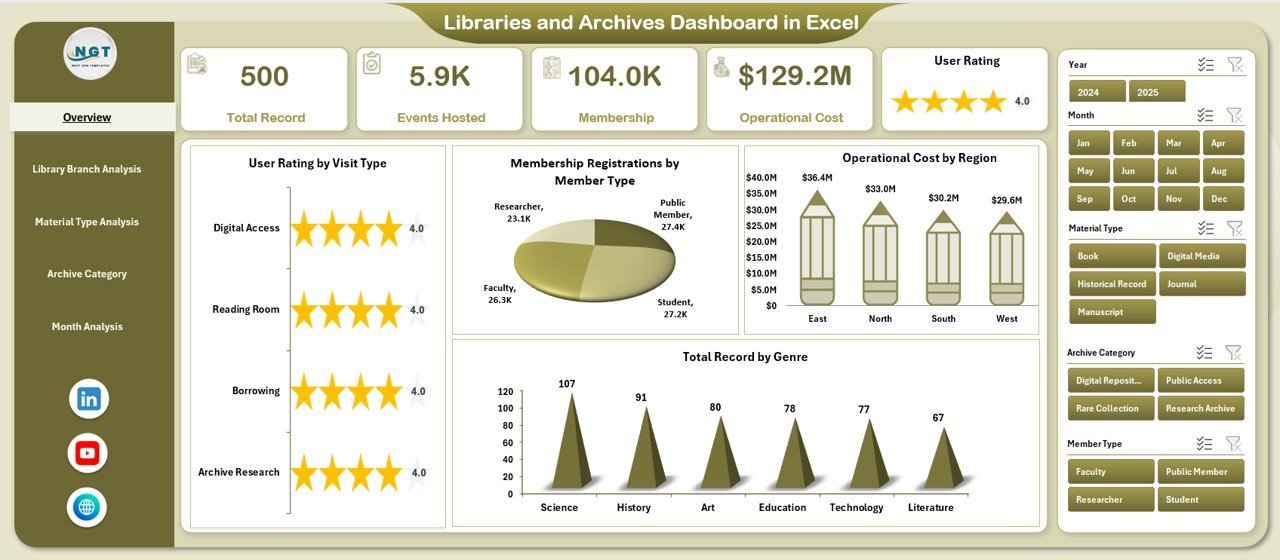
The Overview Page acts as the executive control center.
Key Elements
-
Interactive slicers on the right
-
Four KPI summary cards
-
High-level analytical charts
Charts Included
-
User Rating by Visit Type
-
Membership Registration by Member Type
-
Operating Cost by Region
-
Total Records by Genre
This page provides instant insight into overall library performance and user engagement.
🏢 Library Branch Analysis – Branch Performance Comparison
Designed for multi-branch libraries to evaluate location performance.
Charts Included
-
User Rating by Library Branch
-
Membership Registration by Branch
-
Operating Cost by Branch
-
Events Hosted by Branch
Insights
-
Identify high-performing branches
-
Detect underutilized locations
-
Optimize staffing and budgets
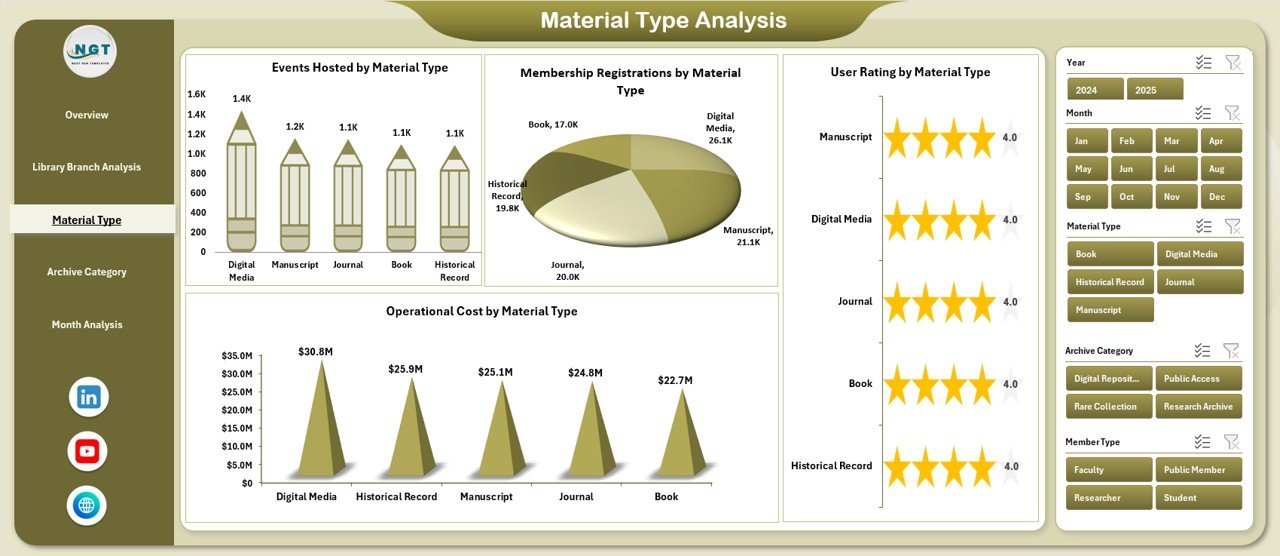
📖 Material Type Analysis – Resource Popularity Insights
Analyzes demand across different resource formats.
Material Types
-
Books
-
Journals
-
Digital Media
-
Manuscripts
-
Audio-Visual Content
Charts Included
-
User Rating by Material Type
-
Membership Registration by Material Type
-
Operating Cost by Material Type
-
Events Hosted by Material Type
Libraries can align investments with user demand effectively.
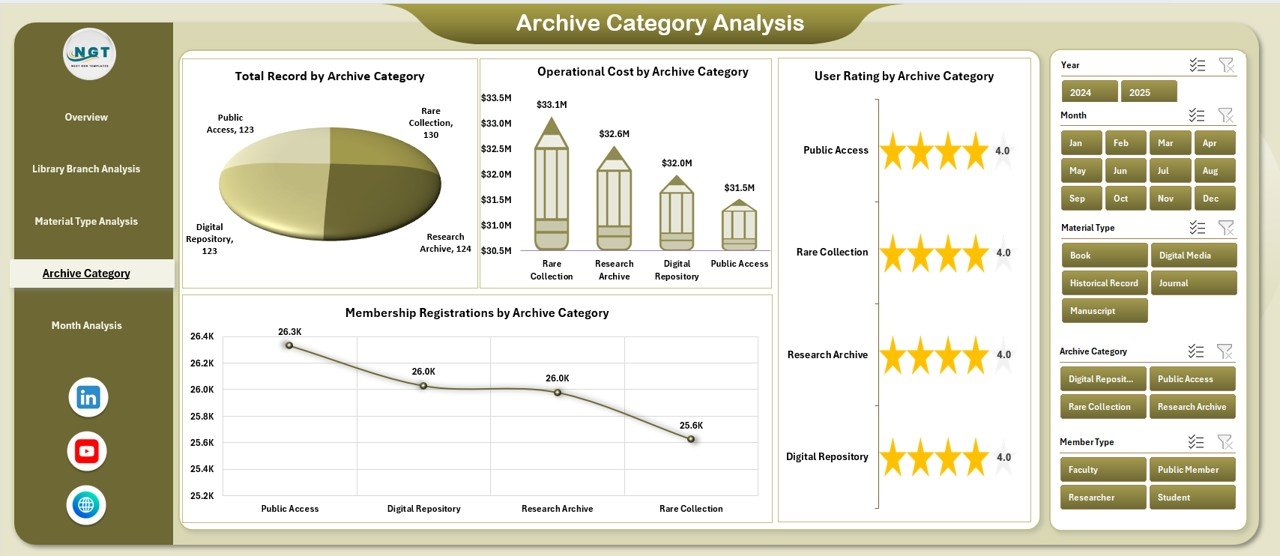
🗂 Archive Category Analysis – Archive Management Performance
Helps archivists monitor preservation and accessibility.
Charts Included
-
User Rating by Archive Category
-
Membership Registration by Archive Category
-
Operating Cost by Archive Category
-
Total Records by Archive Category
Supports digitization planning and preservation prioritization.
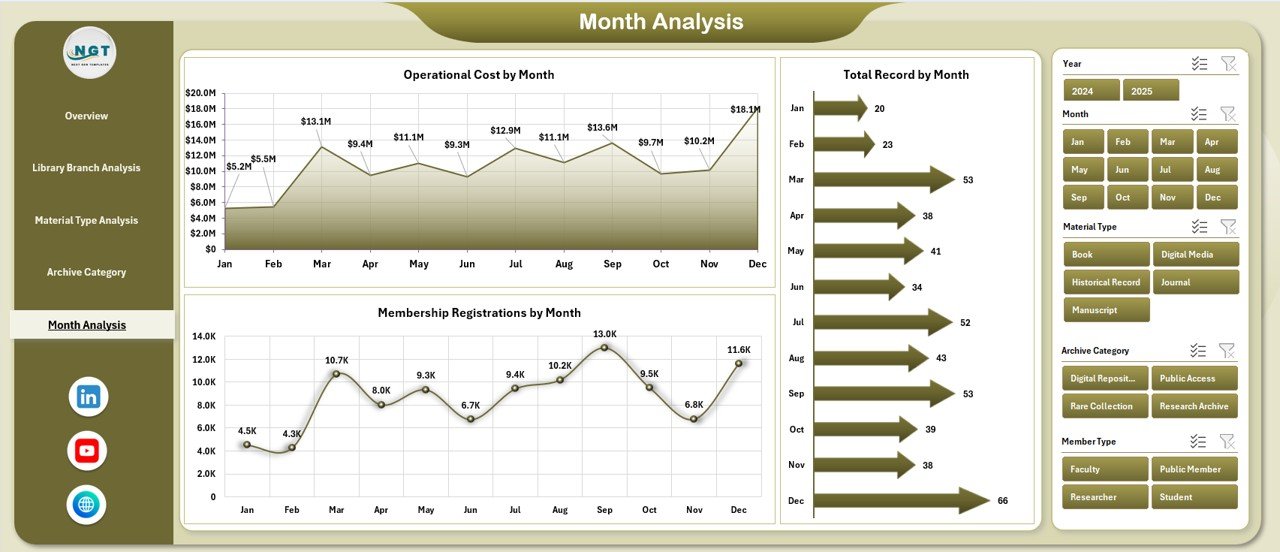
📅 Month Analysis – Trend & Planning Insights
Tracks performance changes over time.
Charts Included
-
Membership Registration by Month
-
Operating Cost by Month
-
Total Records by Month
Helps organizations forecast budgets and plan future initiatives.
🗃 Supporting Sheets
📄 Data Sheet
Stores operational information such as:
-
Visit details
-
Membership records
-
Operating costs
-
Ratings
-
Archive data
Updating this sheet automatically refreshes dashboard visuals.
⚙️ Support Sheet
Handles backend formulas, aggregations, and pivot calculations to maintain accuracy.
🚀 How to Use the Libraries and Archives Dashboard in Excel
1️⃣ Enter operational data into the Data Sheet
2️⃣ Refresh pivot tables if required
3️⃣ Apply slicer filters for analysis
4️⃣ Review insights across pages
5️⃣ Identify trends and improvement areas
6️⃣ Take data-driven operational decisions
👥 Who Can Benefit from This Dashboard
-
Library Administrators
-
Archivists
-
Educational Institutions
-
Government Libraries
-
Research Centers
-
Community Knowledge Centers
Any organization managing collections or archives can use this dashboard efficiently.
✅ Advantages of Libraries and Archives Dashboard in Excel
📊 Improved decision-making through real-time insights
⏱ Significant reporting time savings
📈 Better resource allocation strategies
👥 Enhanced user experience monitoring
💰 Improved cost control visibility
📚 Optimized collection development
🔍 Increased organizational transparency
💡 Best Practices for Maximum Value
-
Maintain standardized data entry formats
-
Update data weekly or monthly
-
Use consistent categories and classifications
-
Review KPIs regularly
-
Train staff on slicer usage
-
Backup dashboard files periodically
🧠 How This Dashboard Improves Library Management
With centralized analytics:
-
Administrators monitor membership growth easily
-
Archivists track collection usage trends
-
Finance teams evaluate operating expenses
-
Event teams analyze participation performance
As a result, libraries shift from manual reporting to proactive service improvement.
🏁 Conclusion
The Libraries and Archives Dashboard in Excel transforms traditional library management into a modern, data-driven system. By combining memberships, operational costs, archive performance, and user satisfaction into one interactive environment, institutions gain complete visibility over operations.
Because Excel remains accessible and flexible, libraries can implement advanced analytics without expensive software investments. Ultimately, this dashboard helps organizations enhance services, optimize resources, and strengthen community impact through smarter decisions.
### Click hare to read the Detailed blog post
Visit our YouTube channel to learn step-by-step video tutorials
👉 Youtube.com/@PKAnExcelExpert