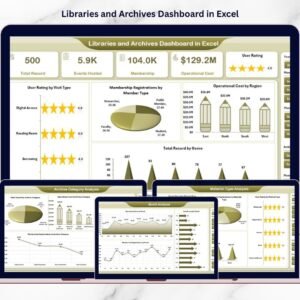
Think tanks play a vital role in shaping public policy, economic strategies, and social development through research, publications, and events. However, managing research outputs, funding performance, regional activities, and policy impact becomes difficult when information is spread across multiple spreadsheets.
The Think Tanks Dashboard in Excel provides a centralized and ready-to-use analytical solution that transforms scattered data into meaningful insights. Instead of compiling reports manually, organizations can monitor research performance, funding efficiency, and policy influence through one interactive dashboard.
This Excel-based system enables leadership teams to analyze performance quickly, improve transparency, and make data-driven strategic decisions.
⭐ Key Feature of Think Tanks Dashboard in Excel
📊 Centralized Research Monitoring – Track publications, events, funding, and impact in one dashboard.
🧭 Interactive Page Navigator – Move easily between analytical pages.
🎯 Dynamic Slicer Filters – Analyze data by region, country, research area, funding score, and time period.
📈 Visual KPI Insights – Instantly understand performance using charts and KPI cards.
💰 Funding Performance Analysis – Evaluate financial efficiency and research outcomes.
🌍 Regional Performance Tracking – Compare impact across geographic locations.
📅 Monthly Trend Analysis – Monitor activity and policy influence over time.
⚡ Automatic Dashboard Updates – Visuals refresh instantly after data updates.
📂 What’s Inside the Think Tanks Dashboard in Excel
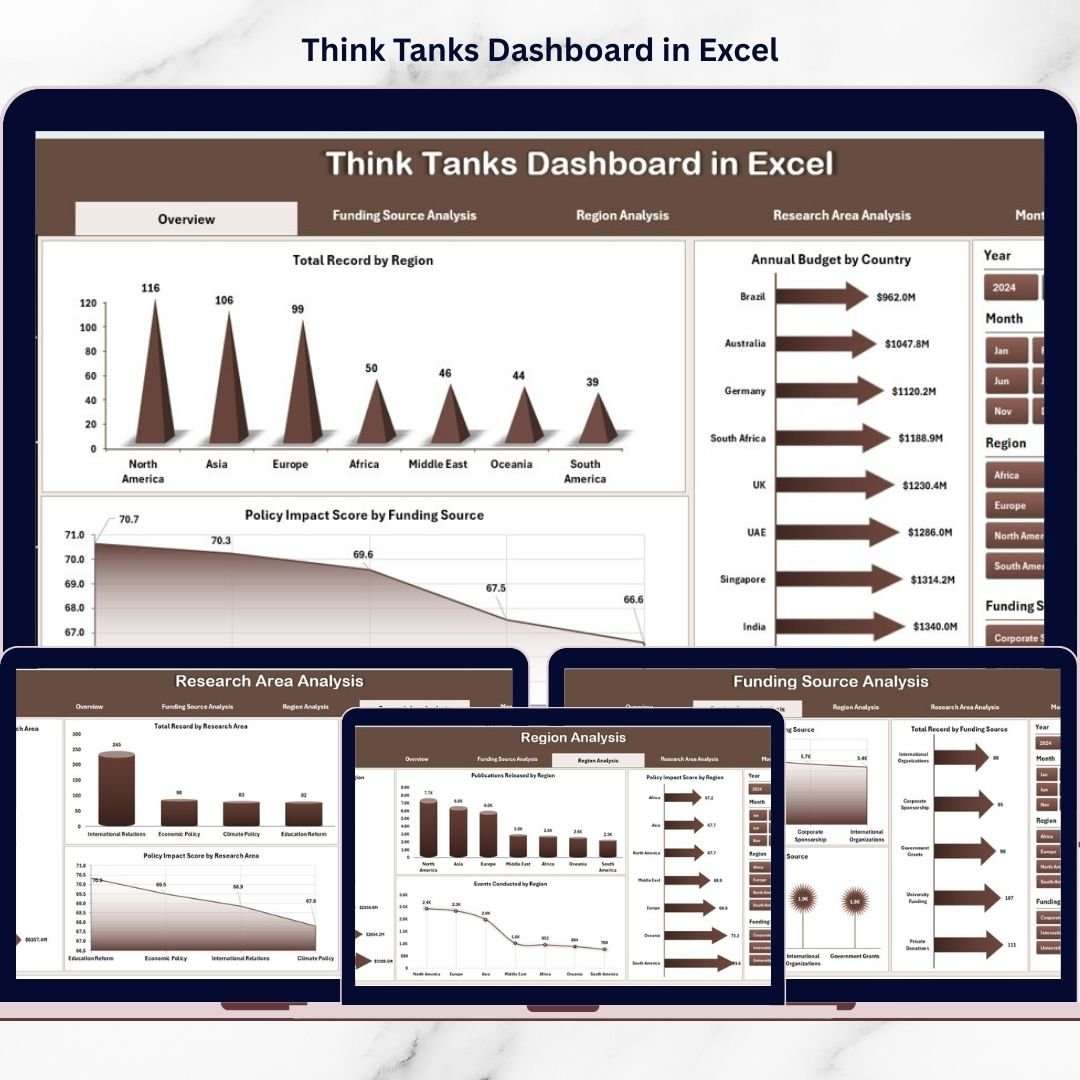
The dashboard contains five analytical pages, each designed to provide a specific level of insight.
🏠 Overview Page – Central Performance Hub
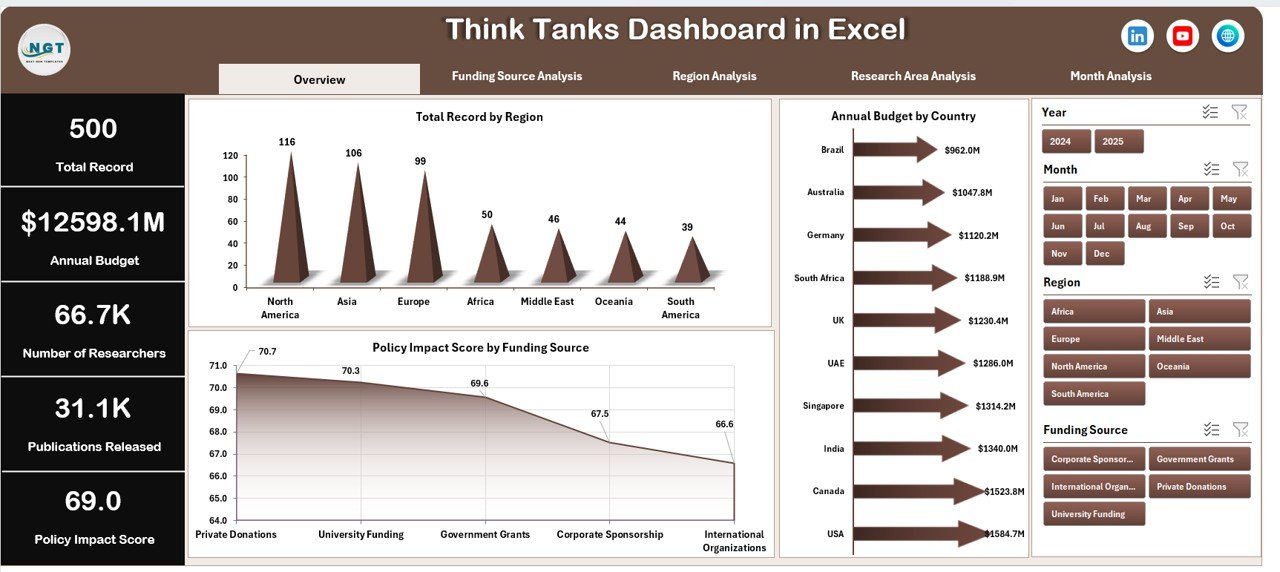
The main executive view providing a snapshot of organizational performance.
Key Elements
-
Interactive slicers
-
Four KPI summary cards
-
High-level analytical charts
Charts Included
-
Total Records by Region
-
Annual Budget by Country
-
Policy Impact Score by Funding Score
This page helps leadership understand overall performance within seconds.
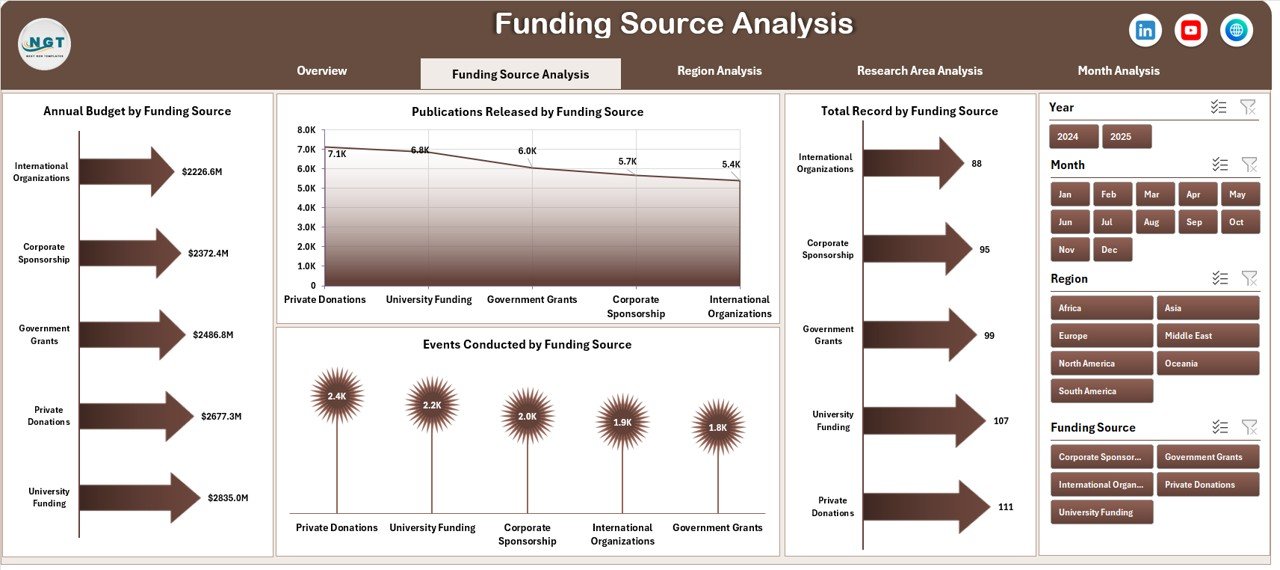
💰 Funding Source Analysis – Financial Impact Insights
Evaluates how funding influences research output.
Charts Included
-
Total Records by Funding Score
-
Annual Budget by Funding Score
-
Publications Released by Funding Score
-
Events Conducted by Funding Score
Insights
-
Funding efficiency evaluation
-
Budget optimization opportunities
-
Research productivity comparison
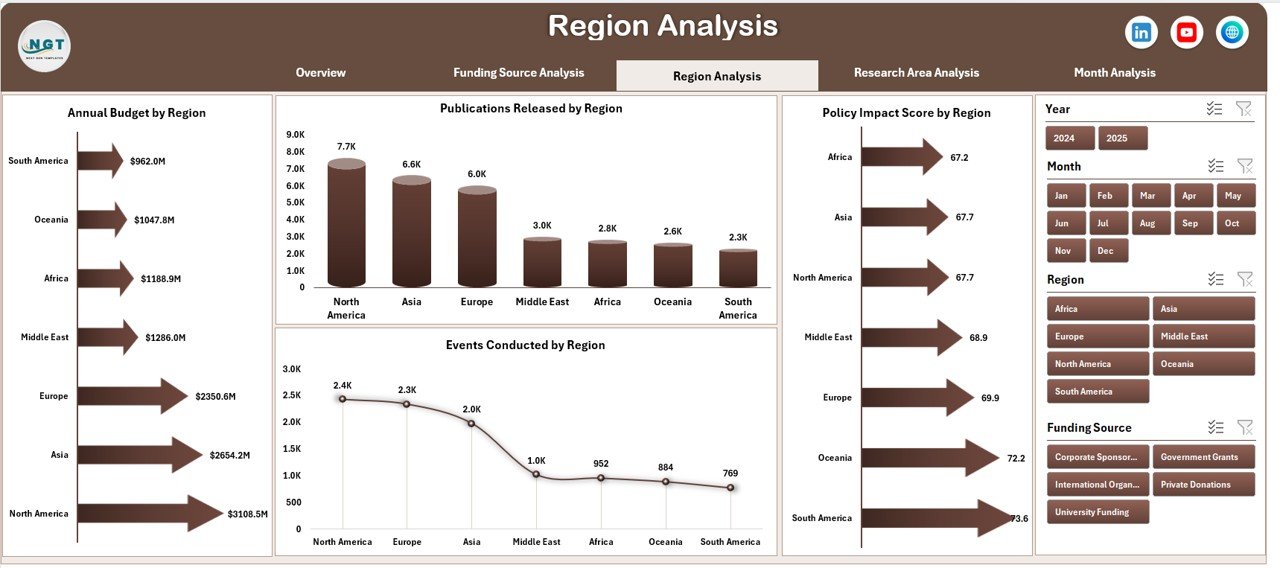
🌍 Region Analysis – Geographic Performance Monitoring
Compares research effectiveness across locations.
Charts Included
-
Annual Budget by Region
-
Publications Released by Region
-
Events Conducted by Region
-
Policy Impact Score by Region
Organizations identify strong regions and optimize resource allocation.
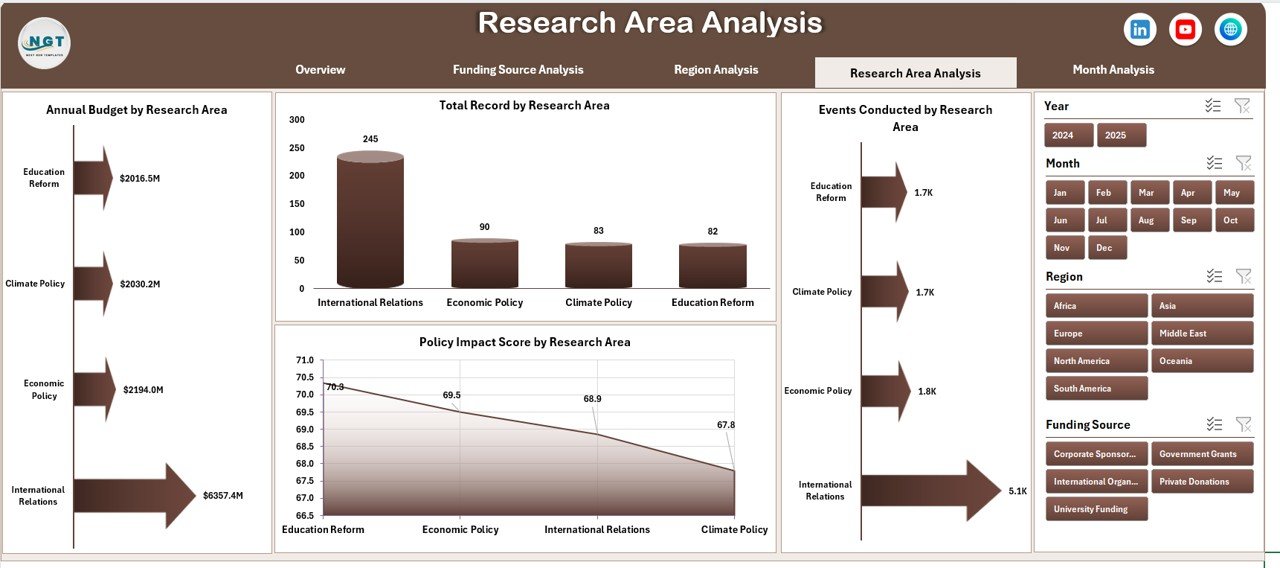
📚 Research Area Analysis – Knowledge Domain Evaluation
Analyzes performance across research topics.
Charts Included
-
Annual Budget by Research Area
-
Total Records by Research Area
-
Events Conducted by Research Area
-
Policy Impact Score by Research Area
Helps leadership prioritize high-impact research areas.
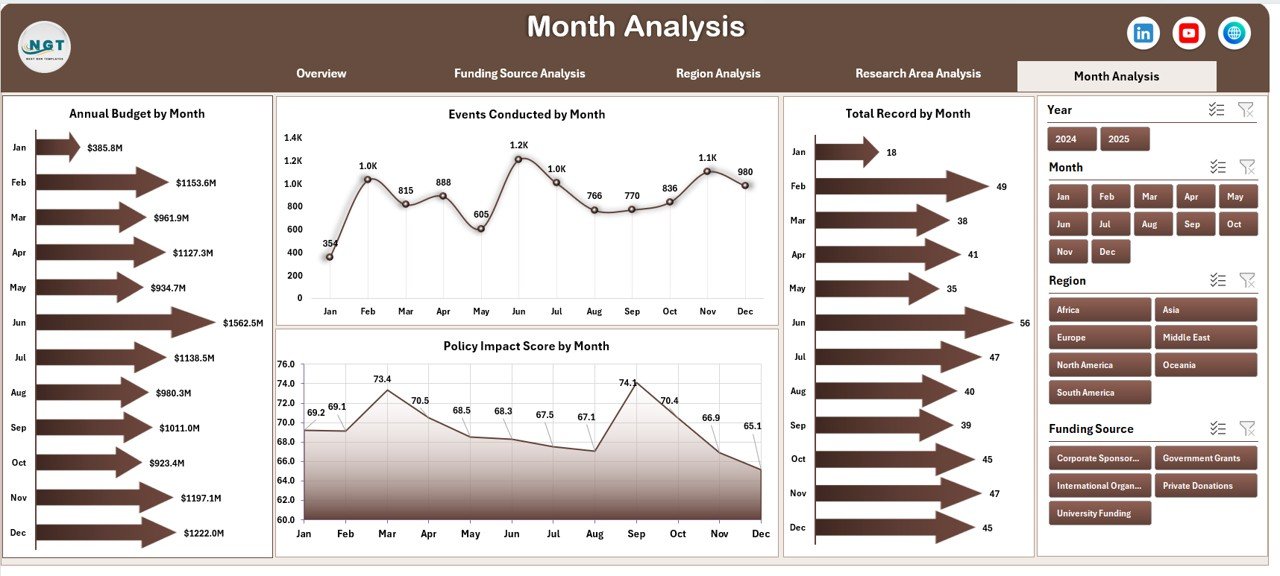
📆 Month Analysis – Performance Trend Tracking
Tracks activity and impact over time.
Charts Included
-
Annual Budget by Month
-
Total Records by Month
-
Events Conducted by Month
-
Policy Impact Score by Month
Supports forecasting and long-term planning decisions.
🗂️ Supporting Sheets
📄 Data Sheet
Primary data entry area including:
-
Region
-
Country
-
Funding Score
-
Research Area
-
Annual Budget
-
Publications Released
-
Events Conducted
-
Policy Impact Score
-
Month & Year
Dashboard visuals update automatically after data entry.
⚙️ Support Sheet
Handles backend calculations, pivot tables, and formulas to ensure accurate analytics.
🚀 How to Use the Think Tanks Dashboard in Excel
1️⃣ Prepare standardized research data
2️⃣ Enter records into the Data Sheet
3️⃣ Apply slicer filters for analysis
4️⃣ Review insights across analytical pages
5️⃣ Identify trends and improvement areas
6️⃣ Take strategic actions based on insights
📊 Insights You Can Extract
Operational Insights
-
Research productivity tracking
-
Publication performance analysis
-
Event effectiveness monitoring
Financial Insights
-
Budget utilization efficiency
-
Funding impact evaluation
-
Resource optimization opportunities
Strategic Insights
-
Policy influence measurement
-
Research prioritization decisions
-
Regional expansion planning
✅ Advantages of Think Tanks Dashboard in Excel
✔ Centralized performance monitoring
✔ Faster executive decision-making
✔ Improved funding allocation
✔ Clear performance visualization
✔ Dynamic filtering and analysis
✔ Cost-effective analytics solution
✔ Easy collaboration across teams
👥 Who Can Benefit from This Dashboard
-
Policy Research Organizations
-
Non-Profit Institutions
-
Government Research Bodies
-
Academic Research Centers
-
International Development Agencies
-
Strategy and Policy Analysts
Any research-driven organization can use this dashboard effectively.
💡 Best Practices for Maximum Value
-
Maintain clean and standardized data
-
Update records monthly
-
Use consistent KPI definitions
-
Keep visuals simple and readable
-
Protect backend sheets from edits
-
Review trends regularly for planning
🧠 How This Dashboard Improves Decision-Making
When leadership views consolidated insights:
-
High funding with low impact becomes visible immediately
-
High-performing research areas receive more investment
-
Regional inefficiencies are identified quickly
-
Monthly performance trends guide planning
Therefore, organizations shift from reactive reporting to proactive strategy.
🏁 Conclusion
The Think Tanks Dashboard in Excel provides a powerful yet simple platform for monitoring research activities, funding efficiency, and policy impact. Instead of managing fragmented spreadsheets, organizations gain a unified analytical environment that supports faster and smarter decisions.
With interactive slicers, structured analytical pages, and automated visuals, leadership can focus more on research impact and less on report preparation.
Ultimately, this dashboard converts data into actionable intelligence — empowering think tanks to strengthen influence, transparency, and strategic outcomes.
### Click hare to read the Detailed blog post
Visit our YouTube channel to learn step-by-step video tutorials
👉 Youtube.com/@PKAnExcelExpert