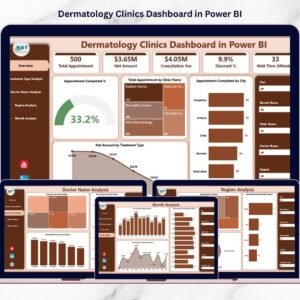
In today’s fast-moving healthcare environment, dermatology clinics must rely on data to stay competitive. However, many clinics still depend on scattered spreadsheets and manual reports. As a result, decision-makers struggle to track appointments, revenue, doctor performance, and treatment trends in one unified view.
That’s exactly why we created the Dermatology Clinics Dashboard in Power BI — a powerful, ready-to-use business intelligence solution built specifically for modern dermatology practices.
This interactive dashboard transforms raw clinic data into clear, actionable insights. With dynamic slicers, executive KPI cards, and professional visuals, clinic owners and managers can instantly monitor performance and identify improvement opportunities. Consequently, your clinic gains real-time visibility, faster analysis, and smarter decision-making.
Whether you manage a single clinic or a multi-location dermatology network, this dashboard gives you the clarity and control needed to grow confidently.
🔑 Key Feature of Dermatology Clinics Dashboard in Power BI
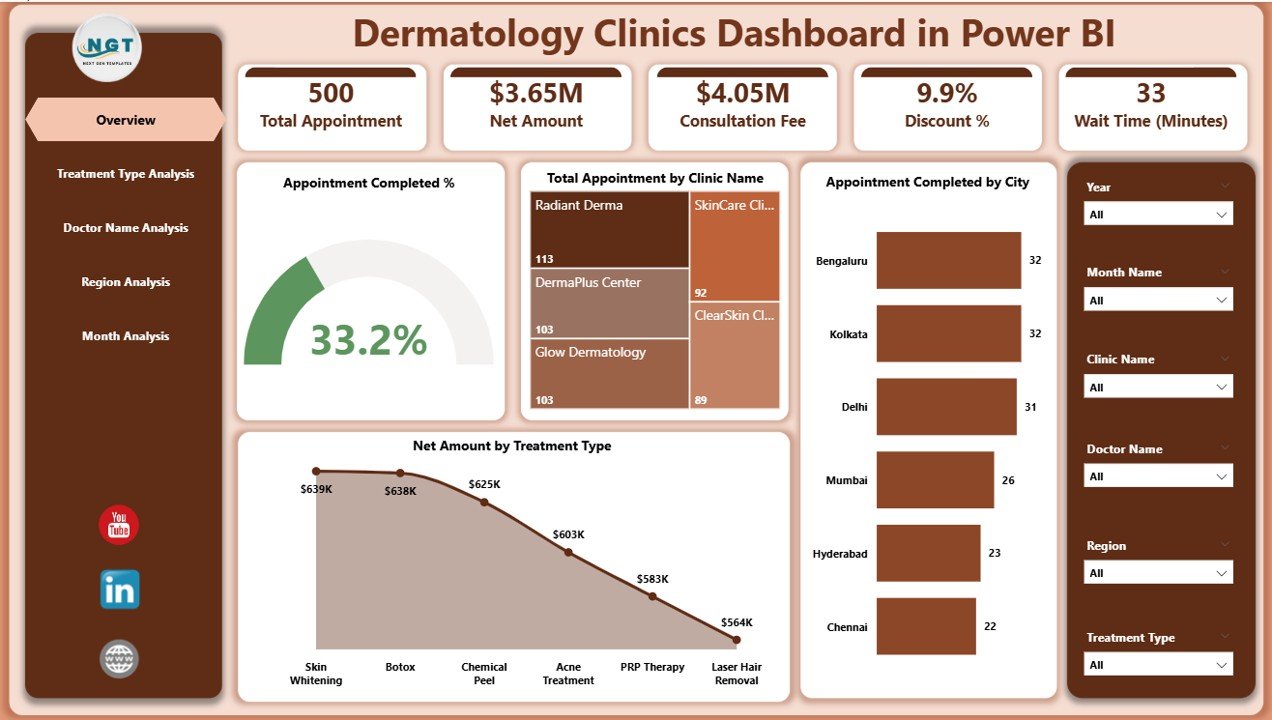
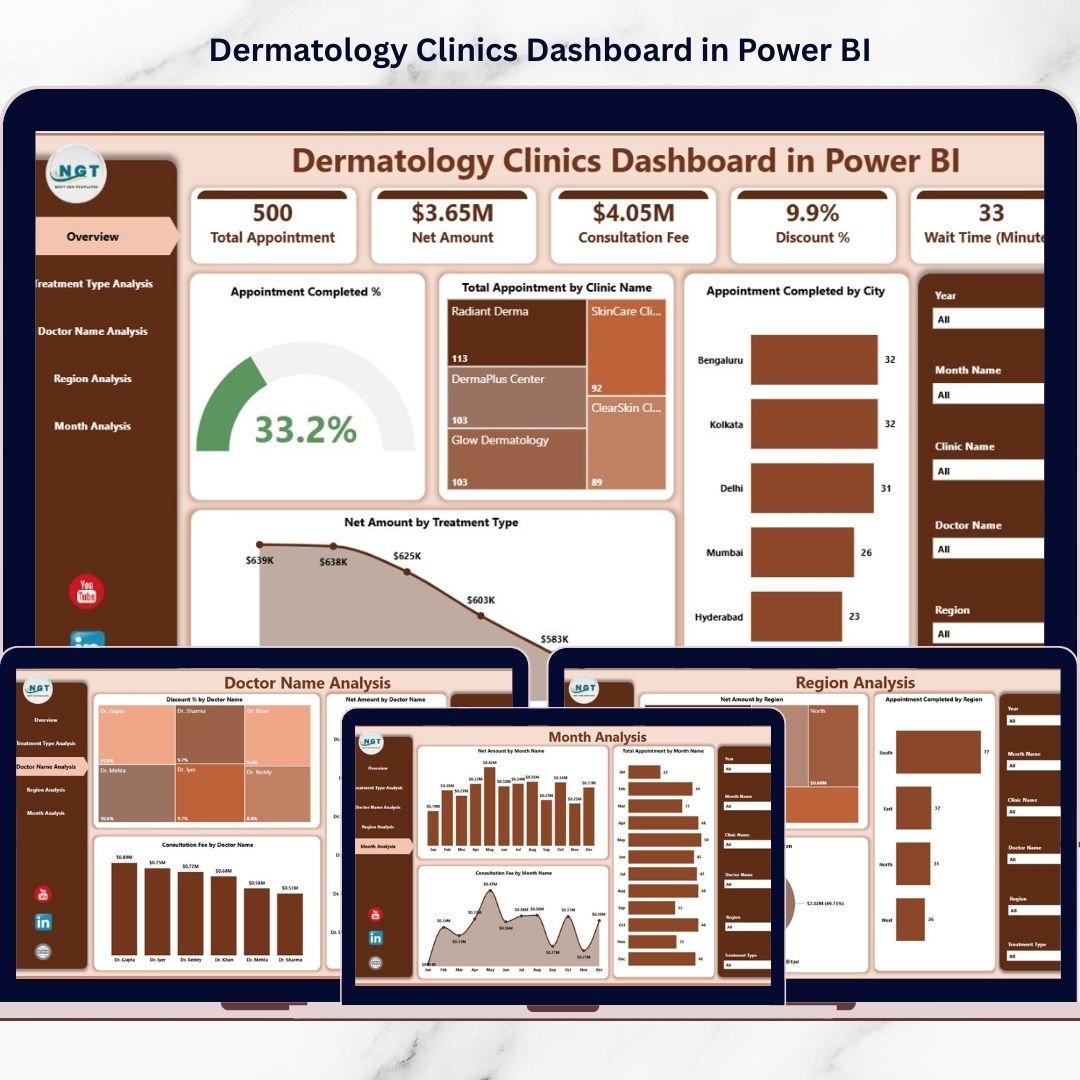
✨ Executive Overview Command Center
Get an instant snapshot of clinic performance with high-impact KPI cards.
📊 Interactive Smart Slicers
Filter by city, region, treatment type, and month for real-time insights.
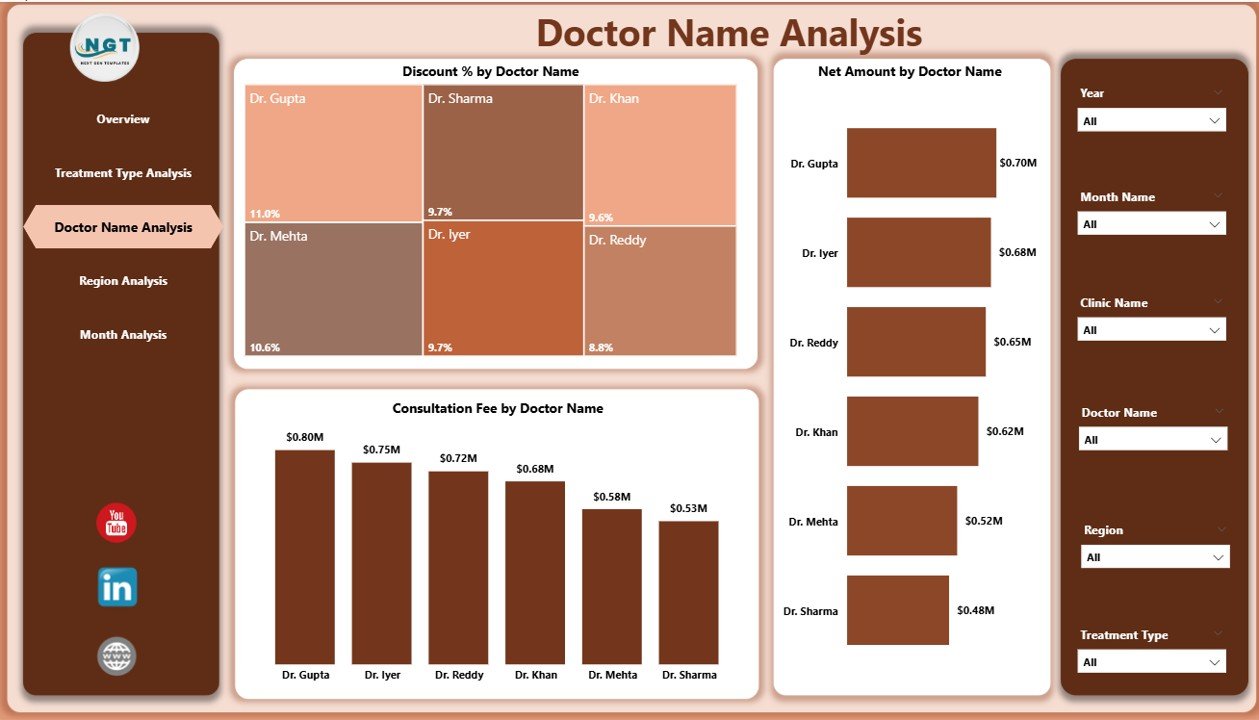
👨⚕️ Doctor Performance Intelligence
Evaluate revenue, discounts, and productivity by doctor.
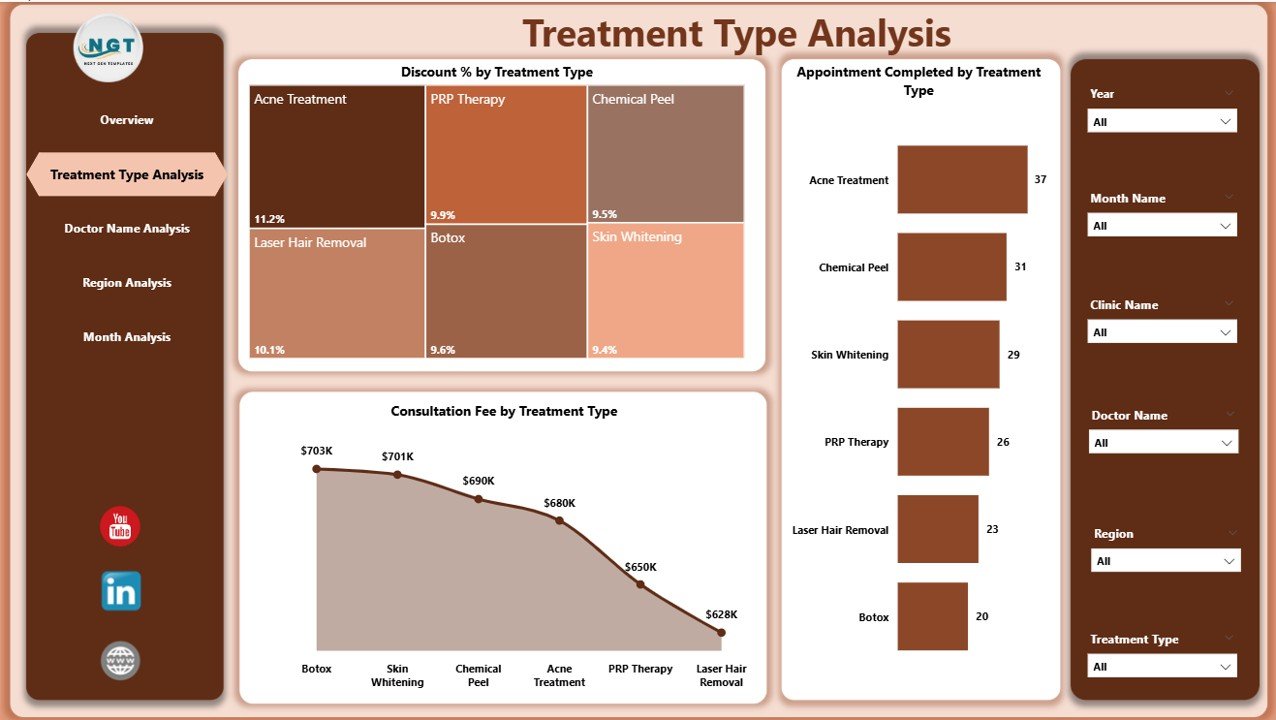
🔬 Treatment-Level Analytics
Identify high-demand and high-profit procedures quickly.
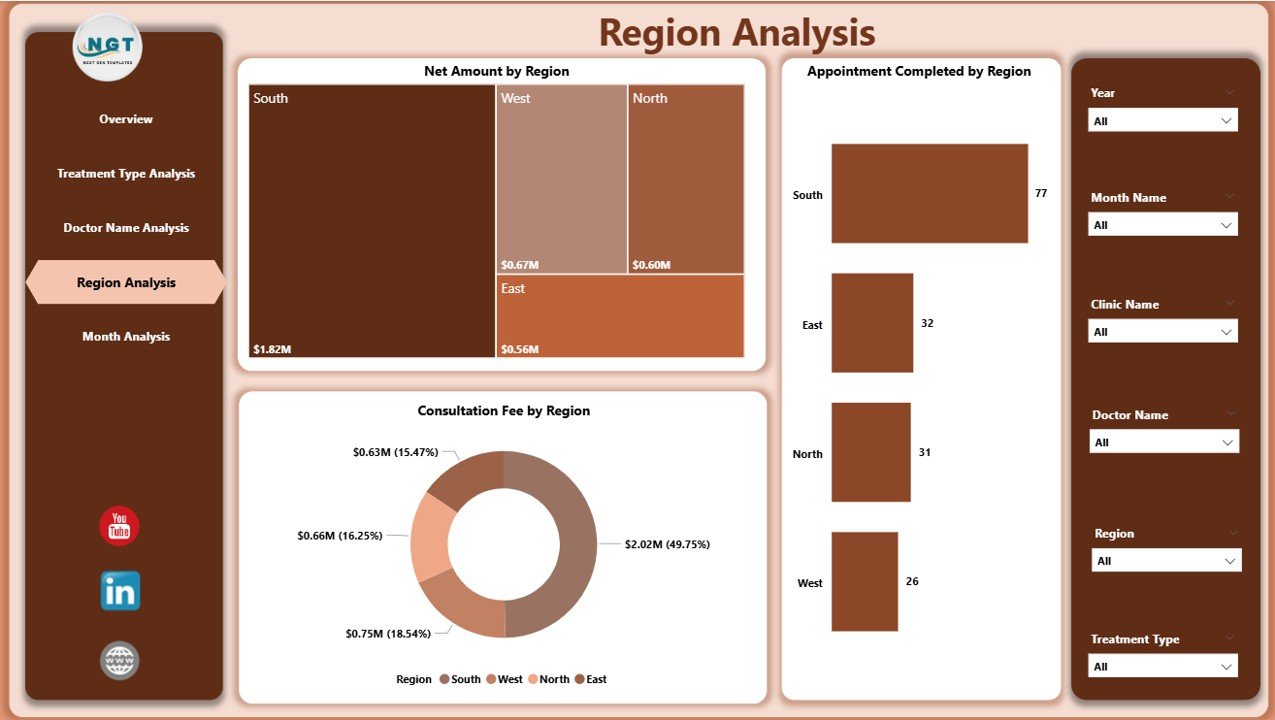
🌍 Regional Performance Visibility
Compare geographic trends and detect growth opportunities.
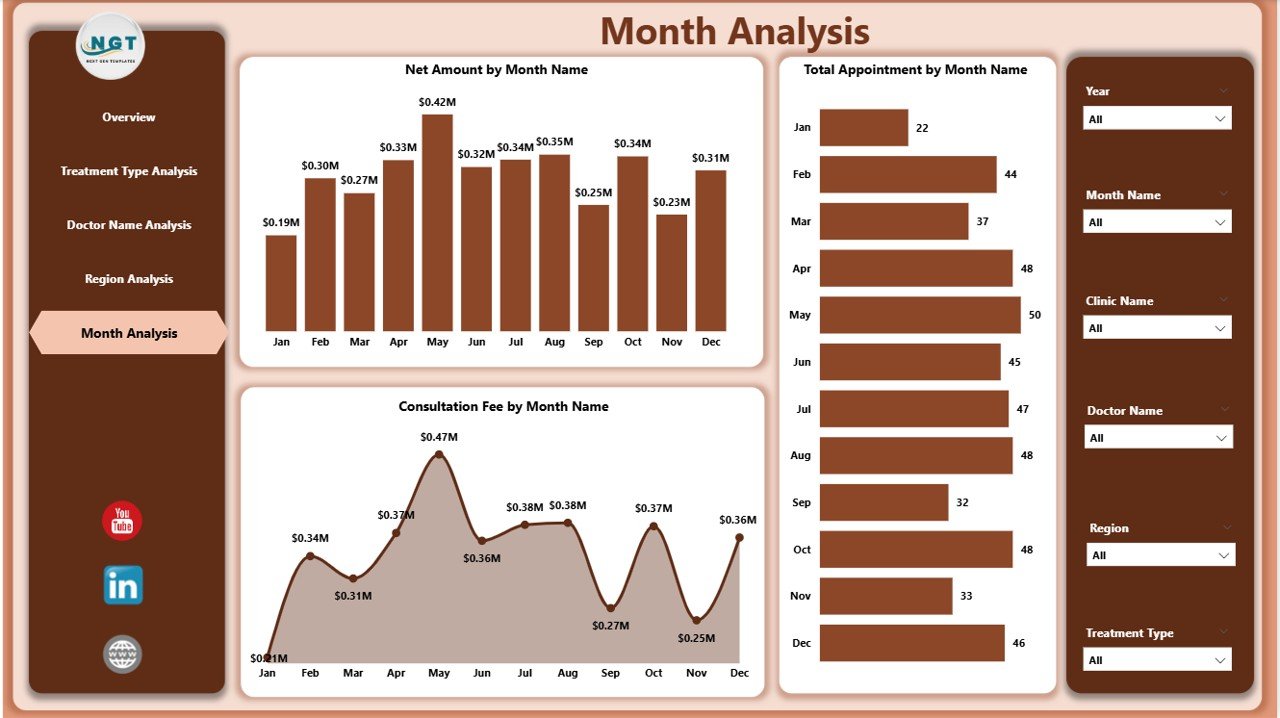
📅 Monthly Trend Monitoring
Track appointment volume and revenue seasonality over time.
⚡ High-Performance Power BI Model
Handles large healthcare datasets smoothly.
🎯 Executive-Ready Visual Design
Professional dashboard perfect for leadership reviews.
📦 What’s Inside the Dermatology Clinics Dashboard in Power BI
This product delivers a complete, ready-to-use analytics solution.
✔️ Power BI Desktop File (.pbix)
✔️ 5 Fully Interactive Analytical Pages
✔️ Dynamic KPI Cards
✔️ Advanced Slicers for Filtering
✔️ Clean and Structured Data Model
✔️ Interactive Visual Reports
✔️ Easy Data Refresh Setup
Everything is pre-configured so you can start analyzing immediately.
🛠️ How to Use the Dermatology Clinics Dashboard in Power BI
Getting started is quick and beginner-friendly.
Step 1: Download and open the PBIX file
Step 2: Connect or replace with your clinic dataset
Step 3: Refresh the data model
Step 4: Use slicers to filter insights
Step 5: Review dashboards for decision-making
Within minutes, your clinic will have a powerful analytics command center.
🎯 Who Can Benefit from This Dermatology Clinics Dashboard in Power BI
This dashboard is ideal for healthcare organizations seeking data-driven control.
✅ Dermatology Clinic Owners
✅ Healthcare Administrators
✅ Clinic Operations Managers
✅ Financial Analysts
✅ Medical Practice Consultants
✅ Multi-Clinic Networks
If your clinic wants better performance visibility and stronger revenue control, this tool is essential.
Why This Dashboard Is a Game-Changer
Unlike manual reporting methods, this dashboard provides:
✔️ Real-time clinic visibility
✔️ Automated KPI tracking
✔️ Doctor productivity insights
✔️ Treatment profitability analysis
✔️ Regional comparison
✔️ Faster executive reporting
As a result, your clinic shifts from reactive management to proactive growth.
### Click hare to read the Detailed blog post
📺 Visit our YouTube channel to learn step-by-step video tutorials
👉 Youtube.com/@PKAnExcelExpert