In the fast-paced world of apparel manufacturing, time wasted searching through spreadsheets means opportunities lost. As competition intensifies and customer expectations rise, data-driven decision-making isn’t just an advantage — it’s a necessity.
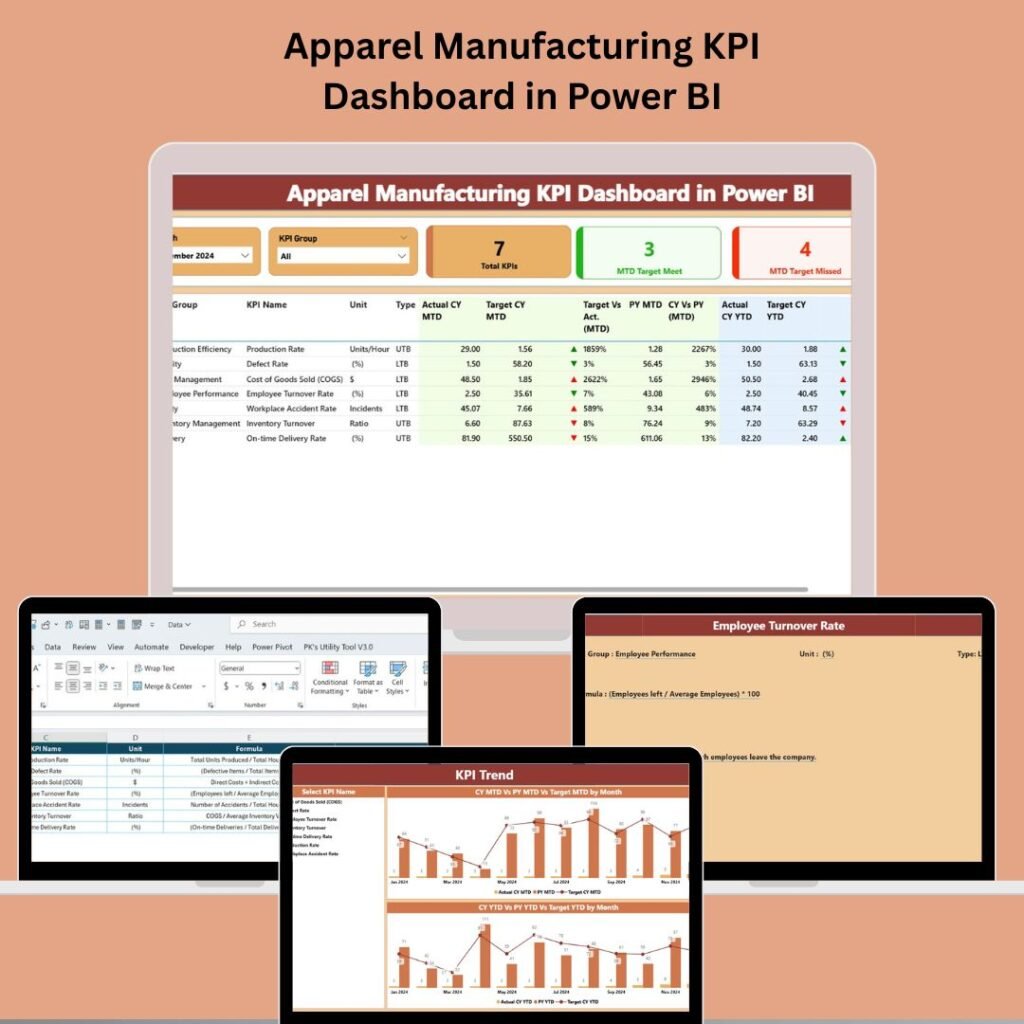
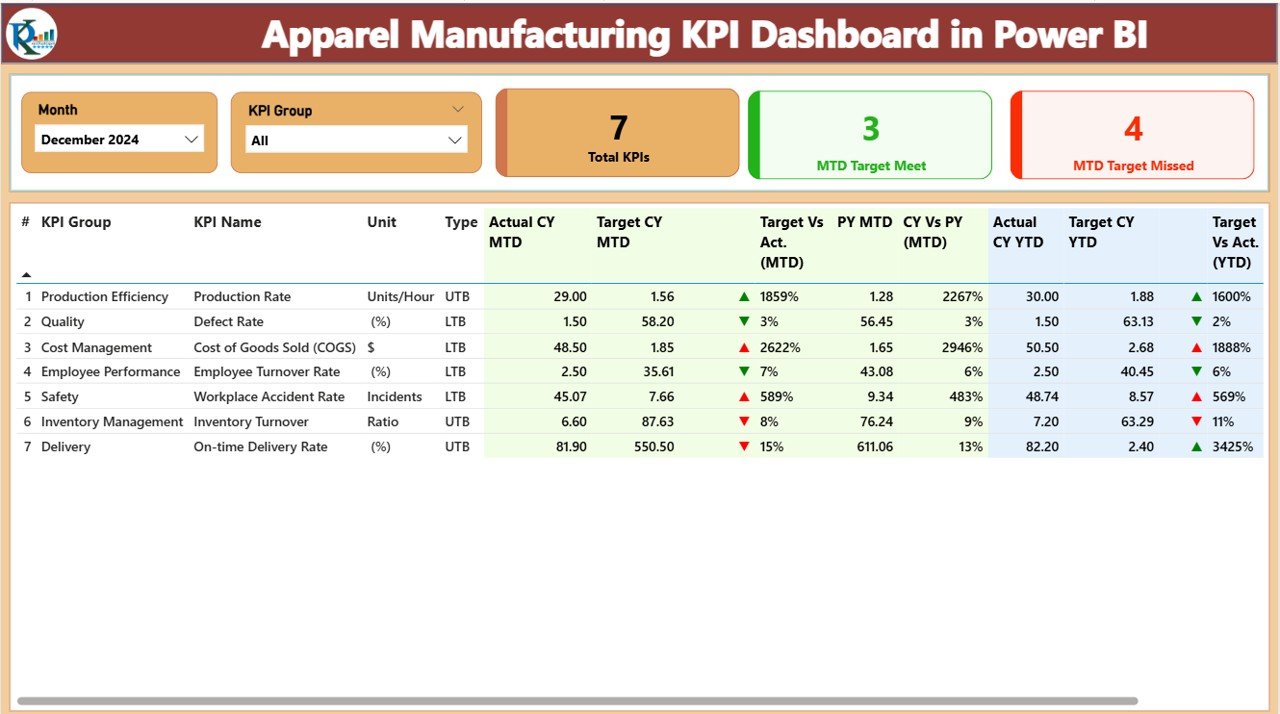
Imagine having all your key performance metrics visualized in one place — tracking production efficiency, machine utilization, defects, labor productivity, and financial performance — updated in real time. That’s exactly what the Apparel Manufacturing KPI Dashboard in Power BI delivers.
Unlike basic reporting tools, this dashboard turns raw manufacturing data into meaningful insights without overwhelming your team. Whether you’re a plant manager, operations head, or business owner, this solution helps you see the big picture — and the small details — at a glance.
What Is the Apparel Manufacturing KPI Dashboard in Power BI?
The Apparel Manufacturing KPI Dashboard in Power BI is a ready-to-use analytics template designed specifically for apparel and garment factories. Built on Microsoft Power BI, this dashboard brings together essential metrics and visualizations that guide strategic decisions and daily operational improvements.
Instead of spending weeks building reports from scratch (and constantly updating them), you can plug this dashboard into your data and have meaningful visuals ready in minutes.
🎯 Key Features That Make It a Must-Have for Apparel Manufacturers
Here’s what sets this dashboard apart:
📊 1. Comprehensive Production Performance Tracking
-
Daily, weekly, and monthly productivity analysis
-
Real-time comparison of planned vs actual outputs
-
Drill-downs of performance by line, shift, and product type
These views help you pinpoint bottlenecks before they become costly.
⚙️ 2. Machine & Line Utilization Metrics
-
Visuals showing uptime vs downtime
-
Line-level capacity utilization percentages
-
Trends highlighting underperforming equipment
Use these insights to optimize workflows and reduce idle time.
🧑🏭 3. Labor Efficiency & Workforce Analytics
-
Labor productivity rates
-
Operator performance comparisons
-
Cost per unit labor tracking
Empower HR and floor supervisors with data-backed performance management.
🪡 4. Quality Control & Defects Monitoring
-
Defect rate graphs
-
Breakdown of defect types by stage
-
Root cause alerts
Reduce rework and wastage by acting on trends, not guesses.
📦 5. Inventory & Supply Chain Visibility
-
Raw material consumption vs plan
-
Inventory turnover rates
-
Stock-to-sales ratios
Streamline your supply chain with better visibility and fewer surprises.
📉 6. Financial KPI Insights
-
Cost per unit analysis
-
Gross margin trends
-
Budget vs actual variances
Make smarter pricing, costing, and procurement decisions.
🔄 7. Powerful Drill-Down & Filtering Options
Allow managers to filter by products, lines, regions, and time periods with just a click. No more exporting huge Excel files.
This data flexibility ensures that every manager’s question can find an answer — fast.
🧠 How It Works: Plug, Analyze, Improve
The strength of the Apparel Manufacturing KPI Dashboard in Power BI lies in its simplicity and power:
-
Connect Your Data:
Import data from Excel, CSV, SQL, or other systems into Power BI. -
Automated Visual Insights:
The dashboard instantly visualizes your data — no coding or DAX expertise required. -
Customize for Your Factory:
Tailor views, add filters, and set benchmarks that align with your business goals. -
Act on What You See:
Use trends and alerts to reduce bottlenecks, boost throughput, and improve margins.
📌 Why Power BI Is the Ideal Platform for Apparel KPI Dashboards
Power BI is more than a reporting tool — it’s a complete business intelligence system that turns data into decisions:
✔ Real-time data refresh
✔ Interactive visuals
✔ Secure sharing across teams
✔ Scalability from small shops to large enterprises
✔ Integration with Excel, SQL, Azure, and other systems
This means your dashboard grows with your business — and you never outgrow your insights.
🎯 Typical Use Cases in Apparel Manufacturing
Here’s how different roles benefit from this dashboard:
🧑💼 Plant Managers
Keep production lines humming by identifying:
-
Lines with the most downtime
-
Shifts with peak productivity
-
Areas needing workforce reallocation
📊 Operations Executives
Evaluate:
-
Efficiency trends over time
-
Budget vs actual performance
-
KPI scorecards for monthly reviews
🧵 Quality Assurance Teams
Monitor defect patterns and:
-
Track quality improvement initiatives
-
Reduce customer returns
-
Lower waste levels
📈 Business Owners
Make informed strategic decisions using:
-
Margin and cost metrics
-
Production forecasts
-
Inventory performance data
🚀 Real Benefits You Can Expect
Adopting the Apparel Manufacturing KPI Dashboard in Power BI leads to measurable improvements:
📉 Reduced Production Delays
With up-to-date line performance analysis, you can cut idle time and enhance throughput.
📈 Improved Workforce Effectiveness
Understand where productivity lags, and reward or retrain accordingly.
💸 Lower Costs
With actionable insights on defects, labor costs, and inventory, you’ll see bottom-line improvements.
📊 Faster Decision Making
No more sifting through spreadsheets for hours — get meaningful answers in seconds.
💬 What Users Are Saying (Hypothetical Examples)
“This dashboard changed how our factory runs. Production bottlenecks that took days to uncover are now visible in minutes.” — Operations Head
“Finally, one place to see labor performance, material waste, and machine utilization all together!” — Plant Manager
These kinds of improvements translate directly into better performance and higher profitability.
📌 Ready to Elevate Your Manufacturing Analytics?
If you want to transform how you measure performance and make decisions across your apparel factory, check out the Apparel Manufacturing KPI Dashboard in Power BI today.
It’s more than a tool — it’s a smarter way to compete and win in the modern apparel market.
Conclusion: Don’t Let Your Data Sit Idle
Every apparel factory collects tons of data — but without a system to visualize and interpret it, that data is wasted potential.
With the Apparel Manufacturing KPI Dashboard in Power BI, you can finally unlock insights that matter — fast, clearly, and with impact.
Visit our YouTube channel to learn step-by-step video tutorials