Sustainability Office KPI Dashboard is no longer just a corporate initiative—it is a business-critical responsibility. Organizations today must track environmental impact, energy efficiency, waste reduction, compliance, and social responsibility with accuracy and transparency. However, many sustainability offices still rely on scattered spreadsheets, emails, and manual reports, which delays insights and weakens accountability.
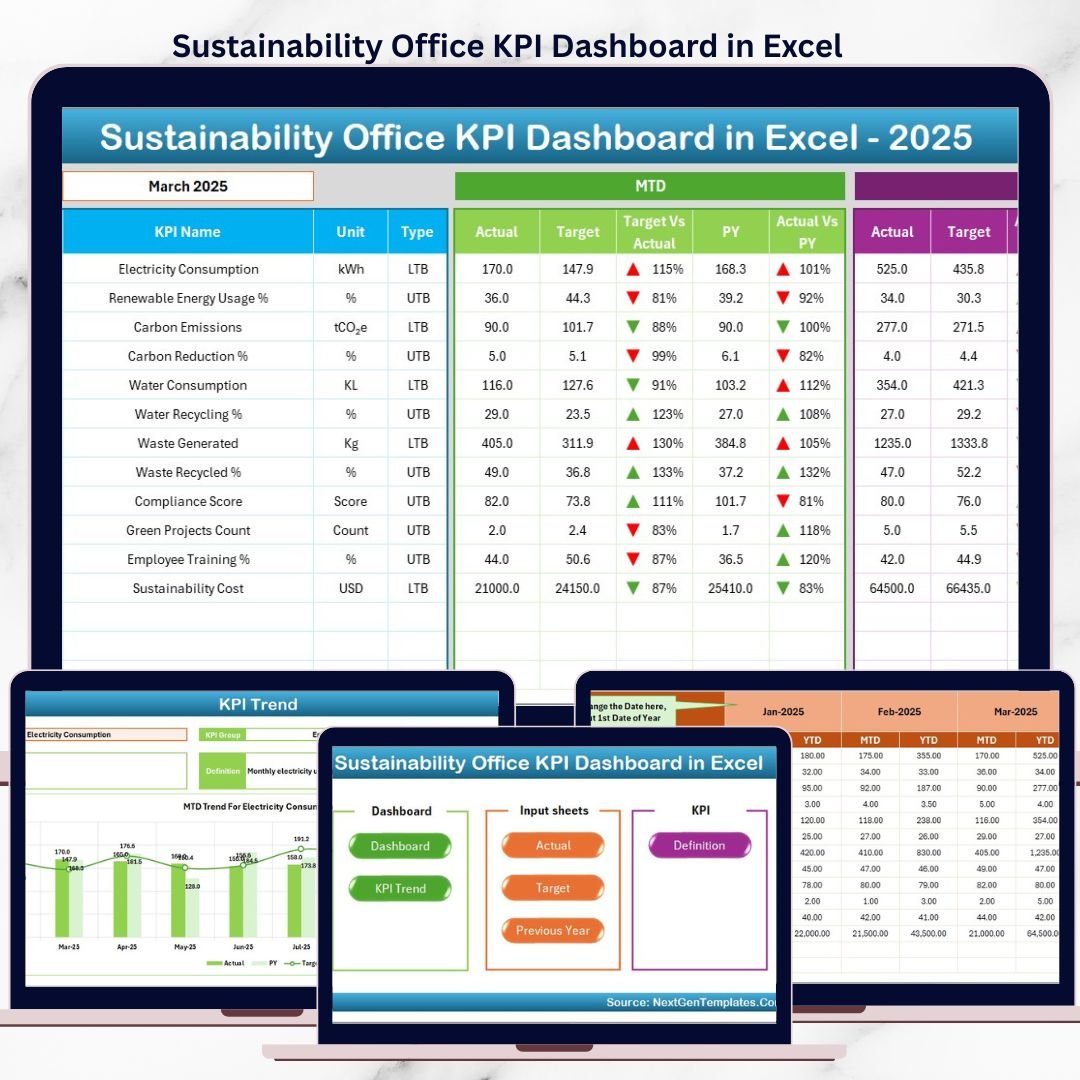
The Sustainability Office KPI Dashboard in Excel is a ready-to-use performance management solution designed to track, analyze, and report sustainability KPIs in one structured Excel file.
Built entirely in Microsoft Excel, this dashboard helps sustainability teams monitor MTD, YTD, and year-over-year performance, compare actuals vs targets, and visualize progress using conditional formatting and trend indicators—without complex tools or expensive software.
🚀 Key Features of Sustainability Office KPI Dashboard in Excel
🌍 Centralized Sustainability KPI Tracking
Track all environmental, social, and governance KPIs in one dashboard.
📅 MTD & YTD Performance Monitoring
Analyze month-to-date and year-to-date sustainability results together.
🎯 Target vs Actual Comparison
Instantly identify performance gaps against sustainability goals.
📊 Previous Year Benchmarking
Measure improvement using year-over-year comparisons.
🔺🔻 Visual Performance Indicators
Up and down arrows highlight KPI improvement or decline.
📈 Detailed KPI Trend Analysis
Analyze sustainability KPIs over time using trend charts.
🧩 Clear KPI Definitions & Logic
Each KPI includes unit, formula, definition, and performance type.
💰 Cost-Effective Excel Solution
No BI tools or advanced systems required.
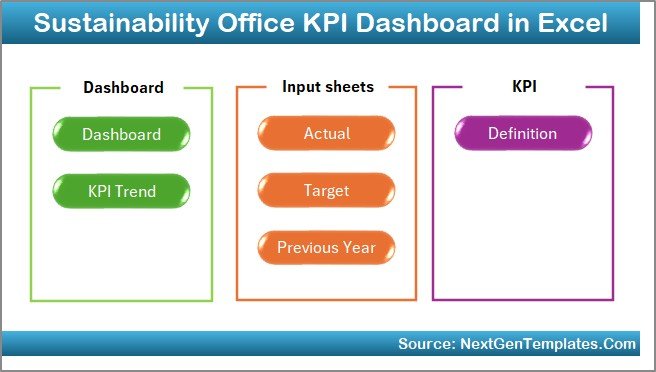
📦 What’s Inside the Sustainability Office KPI Dashboard
📁 Home Sheet
A clean index page with:
-
6 navigation buttons
-
One-click access to all dashboard sections
-
Smooth and user-friendly navigation
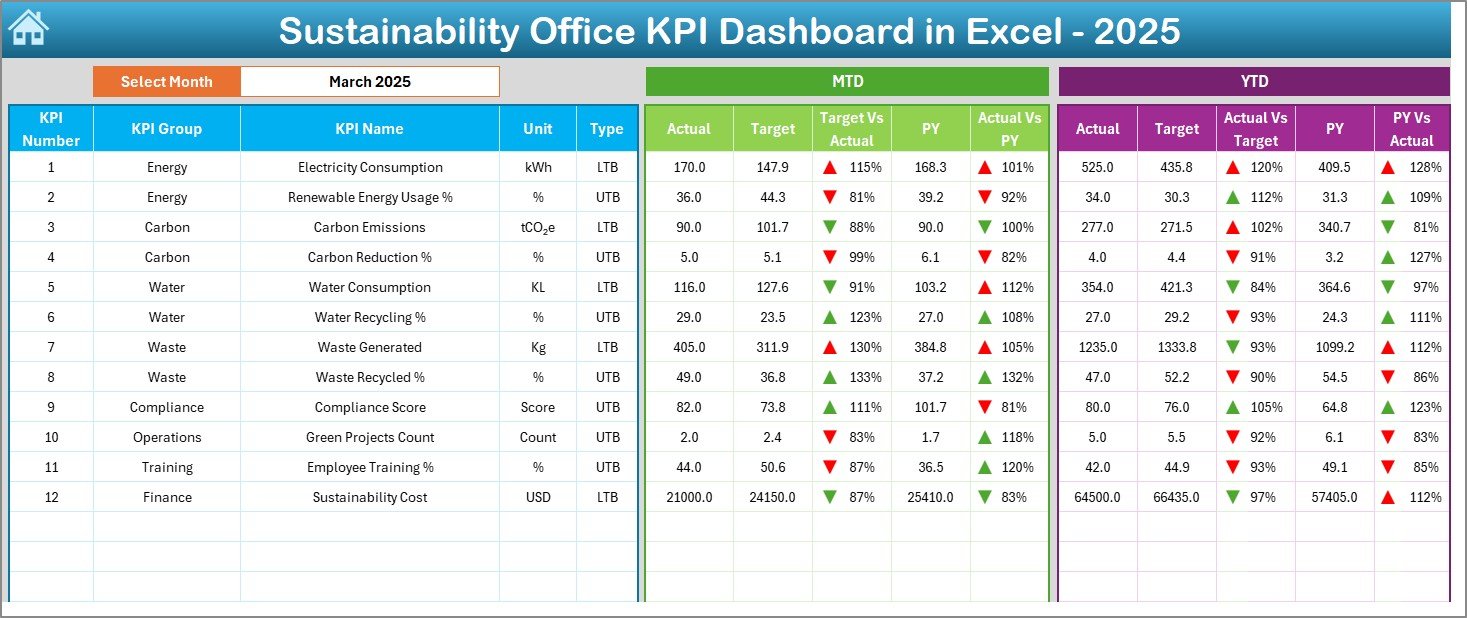
📁 Dashboard Sheet
The main sustainability performance view featuring:
-
Month selector at cell D3
-
Automatic KPI refresh by month
-
MTD Actual vs Target
-
MTD Actual vs Previous Year
-
YTD Actual vs Target
-
YTD Actual vs Previous Year
-
Conditional formatting with arrows
This sheet provides instant clarity for leadership reviews.
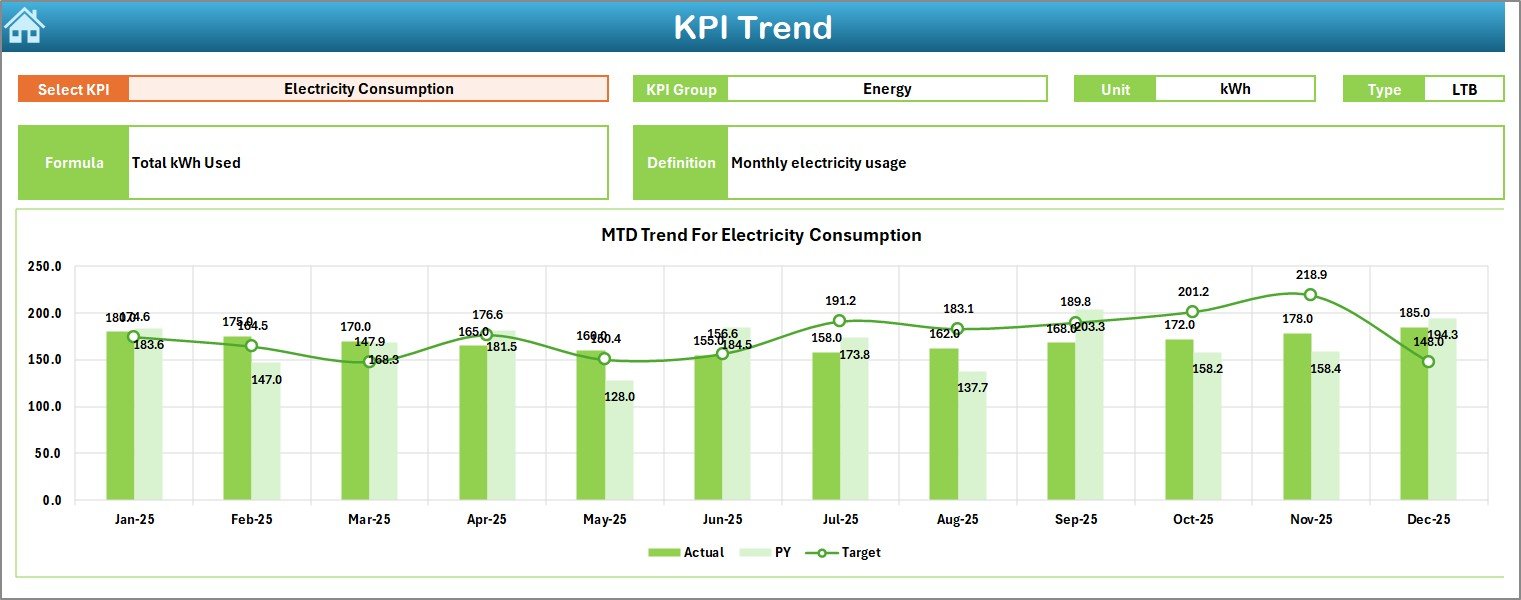
📁 KPI Trend Sheet
Deep KPI-level analysis with:
-
KPI selector (cell C3)
-
KPI Group
-
Unit of Measurement
-
KPI Type (LTB / UTB)
-
KPI Formula
-
KPI Definition
-
MTD & YTD trend charts (Actual, Target, PY)
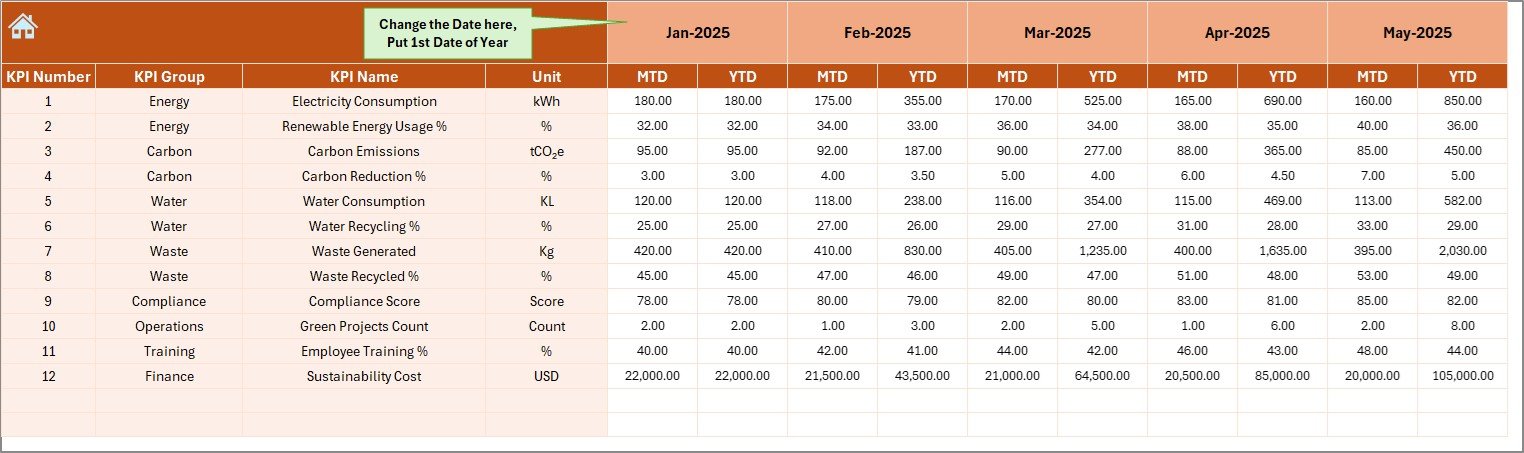
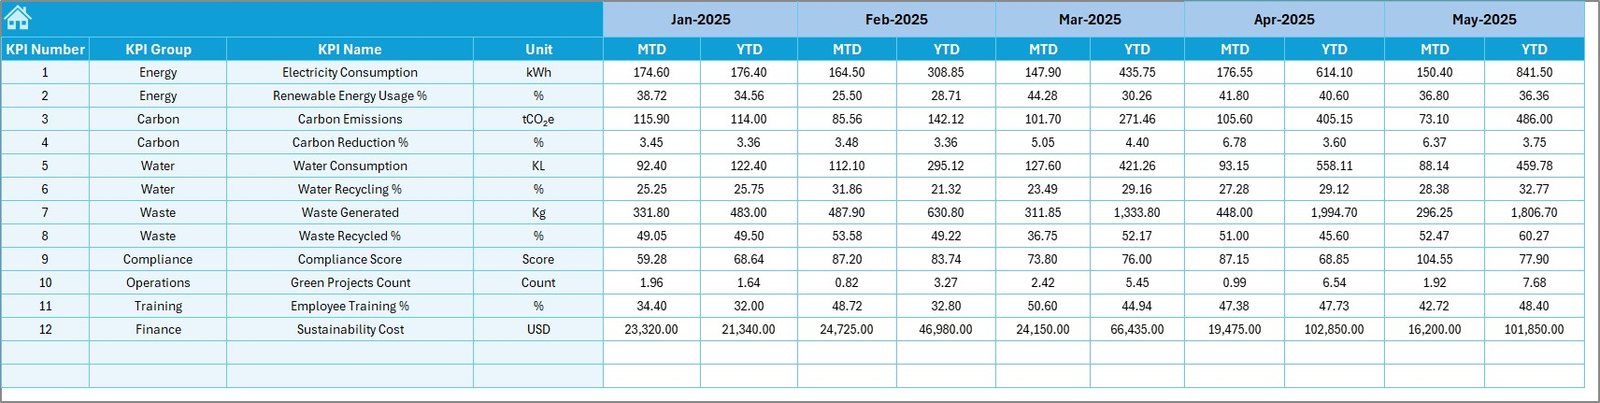
📁 Actual Numbers Input Sheet
Structured input for:
-
MTD actual values
-
YTD actual values
-
Month selection (cell E1)
📁 Target Sheet
Stores sustainability goals:
-
KPI-wise MTD targets
-
KPI-wise YTD targets
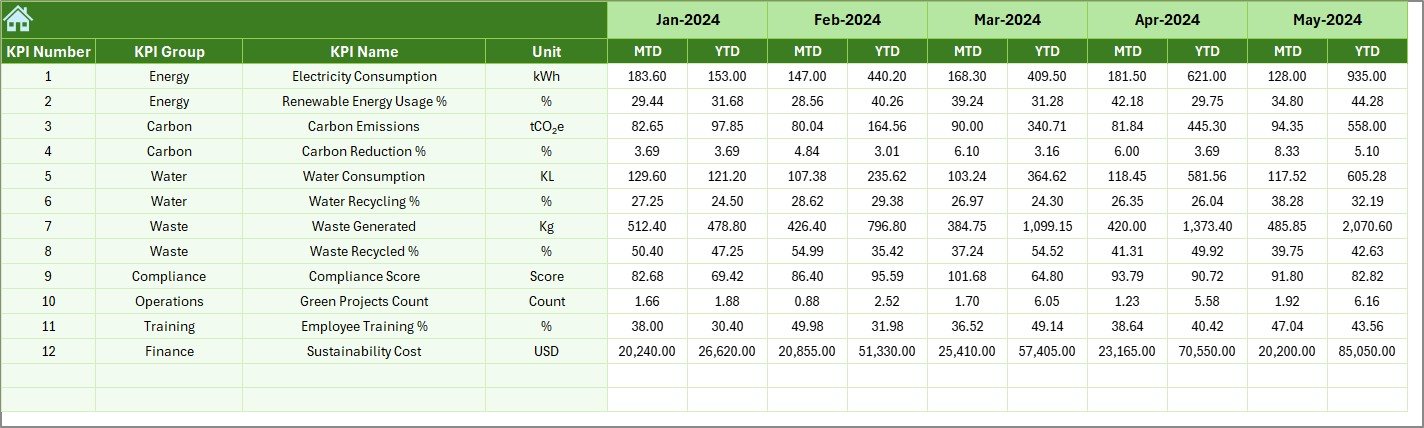
📁 Previous Year Number Sheet
Supports historical comparison:
-
Previous year MTD values
-
Previous year YTD values
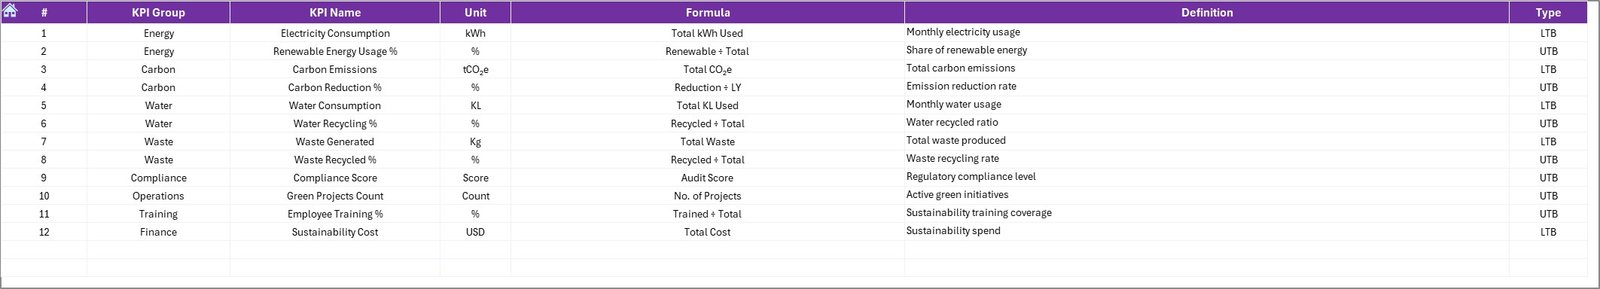
📁 KPI Definition Sheet
The backbone of the dashboard containing:
-
KPI Name
-
KPI Group
-
Unit
-
Formula
-
KPI Definition
🛠️ How to Use the Sustainability Office KPI Dashboard
1️⃣ Define or review KPIs in the KPI Definition sheet
2️⃣ Enter monthly actual data in the Actual Numbers sheet
3️⃣ Maintain targets in the Target sheet
4️⃣ Add last year’s values once
5️⃣ Select the reporting month on the Dashboard
6️⃣ Review MTD & YTD performance instantly
7️⃣ Focus on KPIs with negative trends
No complex formulas. No manual reporting. Just structured data and instant insights.
👥 Who Can Benefit from This Sustainability KPI Dashboard
🌱 Sustainability Officers – Track progress against ESG goals
📊 ESG & Compliance Managers – Support audit-ready reporting
🏭 Operations & Facility Managers – Monitor energy, waste, and usage
🌍 Corporate Responsibility Teams – Improve accountability
📈 Senior Leadership – Review sustainability performance clearly
🏢 Organizations of Any Size – From SMEs to large enterprises
If sustainability performance matters to your organization, this dashboard is built for you.
📘 Click here to read the Detailed blog post
🎥 Visit our YouTube channel to learn step-by-step video tutorials
👉 Youtube.com/@PKAnExcelExpert


Reviews
There are no reviews yet.