Digital Streaming Platforms Dashboard have completely transformed how people consume entertainment, education, and live content. Viewers now expect smooth playback, personalized recommendations, flexible subscription plans, and access across multiple devices. At the same time, platform owners must closely monitor subscription revenue, content costs, device usage, conversion rates, and profitability. However, when data lives in scattered Excel files or manual reports, gaining clear insights becomes difficult and slow.
That is exactly why the Digital Streaming Platforms Dashboard in Excel becomes a powerful and practical solution 🚀.
This ready-to-use Excel dashboard converts raw streaming data into clear, interactive, and decision-ready insights. Instead of switching between multiple spreadsheets for revenue, subscriptions, content costs, and watch behavior, you get a single, well-structured dashboard. Because it is built entirely in Excel, teams can analyze performance quickly without complex tools or heavy technical skills.
Whether your goal is improving subscriber conversions, controlling content costs, or boosting profitability, this dashboard helps streaming businesses move from reactive reporting to proactive decision-making.
🔑 Key Features of Digital Streaming Platforms Dashboard in Excel
📊 Centralized Streaming Analytics – Track subscriptions, revenue, costs, and profits in one dashboard
🎯 Interactive Slicers – Filter data by platform, content type, device, and month
🧭 Page Navigator – Instantly move between dashboard pages from the left-side menu
💳 Paid Payment % Tracking – Monitor trial-to-paid conversion performance
📈 Profitability Insights – Analyze profit by platform, content type, and device
📱 Device Usage Analysis – Understand viewer behavior across devices
⚡ Instant Excel Updates – Refresh data and update visuals automatically
🧩 Fully Customizable – Add KPIs or modify charts as business needs evolve
📂 What’s Inside the Digital Streaming Platforms Dashboard in Excel
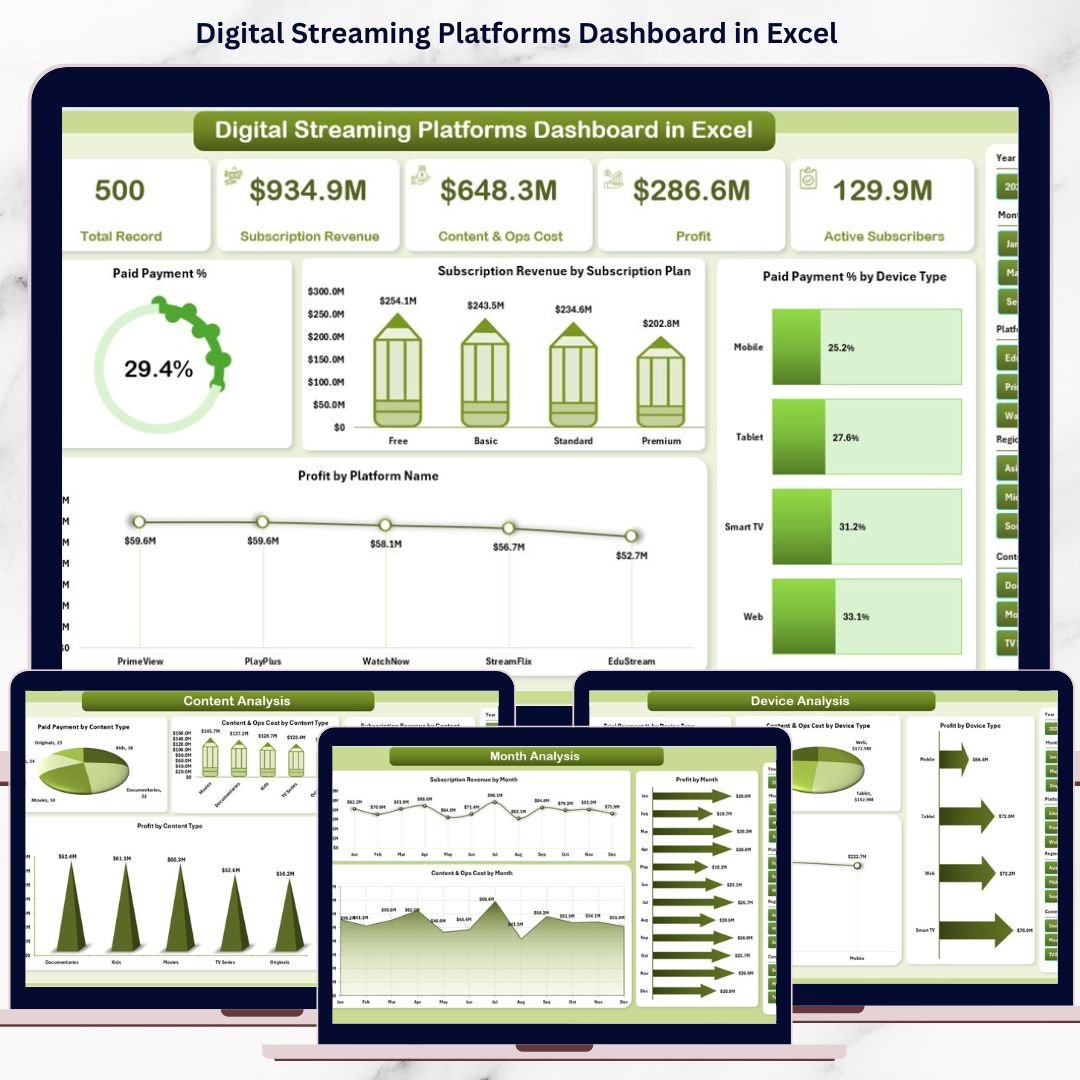
This digital product includes five structured analytical pages, each designed to answer a specific business question:
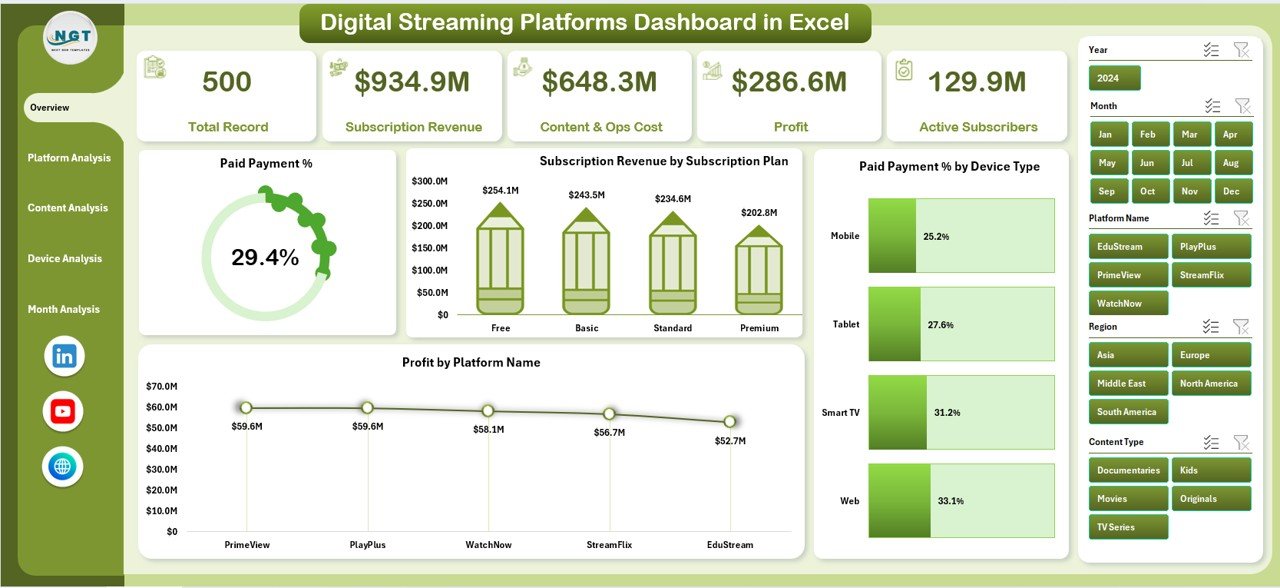
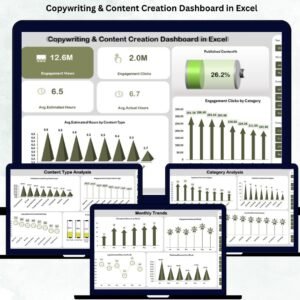
📌 Overview Page – High-level snapshot with KPI cards and charts showing paid payment %, subscription revenue, device conversion, and profit by platform
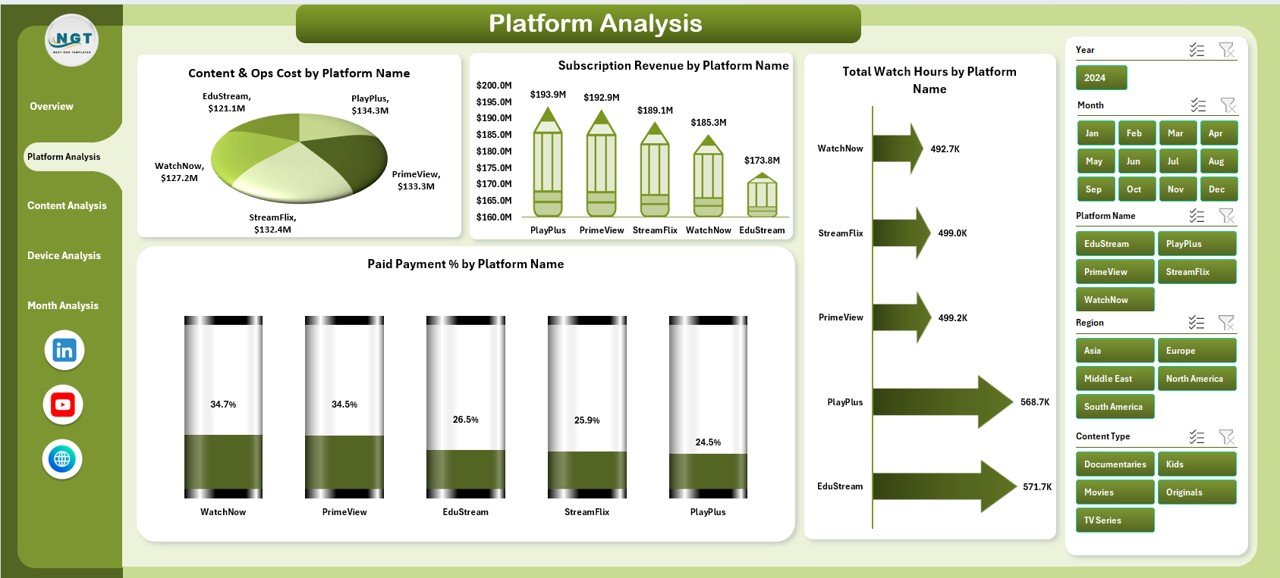
📌 Platform Analysis Page – Compare content cost, revenue, watch hours, and conversion rates across platforms
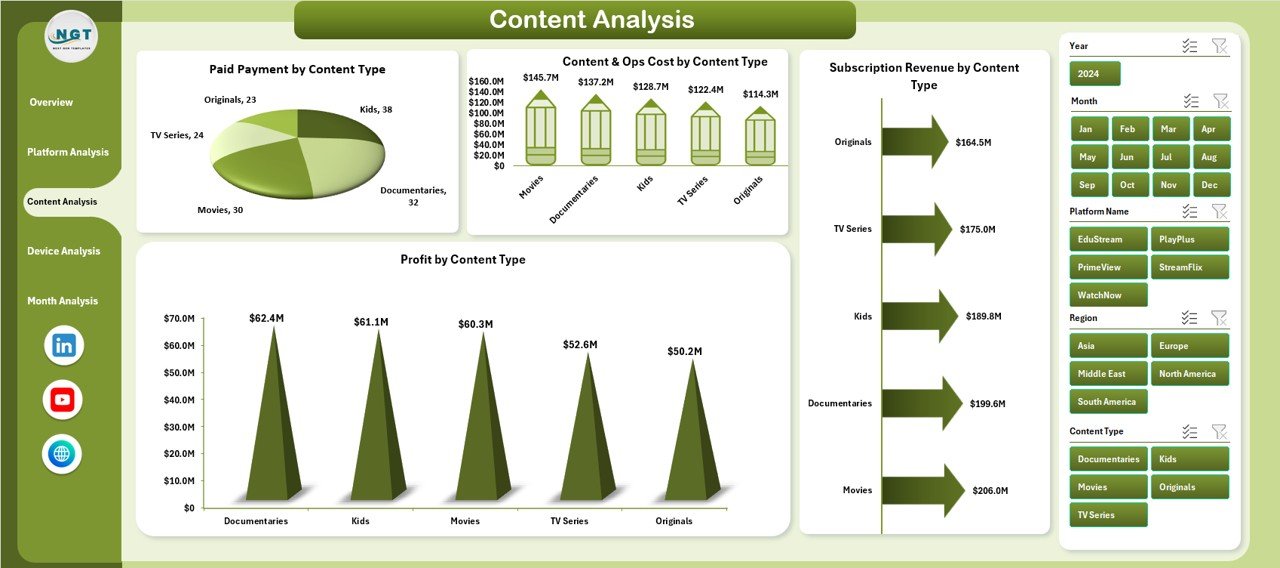
📌 Content Analysis Page – Evaluate performance by content type, including cost, revenue, conversion, and profit
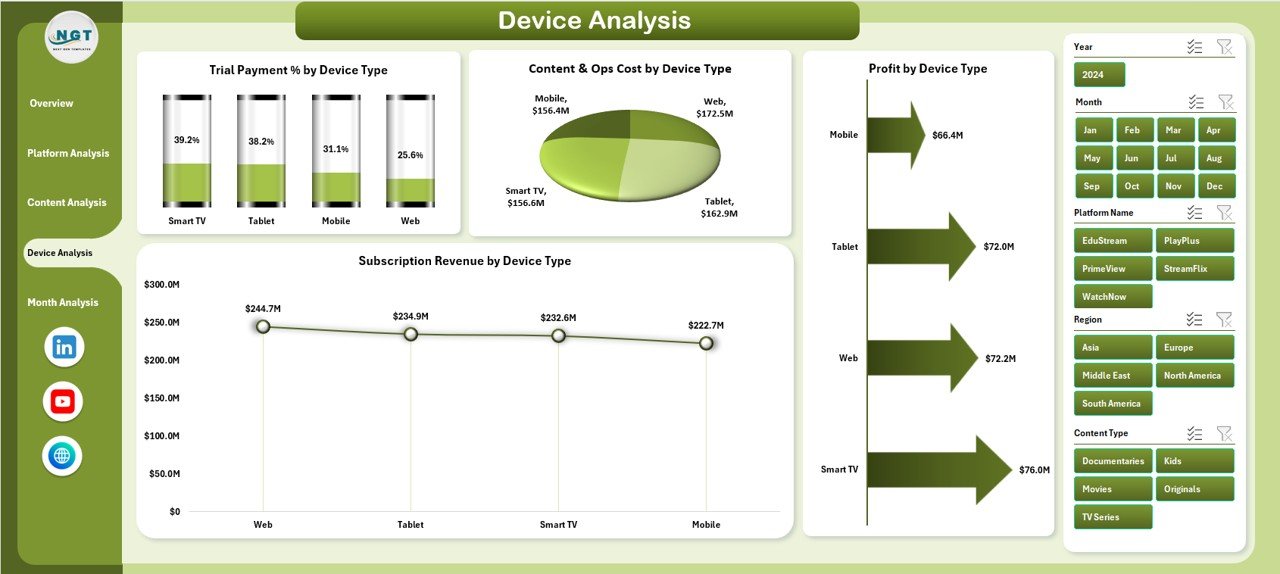
📌 Device Analysis Page – Analyze subscriptions, costs, and profitability across device types
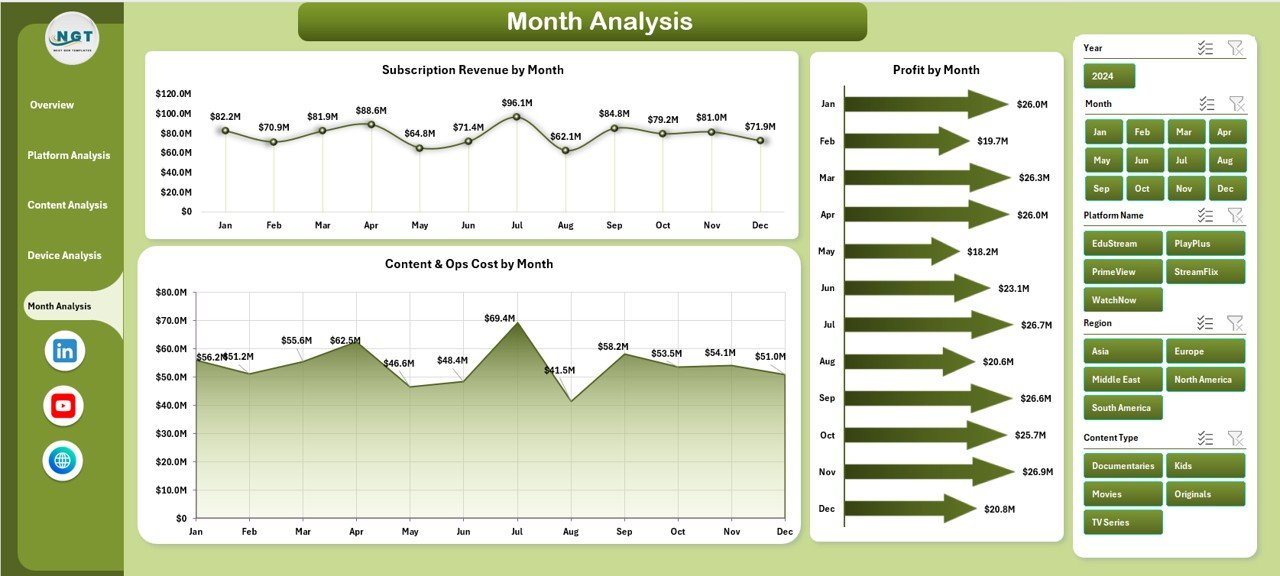
📌 Month Analysis Page – Track revenue, cost, and profit trends over time
All pages are connected through slicers and respond instantly to user selections.
🛠️ How to Use the Digital Streaming Platforms Dashboard in Excel
Using this dashboard is simple and intuitive:
1️⃣ Enter or update streaming data in the underlying Excel tables
2️⃣ Use the Page Navigator to move between analysis pages
3️⃣ Apply slicers to filter by platform, content, device, or month
4️⃣ Start with the Overview Page for instant performance clarity
5️⃣ Drill into platform, content, or device insights
6️⃣ Review monthly trends for forecasting and planning
7️⃣ Share insights with stakeholders using one professional Excel dashboard
No macros. No advanced Excel skills. Just actionable insights.
👥 Who Can Benefit from This Digital Streaming Platforms Dashboard in Excel
This dashboard is ideal for:
📺 Streaming Platform Executives – Gain a clear view of business performance
💰 Finance & Revenue Teams – Track subscriptions, costs, and profitability
🎬 Content Strategy Teams – Invest in high-performing content categories
📈 Marketing & Growth Teams – Improve trial-to-paid conversion rates
📊 Operations & Analytics Teams – Reduce manual reporting effort
🚀 Startups & Established Platforms – Scale insights as the business grows
Because Excel is widely used, teams adopt this dashboard quickly.


Reviews
There are no reviews yet.