Running a clinic today is no longer limited to treating patients. Clinics must continuously monitor patient satisfaction, billing performance, doctor efficiency, treatment costs, and monthly trends to remain competitive and profitable. However, when this information is scattered across multiple Excel files and manual reports, decision-making becomes slow, confusing, and reactive.
That is exactly why the Clinic Dashboard in Excel becomes a powerful, practical, and business-ready solution.
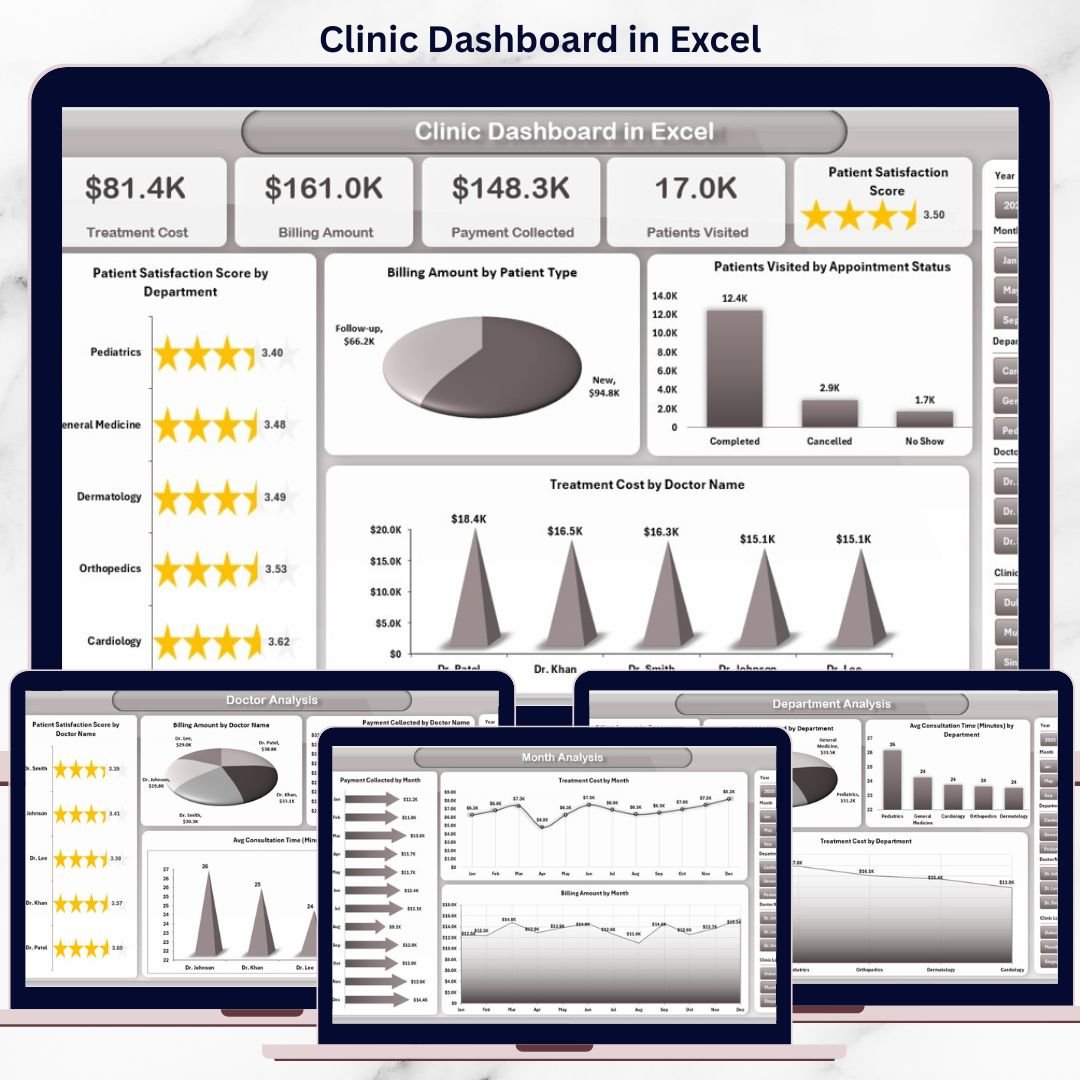
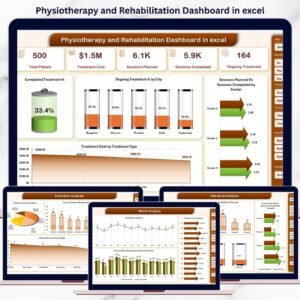
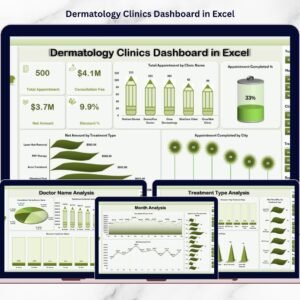
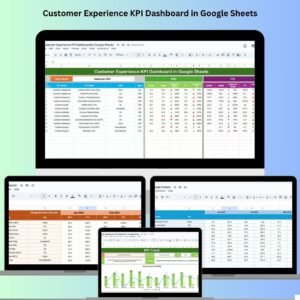
This ready-to-use Excel dashboard transforms raw clinic data into clear KPIs, interactive charts, and actionable insights. Instead of spending hours compiling reports, clinic owners and administrators gain instant visibility into operational and financial performance—all within a single Excel file.
Built entirely using Microsoft Excel pivot tables, slicers, charts, and formulas, this dashboard delivers enterprise-level analytics without expensive BI tools or technical complexity.
🔑 Key Features of Clinic Dashboard in Excel
📊 Centralized Clinic Performance Monitoring
Track patient satisfaction, billing, collections, doctor performance, and costs in one dashboard.
🧭 Page Navigator for Easy Navigation
Quickly move between dashboard pages without scrolling or confusion.
🎛️ Right-Side Interactive Slicers
Filter data dynamically by department, location, doctor, or month.
🏥 Location-Wise Clinic Analysis
Compare performance across multiple clinic locations.
👩⚕️ Doctor-Wise Performance Tracking
Monitor satisfaction, billing, collections, and consultation efficiency by doctor.
🏢 Department-Wise Insights
Identify top-performing and cost-heavy departments instantly.
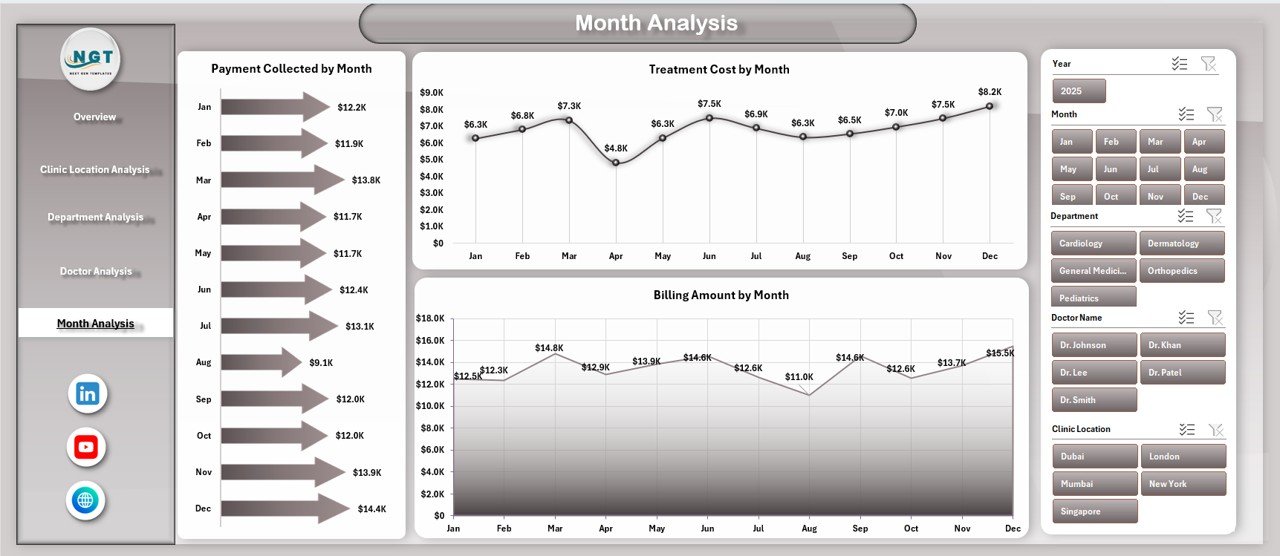
📅 Month-Wise Trend Analysis
Understand seasonal trends in billing, costs, and collections.
⚙️ 100% Excel-Based Solution
No macros, no BI tools—simple, fast, and reliable Excel analytics.
📂 What’s Inside the Clinic Dashboard in Excel
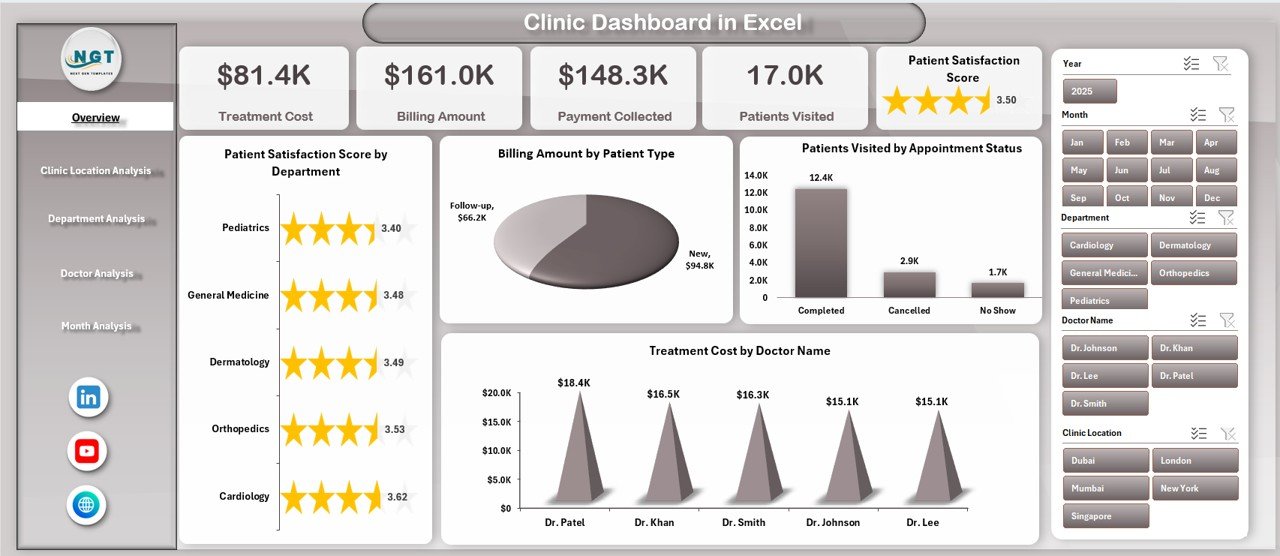
📄 Overview Page
High-level snapshot with KPI cards and summary charts.
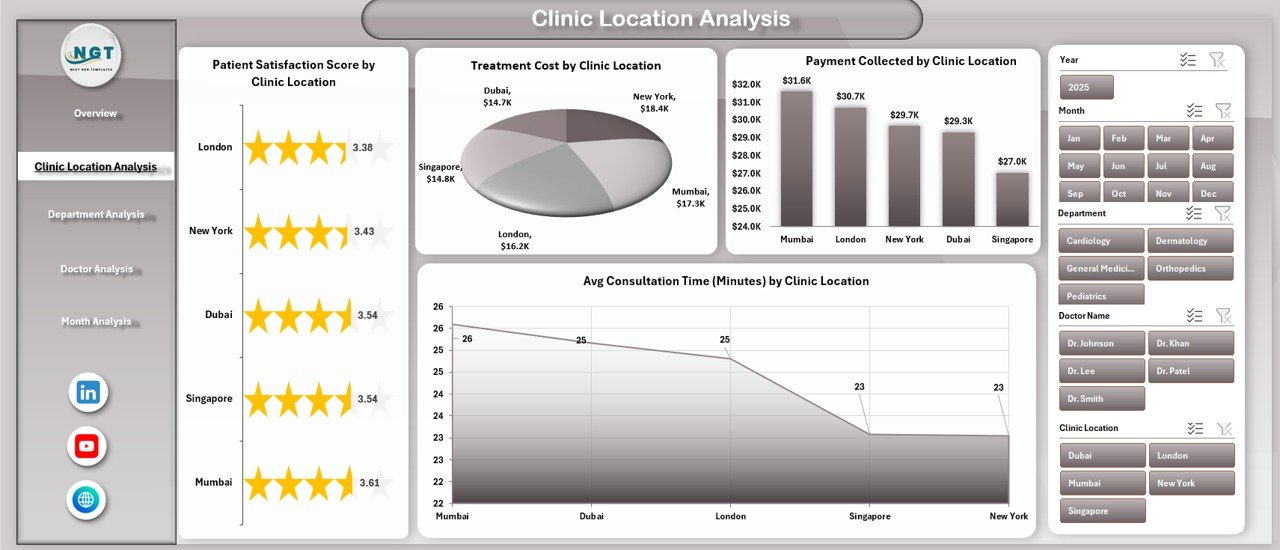
📄 Clinic Location Analysis Page
Performance comparison across clinic locations.
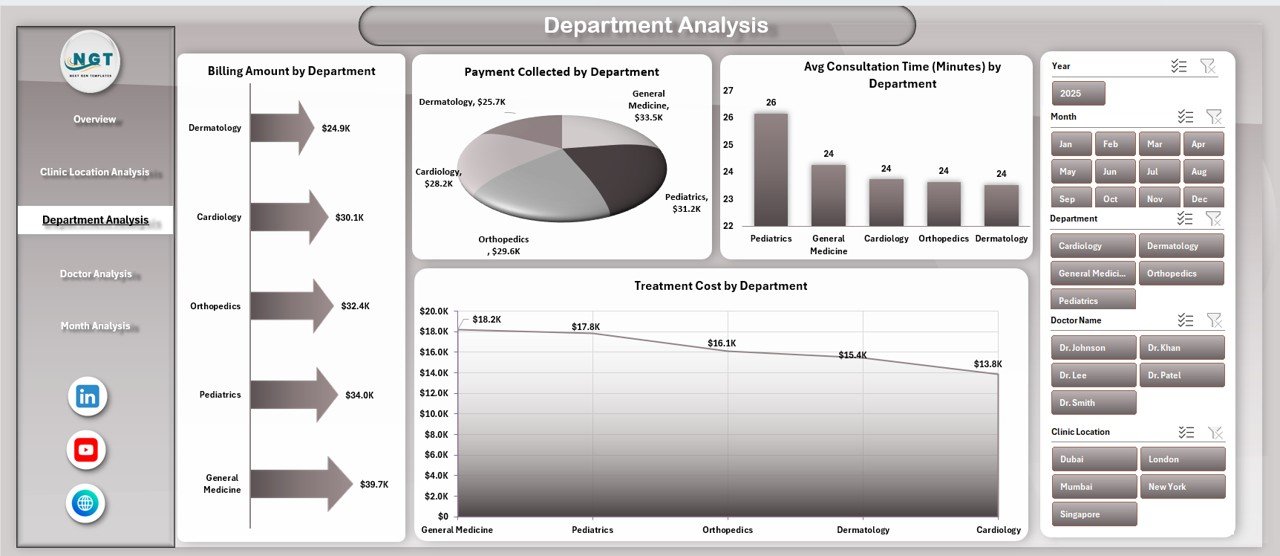
📄 Department Analysis Page
Department-wise billing, cost, collection, and efficiency insights.
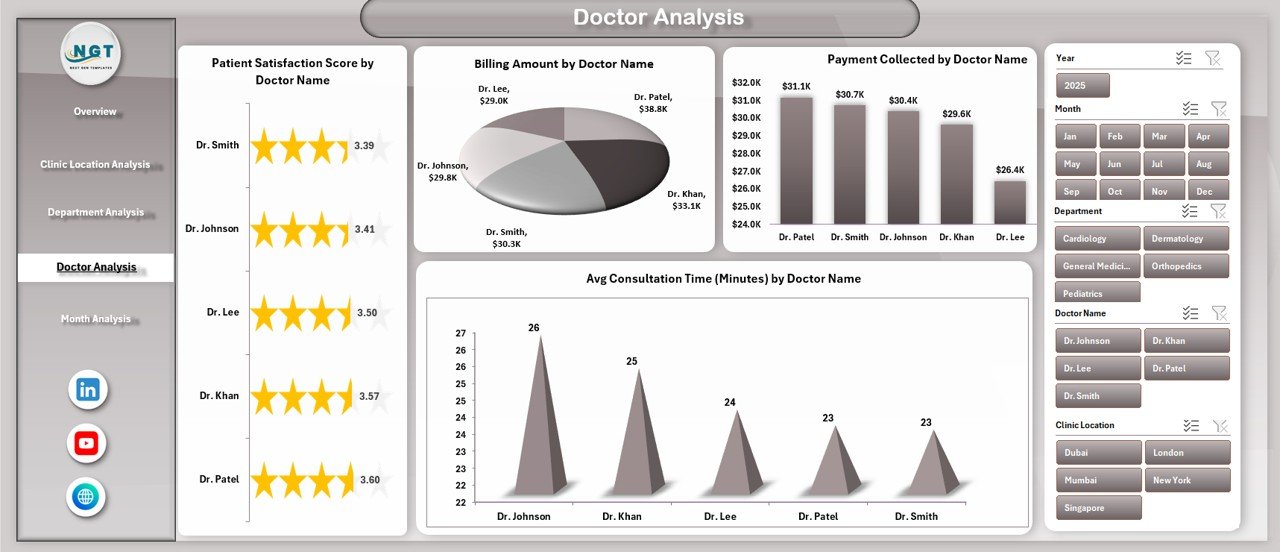
📄 Doctor Analysis Page
Doctor-wise satisfaction, billing, collections, and consultation time.
📄 Month Analysis Page
Time-based trends for billing, costs, and payment collection.
📊 Data Sheet
Stores raw clinic data including patients, doctors, departments, locations, billing, costs, and dates.
🛠️ Support Sheet
Contains helper tables, mappings, and calculations to keep the dashboard fast and accurate.
Together, these components create a complete clinic performance management system in Excel.
🛠️ How to Use the Clinic Dashboard in Excel
1️⃣ Enter or update clinic data in the Data Sheet
2️⃣ Keep data clean and structured
3️⃣ Refresh pivot tables if required
4️⃣ Use slicers to filter by doctor, department, location, or month
5️⃣ Review KPI cards and charts on the Overview Page
6️⃣ Navigate to detailed pages using the Page Navigator
7️⃣ Identify gaps and take corrective action
No advanced Excel skills are required. Anyone with basic Excel knowledge can use this dashboard confidently.
👥 Who Can Benefit from This Clinic Dashboard in Excel
🏥 Clinic owners and founders
👩⚕️ Medical directors and senior doctors
📊 Clinic administrators
💰 Finance and billing teams
📈 Operations and planning teams
If your clinic wants better visibility, control, and smarter decisions, this dashboard is built for you.
📘 Click here to read the Detailed blog post
🎥 Visit our YouTube channel to learn step-by-step video tutorials
👉 YouTube Channel


Reviews
There are no reviews yet.