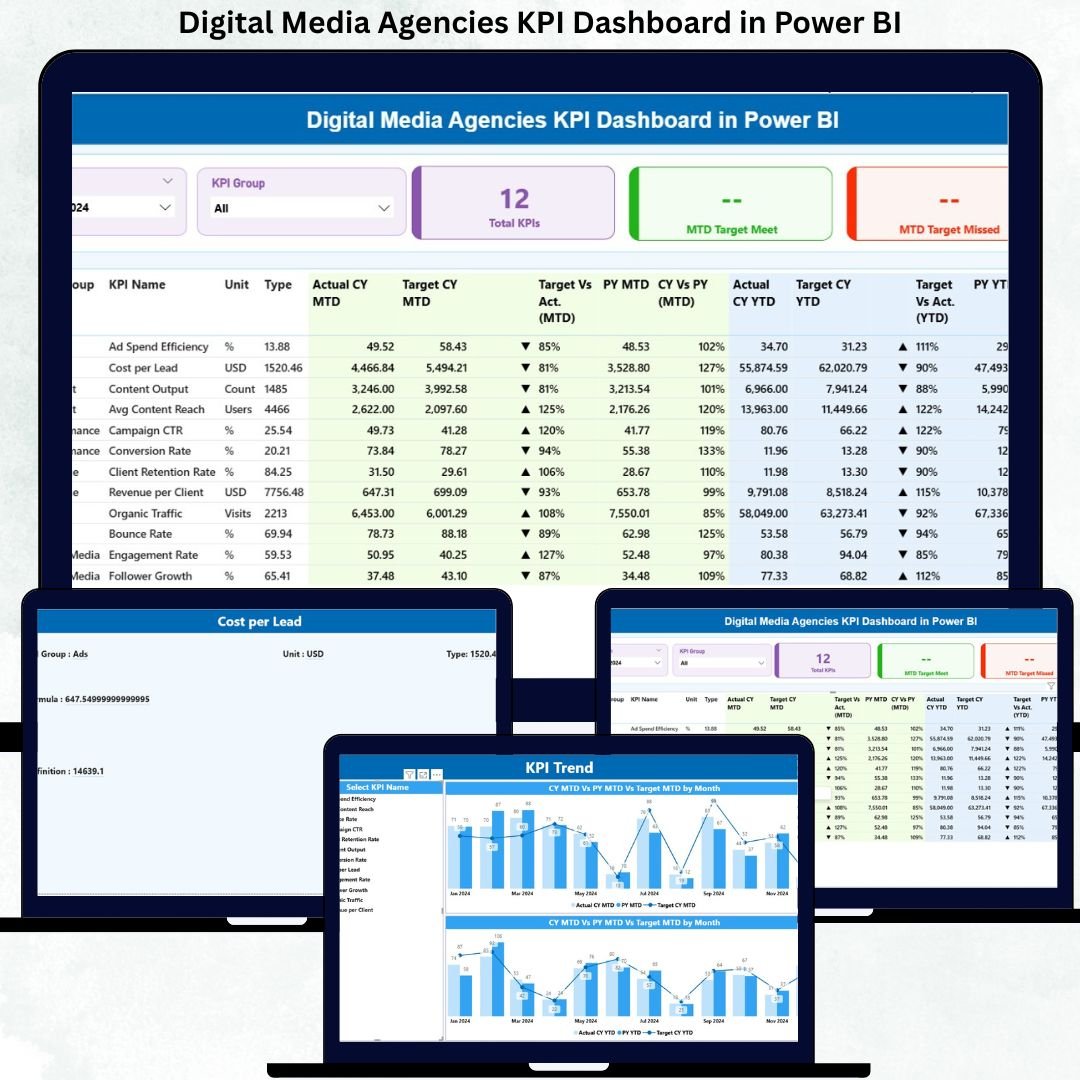
In the fast-paced world of digital marketing, data changes daily, client expectations rise constantly, and performance pressure never stops. Digital media agencies can no longer afford slow, manual, or scattered reporting. That is why the Digital Media Agencies KPI Dashboard in Power BI is designed as a ready-to-use, professional, and decision-driven solution for modern agencies.
This dashboard converts raw Excel data into interactive Power BI visuals that clearly show campaign results, budget performance, ROI, delivery efficiency, and overall agency health. Instead of juggling multiple spreadsheets and reports, agencies get one centralized dashboard to monitor performance confidently.
Whether you manage campaigns, clients, budgets, or teams, this dashboard helps you spot issues early, track targets accurately, and make faster decisions—all with minimal effort.
🚀 Key Features of Digital Media Agencies KPI Dashboard in Power BI
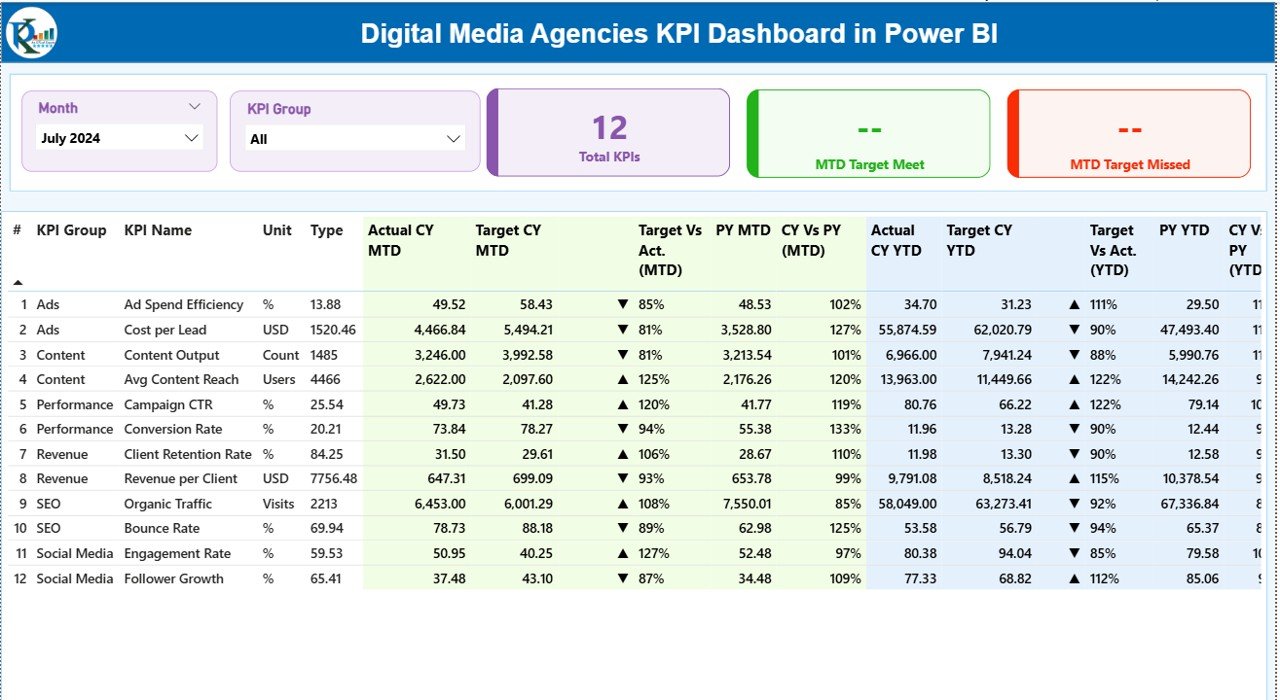
📊 Centralized KPI Monitoring – Track all agency KPIs in one clean and interactive Power BI dashboard
📅 MTD & YTD Performance Tracking – Monitor Month-to-Date and Year-to-Date results instantly
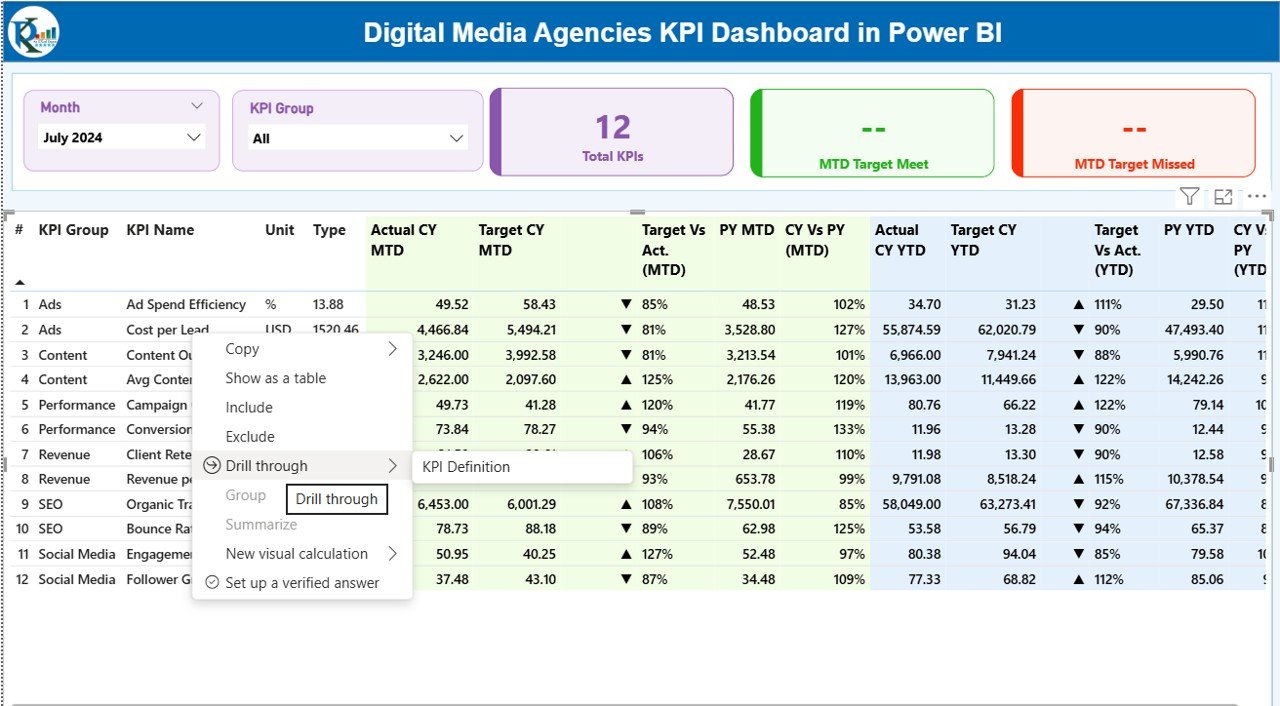
🎯 Target vs Actual Analysis – Identify missed and achieved targets using visual indicators
📈 Previous Year Comparison – Compare CY vs PY to measure real performance improvement
🎛 Interactive Slicers – Filter results by Month and KPI Group dynamically
📋 Detailed KPI Table – View all KPIs with actuals, targets, trends, and status icons
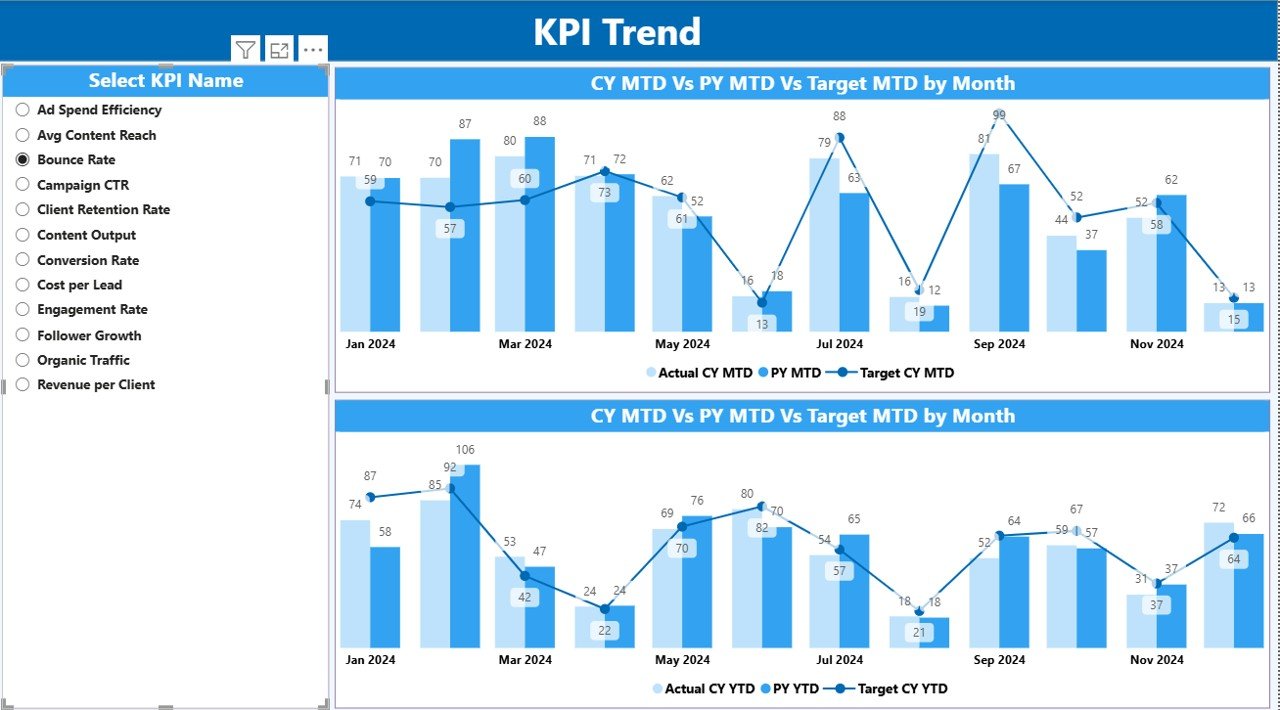
📉 Trend Analysis Page – Analyze performance movement using MTD and YTD combo charts
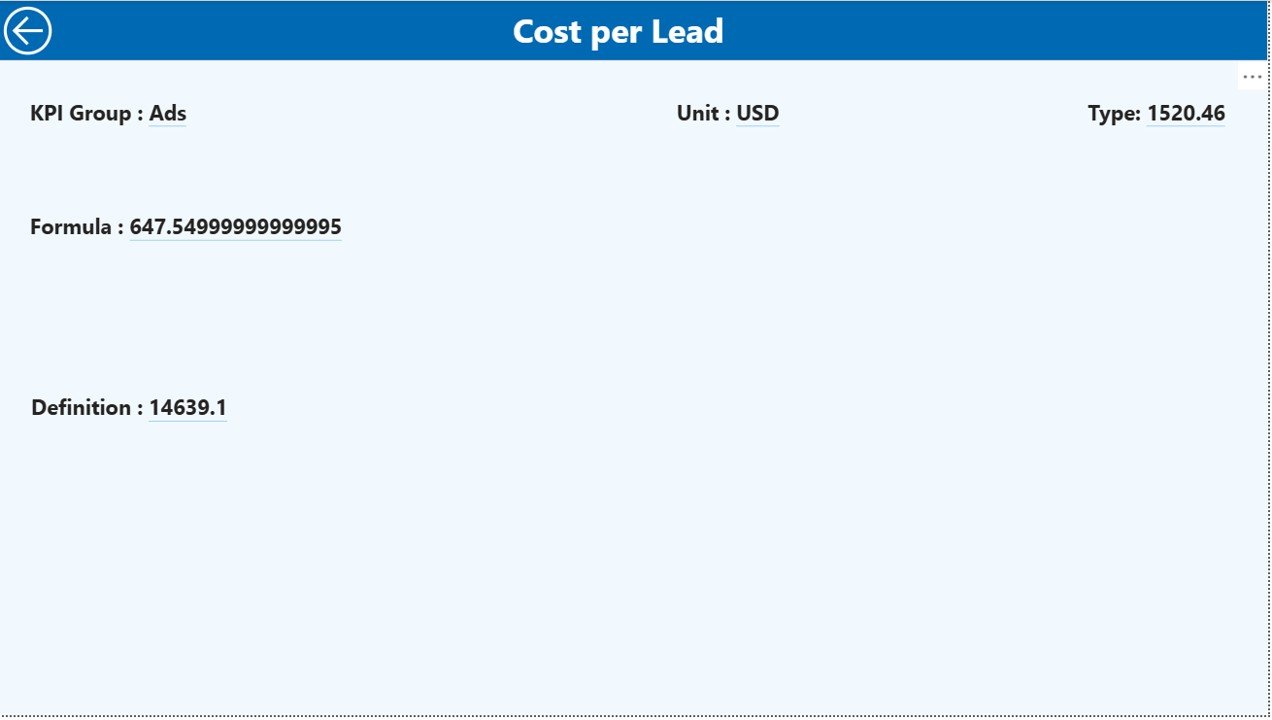
📘 KPI Definition Drill-Through – Understand formulas, definitions, and KPI logic clearly
📂 Excel-Based Data Input – Easy data maintenance without technical expertise
📦 What’s Inside the Digital Media Agencies KPI Dashboard in Power BI
🖥 Power BI Desktop File with 3 professionally designed pages
📊 Summary Page showing KPI cards, slicers, and detailed KPI performance table
📈 KPI Trend Page with MTD & YTD combo charts for deep trend analysis
📘 KPI Definition Page with drill-through functionality for clarity and transparency
📁 Excel Data File containing structured sheets:
-
Input_Actual
-
Input_Target
-
KPI Definition
Each component is carefully structured to ensure accuracy, clarity, and scalability.
🛠 How to Use the Digital Media Agencies KPI Dashboard in Power BI
1️⃣ Enter KPI actual values in the Input_Actual Excel sheet
2️⃣ Define monthly and yearly targets in the Input_Target sheet
3️⃣ Maintain KPI names, formulas, units, and logic in the KPI Definition sheet
4️⃣ Open the Power BI file and click Refresh
5️⃣ Use slicers to analyze performance by month and KPI group
6️⃣ Drill through KPIs to understand definitions and formulas
7️⃣ Export visuals or use insights for management and client reporting
No complex setup. No coding. Just update Excel and refresh Power BI.
👥 Who Can Benefit from This Digital Media Agencies KPI Dashboard
🎯 Digital Media Agency Owners – Gain full visibility into agency performance
📊 Digital Marketing Managers – Track campaign and operational KPIs easily
🤝 Account Managers – Deliver transparent, data-driven client reports
📈 Performance Analysts – Analyze trends and identify optimization opportunities
💰 Finance Teams – Monitor budgets, ROI, and efficiency metrics
🧠 Strategy Teams – Make informed decisions using real-time insights
This dashboard is ideal for small agencies, growing teams, and enterprise-level digital firms.
Click here to read the Detailed Blog Post
Watch the step-by-step video tutorial:
Visit our YouTube channel to learn step-by-step video tutorials
YouTube.com/@PKAnExcelExpert


Reviews
There are no reviews yet.