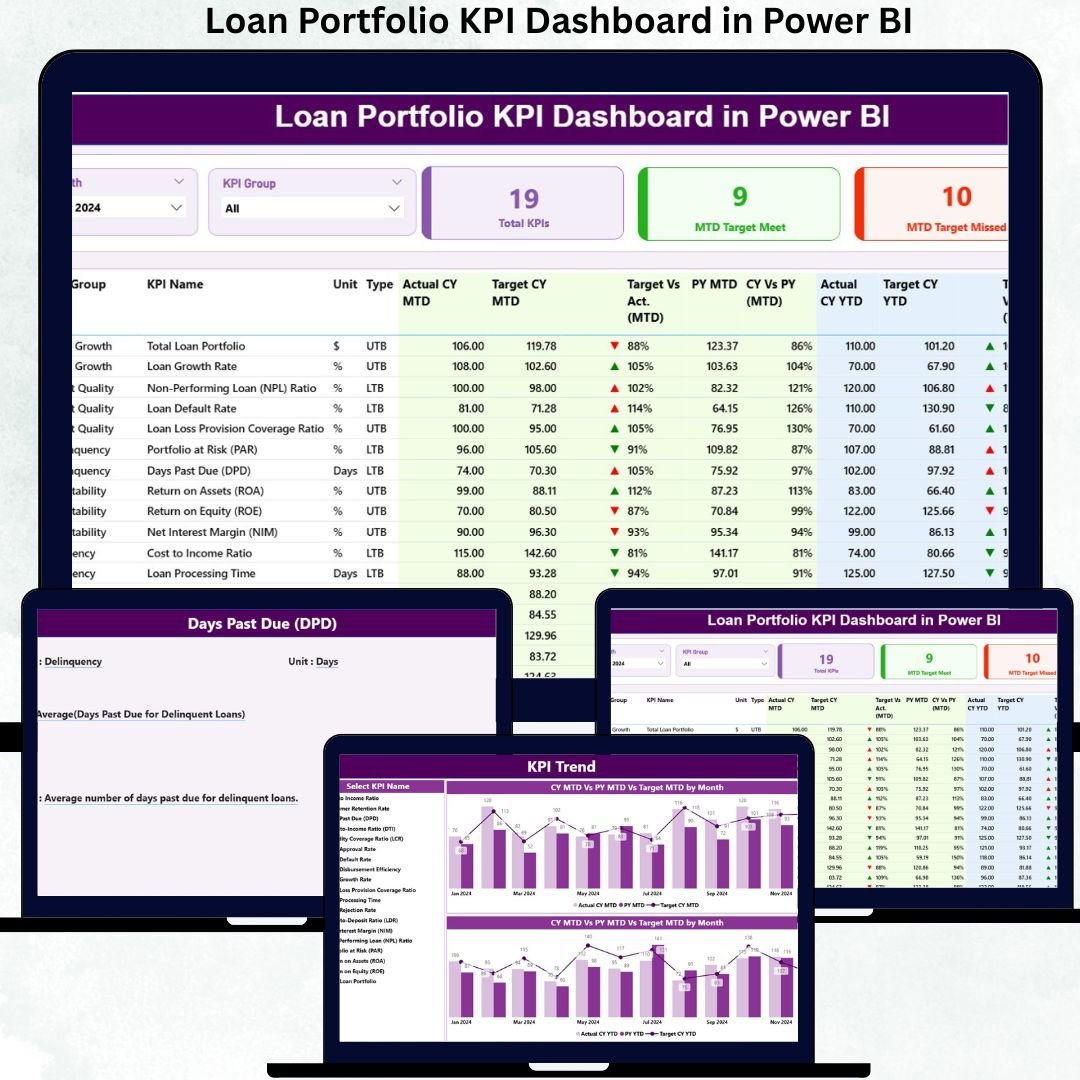
Loan Portfolio KPI Dashboard in Power BI is the ultimate performance management tool for banks, NBFCs, microfinance institutions, and fintech lenders. Managing a loan portfolio requires speed, accuracy, and real-time visibility—and this dashboard delivers all three. Instead of spending hours building reports, your team can now understand portfolio health, credit risk, collection efficiency, disbursements, and operational KPIs at a single glance.
This ready-to-use Power BI template transforms your Excel data into smart visual insights. Just refresh your file, select any month from the slicer, and the entire dashboard updates instantly. Whether you manage thousands of borrowers or multiple lending branches, this dashboard gives your team the clarity needed to make confident, data-driven decisions every day.
🔥 Key Features of Loan Portfolio KPI Dashboard in Power BI
This dashboard is packed with powerful features designed for real-time loan portfolio monitoring.
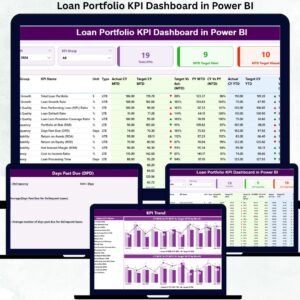
⭐ Dynamic Summary Page
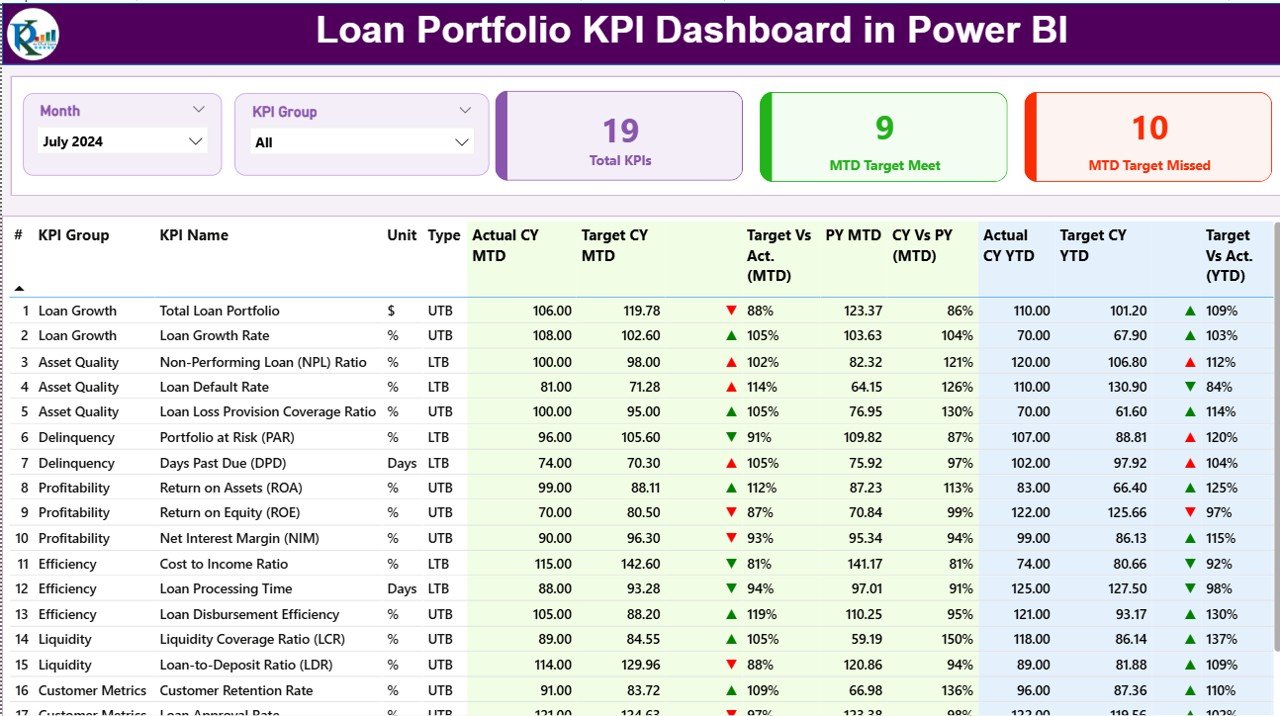
This is the main control center of your dashboard.
-
📅 Month Slicer to instantly switch data views
-
🗂 KPI Group Slicer for filtering Risk, Portfolio, Collection & Operational KPIs
-
📊 High-Level KPI Cards: Total KPIs, MTD Target Met, MTD Target Missed
-
📘 Detailed KPI Table with Actual, Target, PY Comparison, MTD/YTD metrics, and conditional icons
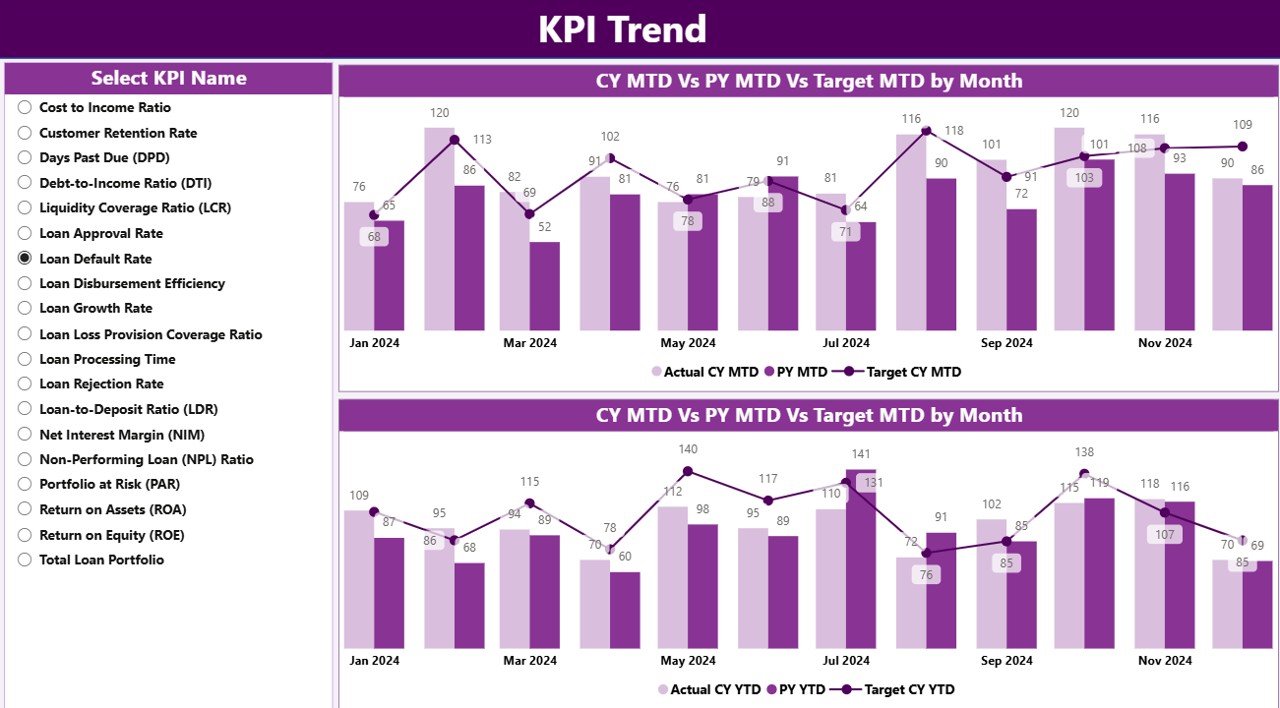
📈 KPI Trend Page
-
📊 Two combo charts showing Actual vs Target vs Previous Year
-
🎯 KPI Slicer to drill into any KPI trend
-
🚀 Perfect for forecasting, performance review, and strategic planning
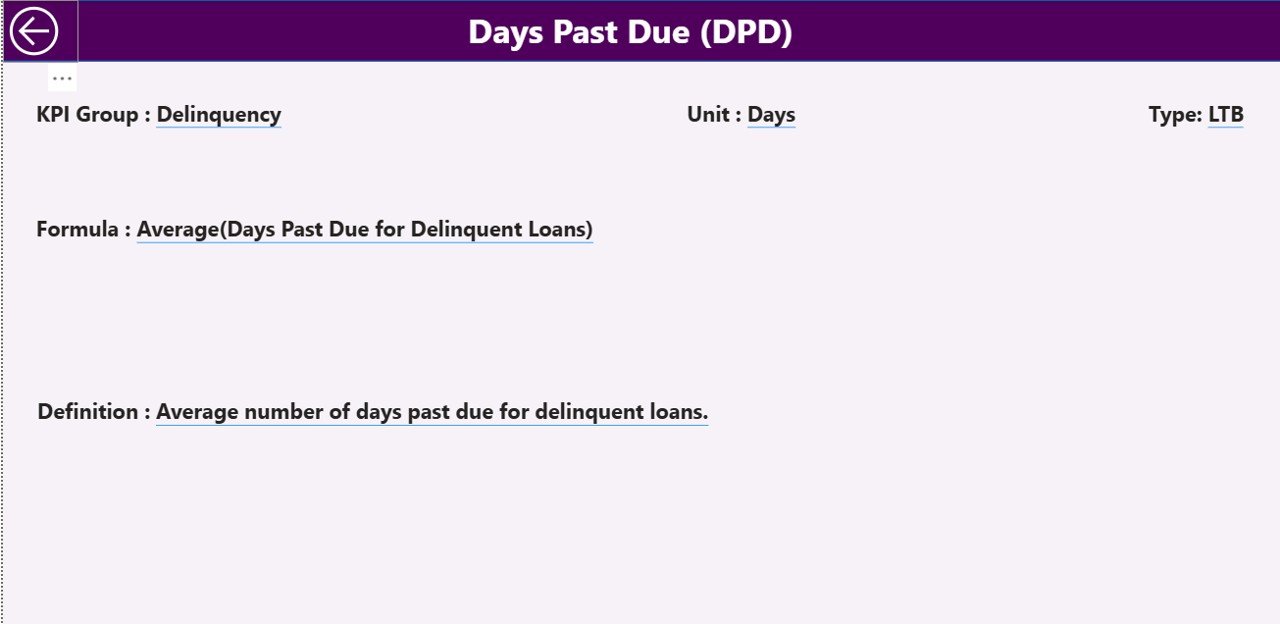
🧾 KPI Definition Page
-
📘 Full details of KPI Name, Formula, Definition, Unit & KPI Type (LTB/UTB)
-
🔍 Works as a drill-through page for deeper understanding
📦 What’s Inside the Loan Portfolio KPI Dashboard
Inside this complete Power BI package, you get everything you need to measure loan performance accurately:
-
📁 Power BI Dashboard File (.pbix)
-
📊 Excel Data Source File with:
-
Input_Actual (MTD & YTD actuals)
-
Input_Target (MTD & YTD targets)
-
KPI Definition (formula, unit, type, definition)
-
-
📝 Preloaded KPI categories like Portfolio Quality, Risk, Collections, Disbursements & Operations
-
🎯 Ready-made visuals and slicers for instant portfolio analysis
-
⚡ Automated calculations for Target vs Actual, CY vs PY, Variance %, Trend lines
Everything is built using clean, structured tables so the dashboard refreshes with perfect accuracy every time.
📌 How to Use the Loan Portfolio KPI Dashboard in Power BI
Using this dashboard is extremely simple—even for beginners.
1️⃣ Download the Excel data file
2️⃣ Update your monthly numbers (Actuals & Targets)
3️⃣ Refresh Power BI
4️⃣ Select the month you want to analyze
5️⃣ Explore Summary, Trend & KPI Definition pages
✔ No coding
✔ No complex setup
✔ No additional software needed
Just plug in your numbers and start analyzing.
👥 Who Can Benefit from This Loan Portfolio KPI Dashboard?
This dashboard is designed for every lending business—large or small.
-
🧑💼 Credit Managers – Track risk, overdue trends, and NPA movement
-
📉 Risk Analysts – Analyze PAR, delinquency rate, write-offs & efficiency ratios
-
🏦 Banking & NBFC Leaders – Get a real-time portfolio health report
-
📊 Branch & Regional Managers – Compare locations and performance gaps
-
🧑💻 Data Analysts – Automate reporting and reduce manual workload
-
💼 Fintech Lending Teams – Improve customer behavior insights & operational KPIs
If you want transparency, faster reporting, and data-driven decision-making, this dashboard is perfect for your organization.
### Click here to read the Detailed blog post
Visit our YouTube channel to learn step-by-step video tutorials
👉 Youtube.com/@PKAnExcelExpert


Reviews
There are no reviews yet.