
In today’s data-driven business world, workforce diversity is no longer a checkbox—it’s a competitive advantage. Organizations that understand their people better make stronger decisions, build inclusive cultures, and drive long-term growth. However, many HR teams still rely on static reports, scattered files, and manual analysis that hides critical diversity insights.
That is exactly where the Employee Diversity Dashboard in Excel becomes a game-changer 🚀.
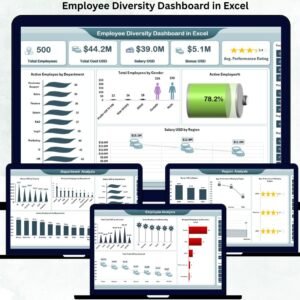
This ready-to-use Excel dashboard transforms raw HR data into clear, visual, and actionable diversity insights—without Power BI, coding, or complex tools. With just one Excel file, HR leaders and decision-makers can instantly understand workforce composition across gender, region, department, job level, nationality, education, salary, bonuses, and performance.
✅ Key Features of Employee Diversity Dashboard in Excel
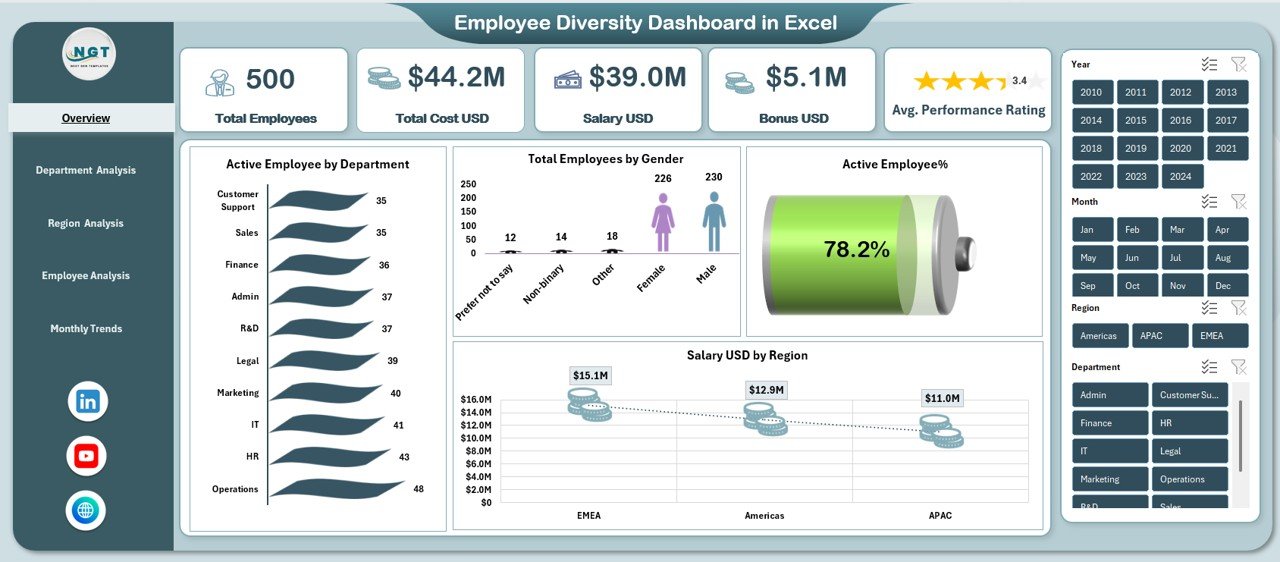
📊 Executive-Level Overview Dashboard
Quickly track total employees, total cost USD, salary, bonuses, and average performance rating in one powerful snapshot.
👥 Gender & Workforce Composition Analysis
Visual employee distribution by gender, department, region, and nationality for instant diversity insights.
🌍 Department & Region-Wise Breakdown
Compare salary, bonuses, active employee percentage, and performance ratings across departments and locations.
📈 Monthly Trends Tracking
Monitor salary, bonus payouts, and active employee trends over time to spot patterns and seasonality.
🎯 Performance & Cost Visibility
Analyze performance ratings alongside compensation to support fair and data-driven HR decisions.
⚡ Fully Excel-Based & Easy to Use
No Power BI, no macros—just Excel with dynamic charts, KPIs, and structured sheets.
✅ What’s Inside the Employee Diversity Dashboard in Excel
📌 Overview Sheet
Shows Total Employees, Total Cost USD, Salary USD, Bonus USD, Average Performance Rating, gender split, department distribution, and salary by region.
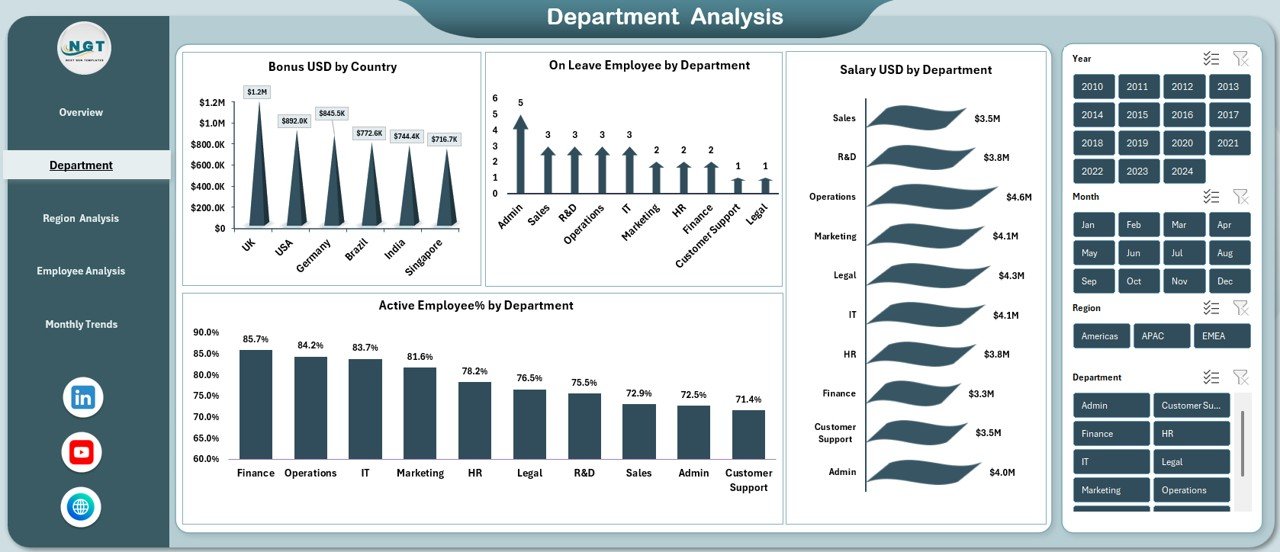
📌 Department Analysis Sheet
Tracks bonus by country, active employee percentage by department, employees on leave, and salary by department.
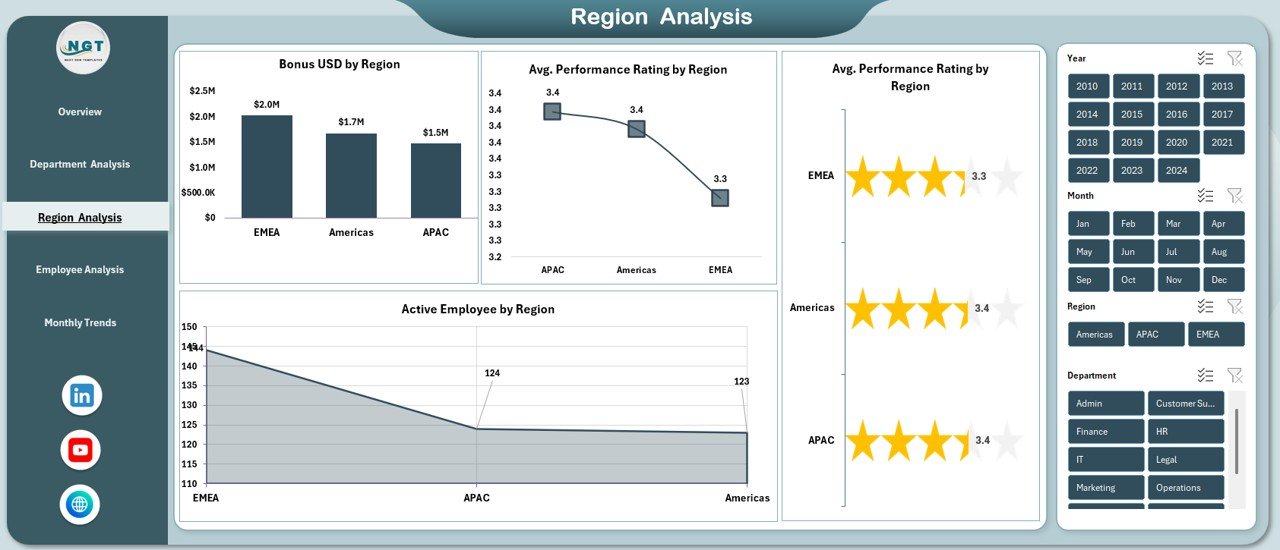
📌 Region Analysis Sheet
Highlights bonus by region, active employees by location, and average performance rating by region.
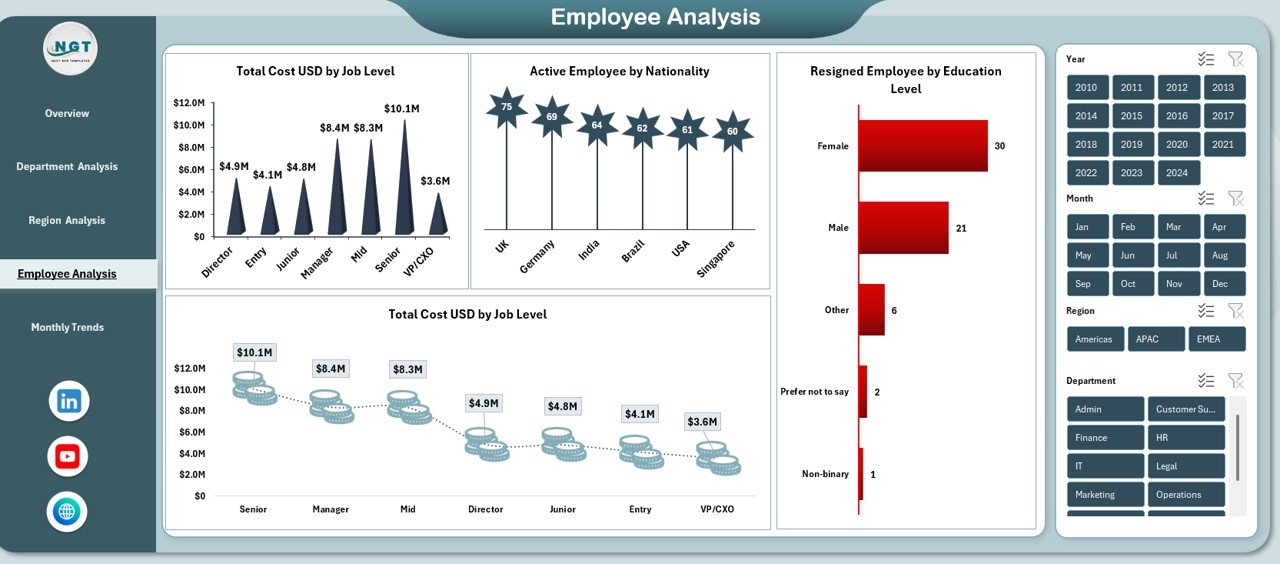
📌 Employee Analysis Sheet
Deep-dive analysis of total cost by job level, employee nationality distribution, and resignations by education level.
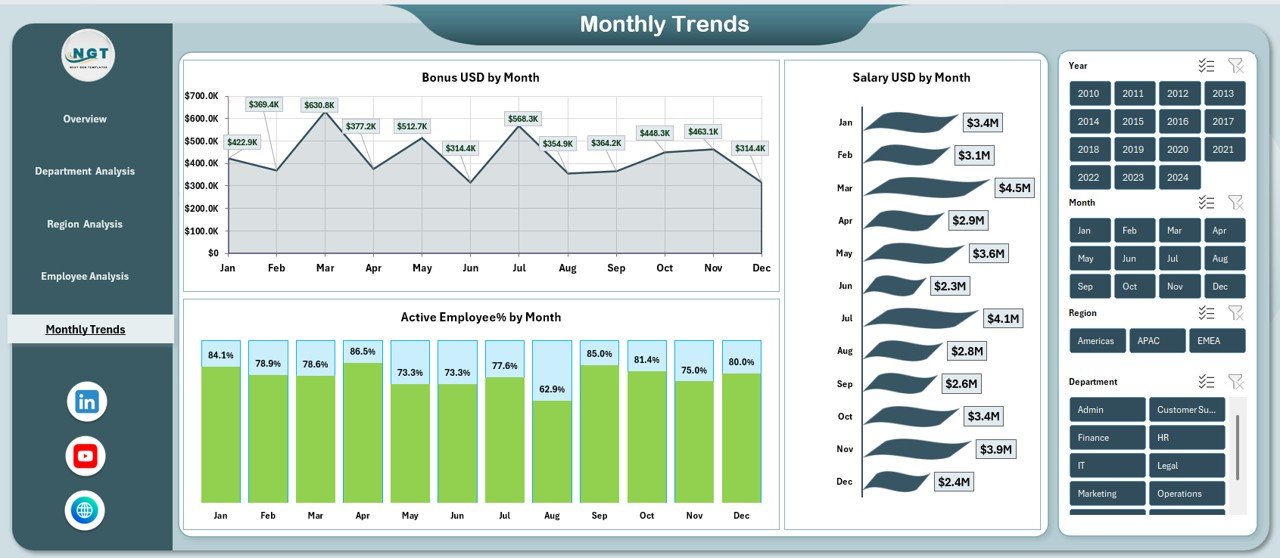
📌 Monthly Trend Sheets
Time-based insights for bonus USD, salary USD, and active employee percentage by month.
Each sheet works together to give HR teams a complete diversity intelligence system inside Excel.
✅ How to Use the Employee Diversity Dashboard in Excel
🧩 Step 1: Enter or update your employee data in the data sheet
📂 Step 2: Refresh calculations (if needed)
🎛️ Step 3: Use slicers, filters, and charts to analyze diversity
📊 Step 4: Share insights with leadership or HR teams
🎯 Step 5: Use trends to support inclusion, engagement, and workforce planning
No technical skills required—anyone familiar with Excel can start using it immediately.
✅ Who Can Benefit from This Employee Diversity Dashboard
👔 HR Managers & HR Analysts
📈 Business & People Analytics Teams
🏢 Corporate HR Departments
🌐 Multi-location & Global Organizations
📋 Compliance & Audit Teams
🚀 Startups, SMBs & Large Enterprises
If you manage people data and care about inclusion, visibility, and fair decision-making—this dashboard is built for you.
🔗 Click here to read the detailed blog post
Watch the step-by-step video tutorial:
👉 Visit our YouTube channel to learn step-by-step video tutorials
🔗 YouTube.com/@PKAnExcelExpert


Reviews
There are no reviews yet.