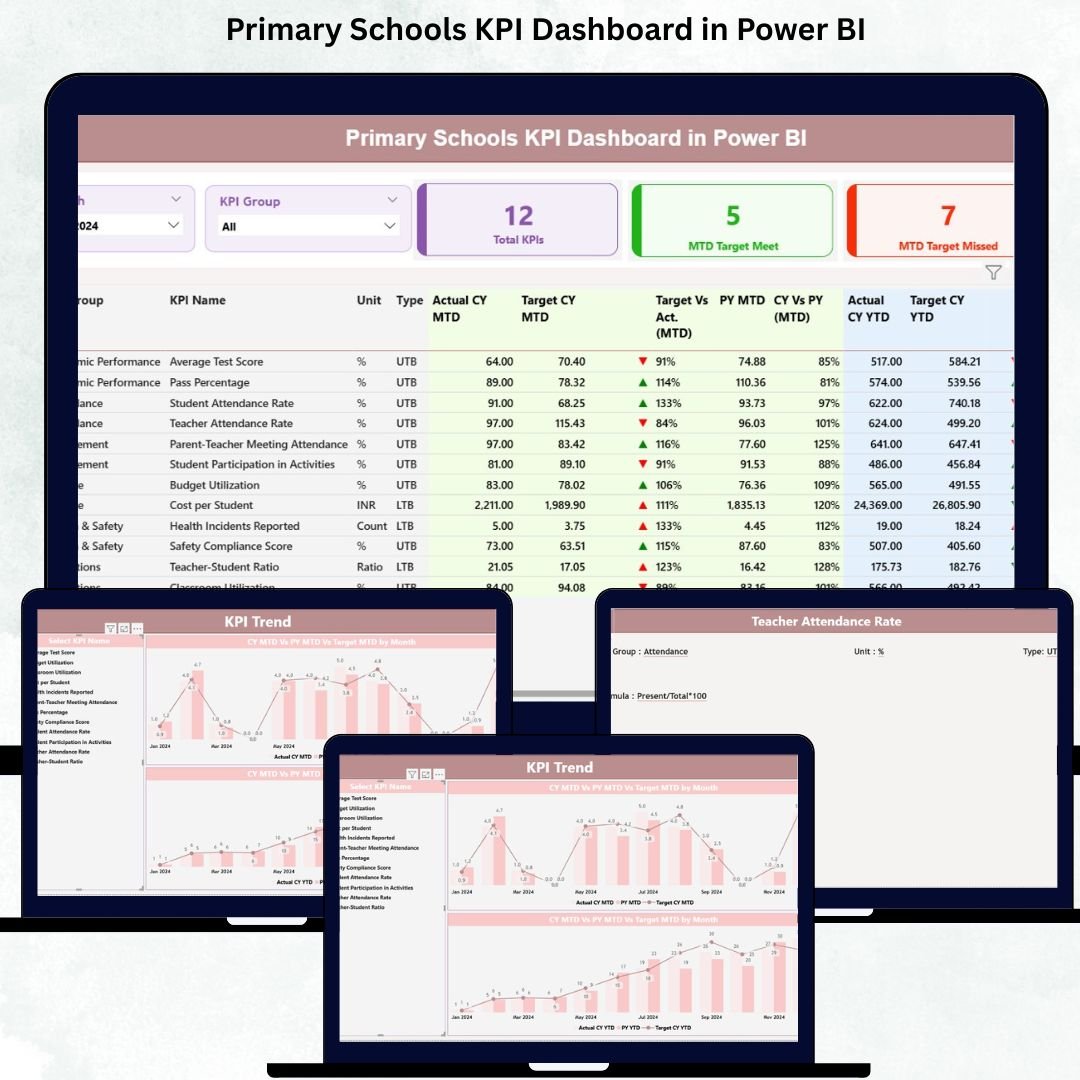
Managing a primary school becomes dramatically easier when you can see every key performance indicator (KPI) in one place—academics, attendance, teacher performance, student well-being, and operational efficiency. Our Primary Schools KPI Dashboard in Power BI is a powerful, ready-to-use solution that transforms raw Excel data into clear, meaningful, and action-driven insights. Whether you are a principal, administrator, or academic coordinator, this dashboard helps you make accurate decisions faster, improve school performance, and maintain complete transparency.
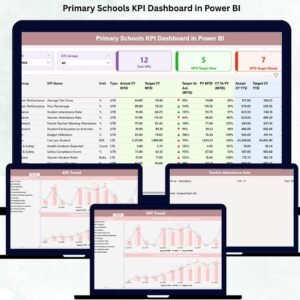
Built on top of an Excel data source, this dashboard updates automatically every time you refresh the file—making it the perfect tool for schools that want clarity without technical complexity. With three professionally designed pages (Summary, KPI Trend, and KPI Definition), your entire school performance becomes visible in just a few clicks.
✨ Key Features of the Primary Schools KPI Dashboard in Power BI
📊 3 Ready-to-Use Dashboard Pages
The template includes:
-
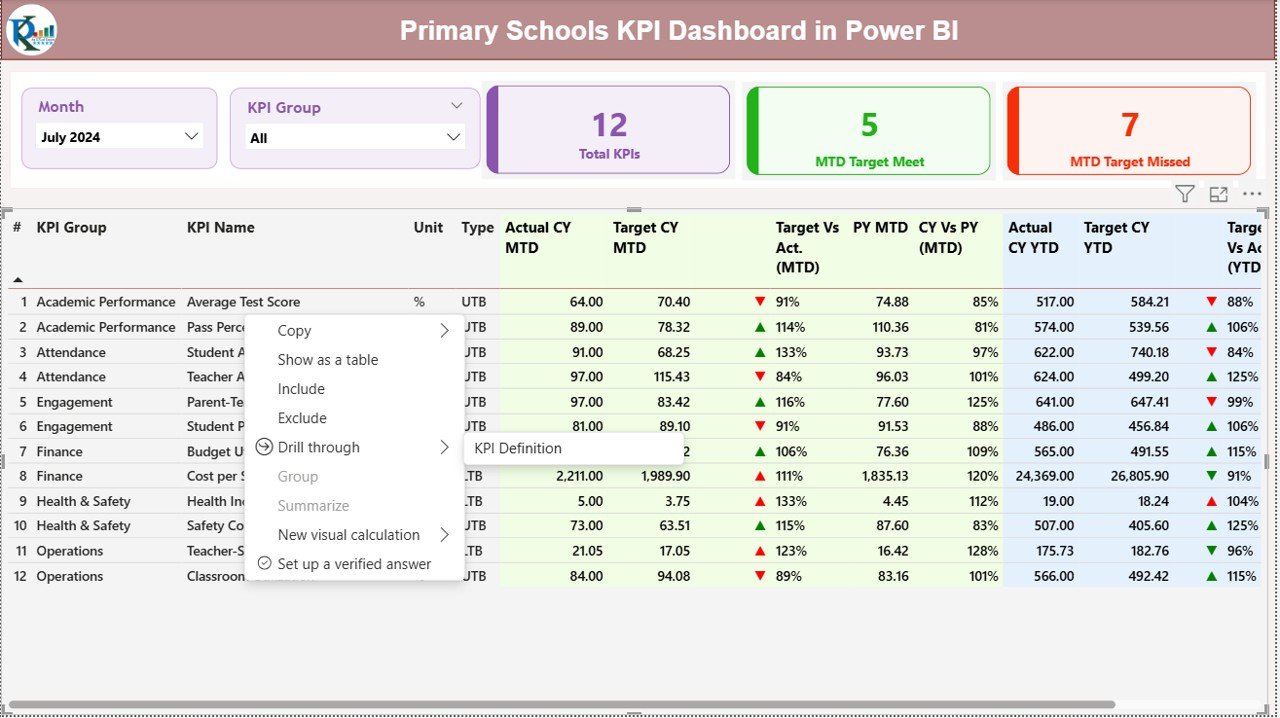
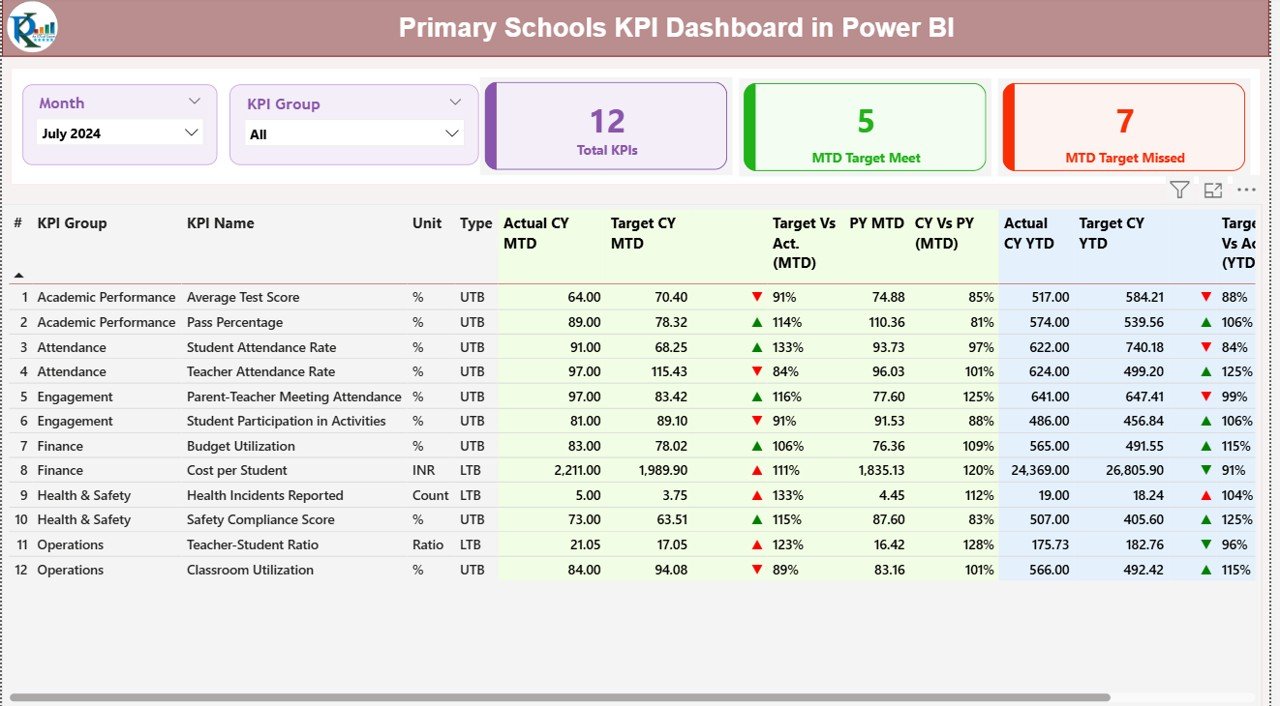
Summary Page
-
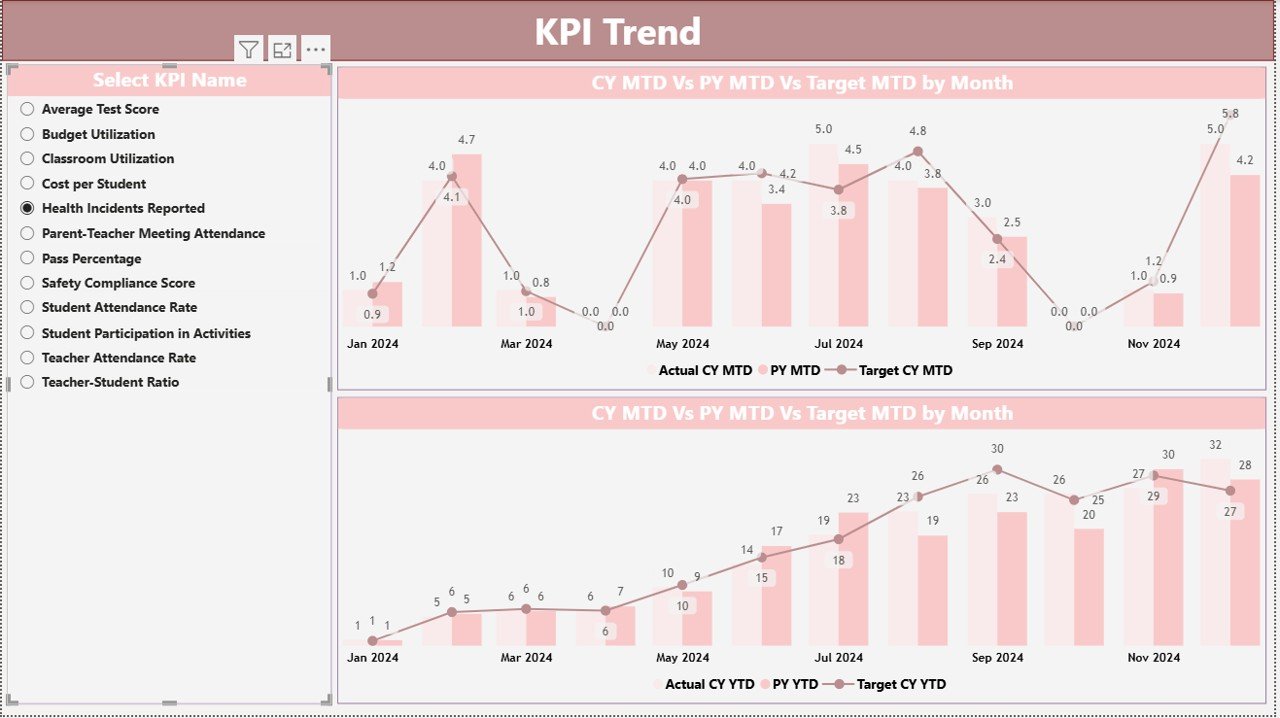
KPI Trend Page
-
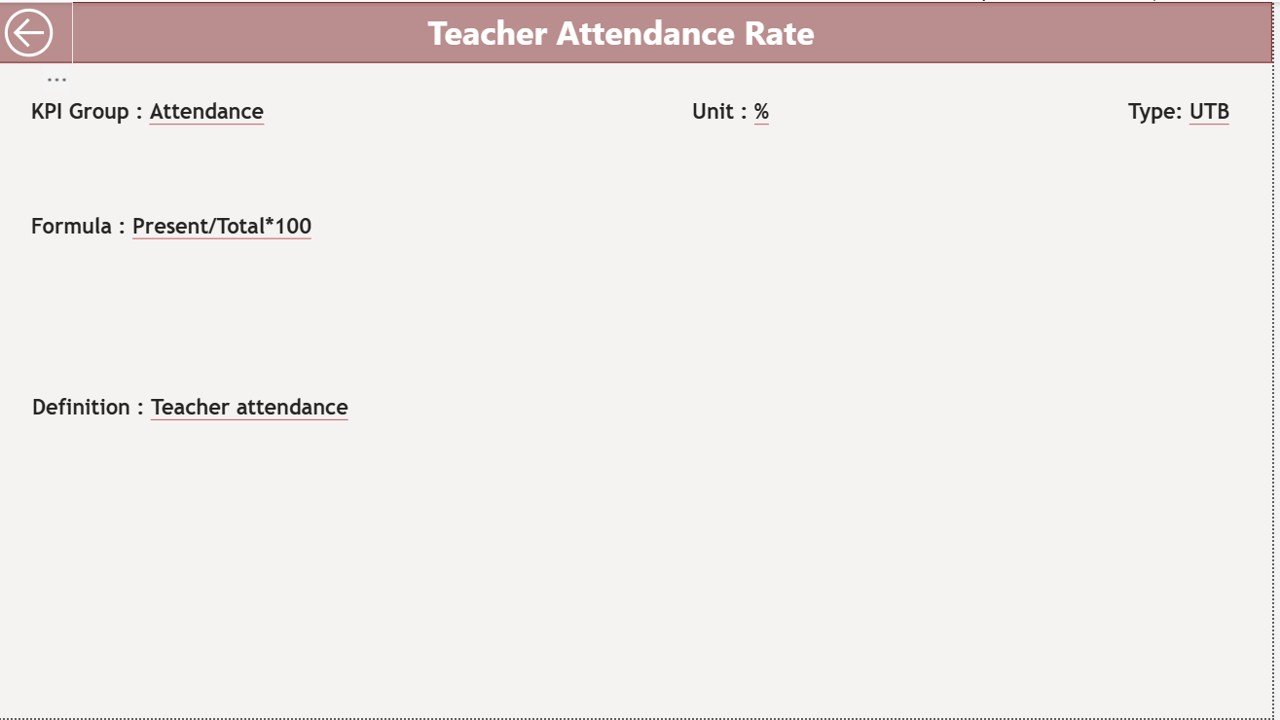
KPI Definition Page
Each page simplifies monitoring, comparison, and understanding of KPIs.
📅 Month & KPI Group Slicers
Switch between months effortlessly and filter KPIs by Academic, Attendance, Teacher, Administrative, or Student Support categories.
📈 Automatic MTD & YTD Analysis
View Month-to-Date and Year-to-Date Actual vs Target in real-time.
🟩 Status Icons (▲ / ▼)
Green and red icons instantly show whether KPIs met or missed targets.
📘 Excel-Driven Data Source
No complex integrations—just update your Excel file and refresh Power BI.
📦 What’s Inside the Primary Schools KPI Dashboard
This digital product includes everything you need to start monitoring performance immediately:
📁 Power BI Desktop File (.PBIX)
Fully designed dashboard with slicers, KPI cards, trend charts, and drill-through definitions.
📊 Excel Data File (with 3 sheets):
-
Input_Actual – Monthly MTD/YTD values
-
Input_Target – Monthly MTD/YTD targets
-
KPI Definition – KPI Number, Name, Group, Unit, Formula, Type (UTB/LTB)
📄 Documentation (PDF Guide)
Explains how to update data, refresh visuals, and manage KPIs.
🛠️ How to Use the Primary Schools KPI Dashboard
1️⃣ Update Your Excel File
Simply add or modify values in:
-
Input_Actual
-
Input_Target
-
KPI Definition
2️⃣ Open the Power BI File
Click Refresh, and the dashboard updates automatically.
3️⃣ Use Filters & Slicers
Choose the month or KPI Group to view targeted insights.
4️⃣ Analyze KPI Trends
Use the KPI Trend Page to compare:
-
CY vs PY
-
Actual vs Target
-
MTD vs YTD
5️⃣ Drill Through to KPI Details
Understand formulas, definitions, and purpose of each KPI.
🎯 Who Can Benefit from This KPI Dashboard
🏫 School Principals
Monitor academic performance, teacher efficiency, and operational KPIs instantly.
📘 Academic Coordinators
Identify gaps in classroom performance and student learning.
👩🏫 Teachers & Department Heads
Track attendance rates, homework completion, student engagement, etc.
📊 Administrators
Review operational KPIs and streamline school processes.
🏢 School Management Committees
Make data-backed decisions to improve education quality.
### Click here to read the Detailed blog post
Watch the step-by-step video tutorial:


Reviews
There are no reviews yet.