
Managing hedge funds requires razor-sharp accuracy, real-time performance tracking, and complete visibility into risks, returns, and market behavior. But when investment teams rely on scattered spreadsheets or slow manual reports, decision-making becomes delayed and unclear. That’s why the Hedge Funds KPI Dashboard in Power BI is designed to simplify everything — giving fund managers, analysts, risk teams, and leadership a powerful way to monitor performance in seconds.
This ready-to-use dashboard transforms raw financial data into interactive charts, trend visuals, KPI scorecards, and drill-through details. You can track profitability, risk exposure, liquidity, volatility, AUM growth, strategy KPIs, and performance comparisons — all in a clean, dynamic layout. Whether you analyze multiple funds or manage a single portfolio, this Power BI dashboard helps you make faster, smarter, and more confident investment decisions.
⭐ Key Features of the Hedge Funds KPI Dashboard in Power BI
✨ All-In-One Summary Page
Get a consolidated view of all hedge fund KPIs — performance, risk, liquidity, operations, and strategy metrics.
📅 Month Slicer for Quick Navigation
Select any month and watch the entire dashboard instantly update with real performance numbers.
🎯 KPI Group Filters
Switch between Profitability KPIs, Liquidity KPIs, Risk KPIs, AUM KPIs, and Operational KPIs with one click.
📊 MTD & YTD Performance Scorecards
Track Month-to-Date and Year-to-Date performance with icons that show ▲ (met target) or ▼ (missed target).
📈 Trend Visualization Page
Two powerful combo charts highlight monthly and yearly trends for any KPI you select.
📘 Drill-Through KPI Definition Page
Understand the logic, formula, and definition behind each metric — ideal for audits, reviews, and training.
🧩 Excel-Driven Data Source
Simply update Actuals, Targets, and KPI Definitions in Excel and refresh the report — everything updates automatically.
📌 No Coding Required
Power BI handles all calculations, comparisons, and visualizations for you.
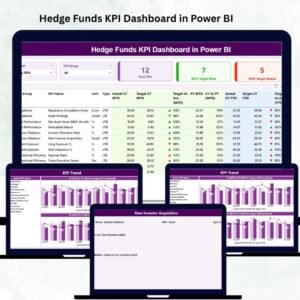
⭐ What’s Inside the Hedge Funds KPI Dashboard in Power BI
This dashboard includes three high-performance pages, each crafted to support daily investment operations.
📌 1. Summary Page – Your Main Control Center

This is the core of the dashboard — designed for fast analysis and quick action.
You get:
-
Month Selector
-
KPI Group Selector
-
KPI Cards showing:
✓ Total KPIs
✓ MTD Target Met
✓ MTD Target Missed
Below these cards is a fully detailed KPI table displaying:
-
KPI Number
-
KPI Group
-
Unit (USD, %, Ratio, Days)
-
KPI Type (UTB/LTB)
-
Actual MTD vs Target MTD
-
MTD Icons & Achievement %
-
CY vs PY (MTD) trend
-
Actual YTD vs Target YTD
-
YTD Icons & Achievement %
-
CY vs PY (YTD) comparison
This page lets you instantly understand where your hedge fund stands today.
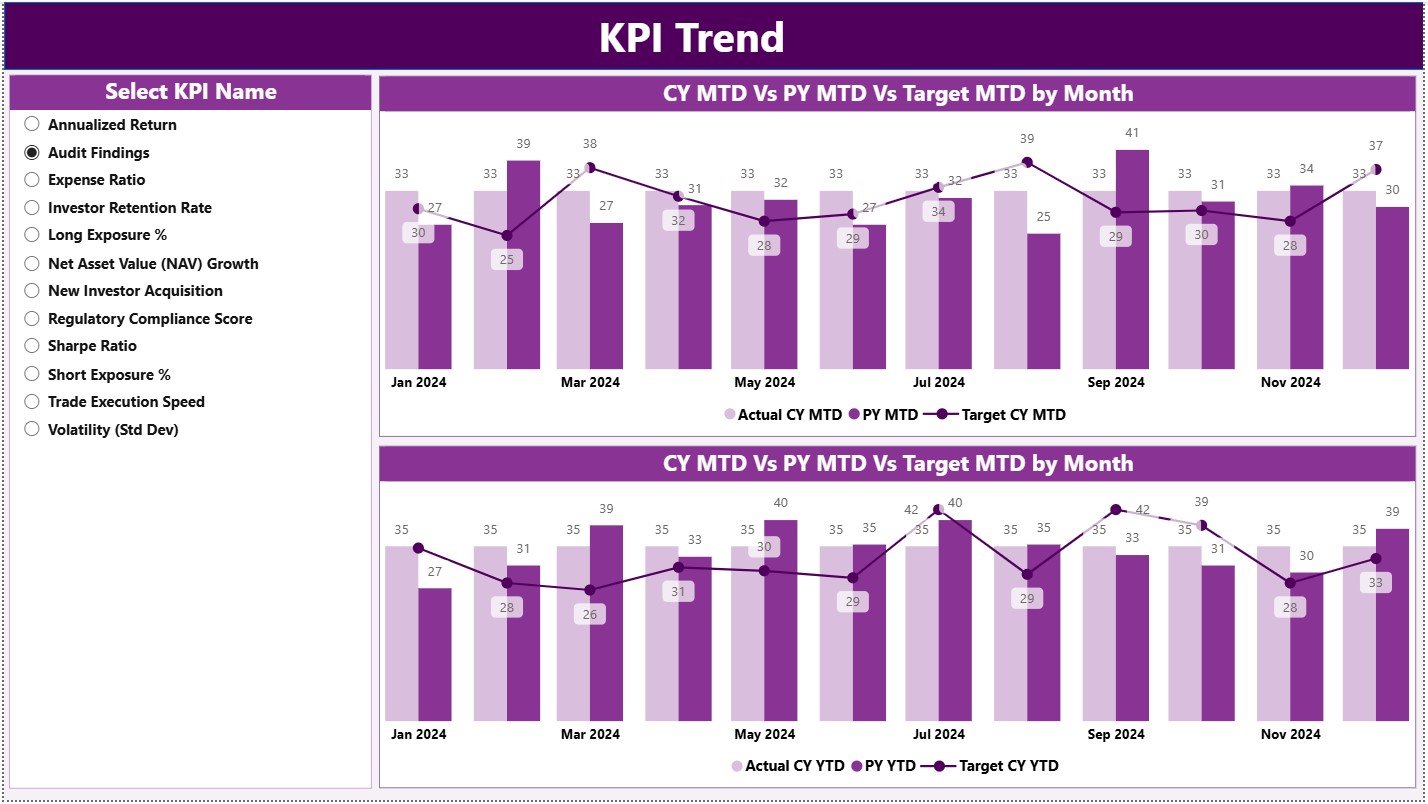
📌 2. KPI Trend Page – The Full Performance Journey
This page focuses on long-term analysis, helping you track patterns and deviations.
It includes two trend charts:
📈 MTD Trend Chart
Shows CY MTD, PY MTD & MTD Targets
📉 YTD Trend Chart
Shows CY YTD, PY YTD & YTD Targets
Using the KPI Name Slicer, you can explore trends for:
-
Sharpe Ratio
-
Net Return (%)
-
Drawdown %
-
AUM Growth
-
Portfolio Liquidity
-
Market Risk Exposure
-
Client Redemption Ratio
This page is ideal for investment reviews, risk analysis, and performance strategy meetings.
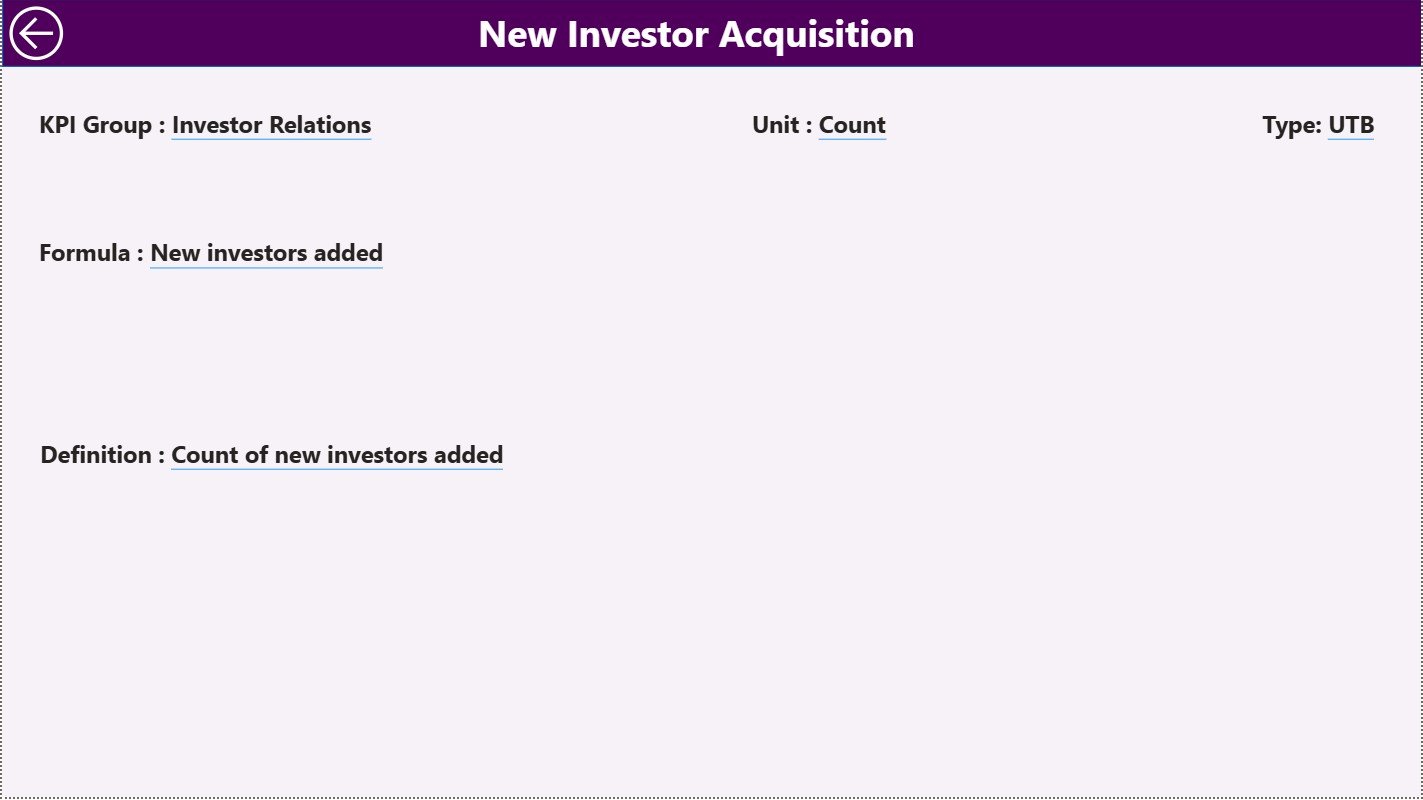
📌 3. KPI Definition Page – Complete KPI Documentation
This hidden drill-through page provides clarity for every KPI:
-
KPI Name
-
KPI Group
-
Unit
-
Formula
-
KPI Definition
-
Type (UTB/LTB)
-
Sequence Number
This keeps your analytics fully transparent and standardized.
⭐ How to Use the Hedge Funds KPI Dashboard in Power BI
Using this dashboard is extremely simple:
🟦 Step 1: Update Actuals (MTD/YTD) in the Input Actual sheet
🟦 Step 2: Enter monthly targets in the Input Target sheet
🟦 Step 3: Add or update KPI definitions
🟦 Step 4: Open Power BI & click Refresh
🟦 Step 5: Use filters to explore KPIs by month or category
🟦 Step 6: Check trends using the KPI Trend Page
🟦 Step 7: Drill through to KPI details when needed
No technical experience is required — Power BI handles everything.
⭐ Who Can Benefit from This Hedge Funds KPI Dashboard
This dashboard is designed for:
💼 Fund Managers – Track performance & compare strategy results.
📊 Investment Analysts – Monitor KPIs daily and analyze trends.
🛡 Risk Teams – Identify volatility & risk exposure instantly.
📈 Portfolio Managers – Compare fund performance vs targets.
📁 Compliance Teams – Use KPI definitions for transparent reporting.
👨💼 Senior Leadership – Get a complete view of fund health for decision-making.
Whether you manage multi-fund portfolios or single-strategy hedge funds, this dashboard gives you unmatched clarity and control.


Reviews
There are no reviews yet.