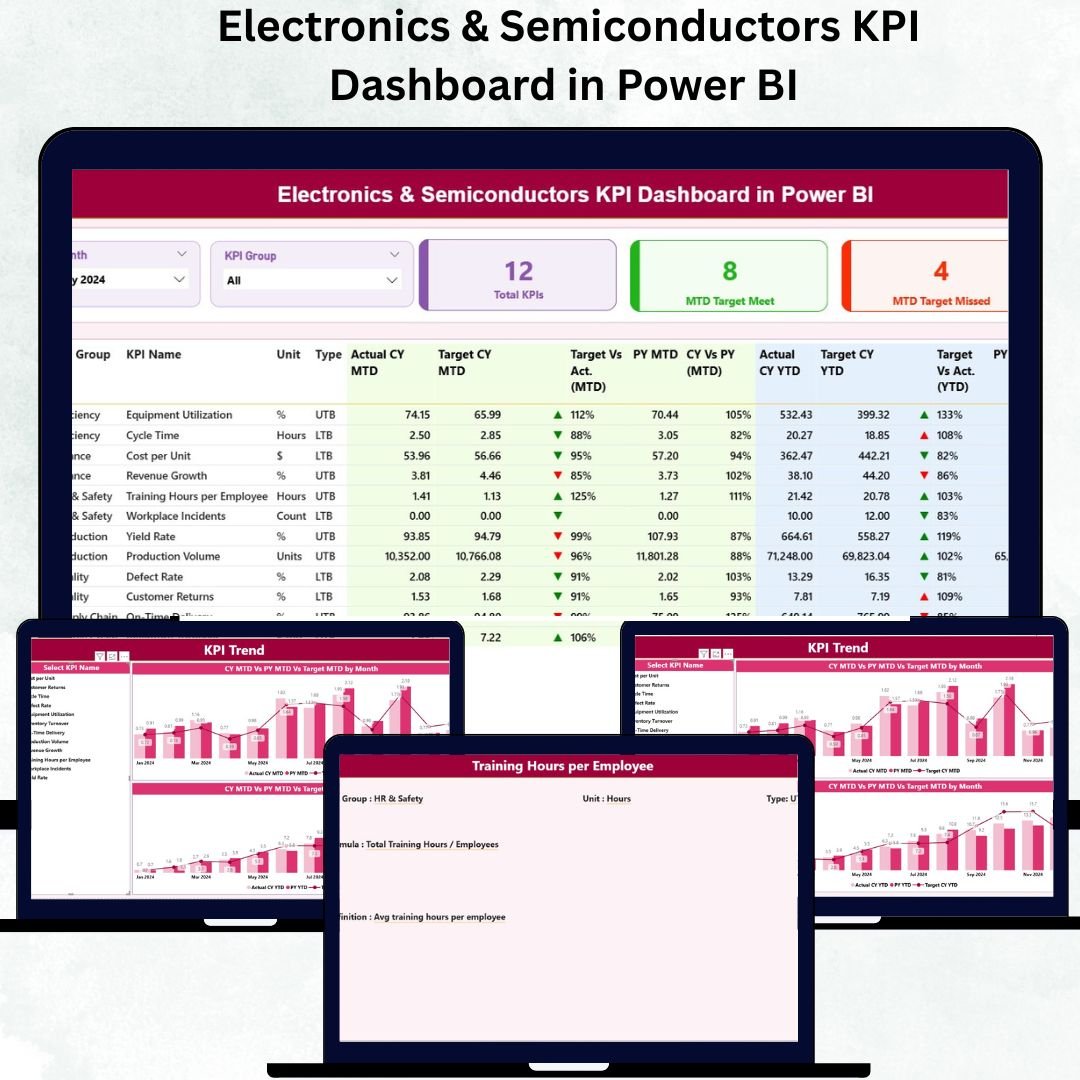
In the fast-paced world of electronics and semiconductors, success depends on precision, performance, and agility. From chip manufacturing to component distribution, every decision must be backed by data. The Electronics & Semiconductors KPI Dashboard in Power BI gives you that data-driven edge — transforming complex metrics into powerful, interactive insights.
This ready-to-use Power BI dashboard enables businesses to monitor production efficiency, defect rates, cycle times, and on-time deliveries in real time. Designed for manufacturers, analysts, and operations leaders, it helps you track key KPIs across departments, identify inefficiencies, and make faster, smarter business decisions.
Built with Microsoft Power BI, this dashboard integrates seamlessly with Excel and other data sources to automate updates, visualize trends, and measure progress at every level — from plant floors to executive boardrooms.
⚙️ Key Features of the Electronics & Semiconductors KPI Dashboard in Power BI
📊 Three Interactive Pages – Summary Page, KPI Trend Page, and KPI Definition Page.
🎯 MTD & YTD Comparisons – Track Month-to-Date and Year-to-Date results instantly.
📅 Dynamic Filters – Filter by Month, KPI Group, Department, or Plant.
📈 Real-Time Visualization – Automatically refresh data for up-to-date insights.
💡 Color-Coded Indicators – Green and red arrows clearly show performance trends.
📘 Linked Excel Data Source – Structured sheets for Actual, Target, and Definitions.
🔍 Drill-Through Functionality – Explore KPI definitions, formulas, and metadata with a click.
⚙️ Customizable Dashboard – Add or modify KPIs as your operations evolve.
💻 Department-Wise Analysis – Separate performance tracking for Production, Quality, and Supply Chain.
📤 Ready for Reports – Export visuals directly for management presentations.
🧭 What’s Inside the Electronics & Semiconductors KPI Dashboard
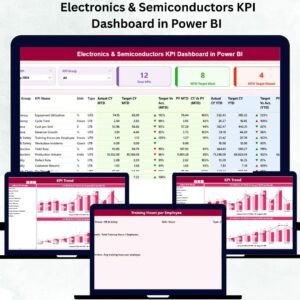
⚡ 1️⃣ Summary Page – Real-Time Overview
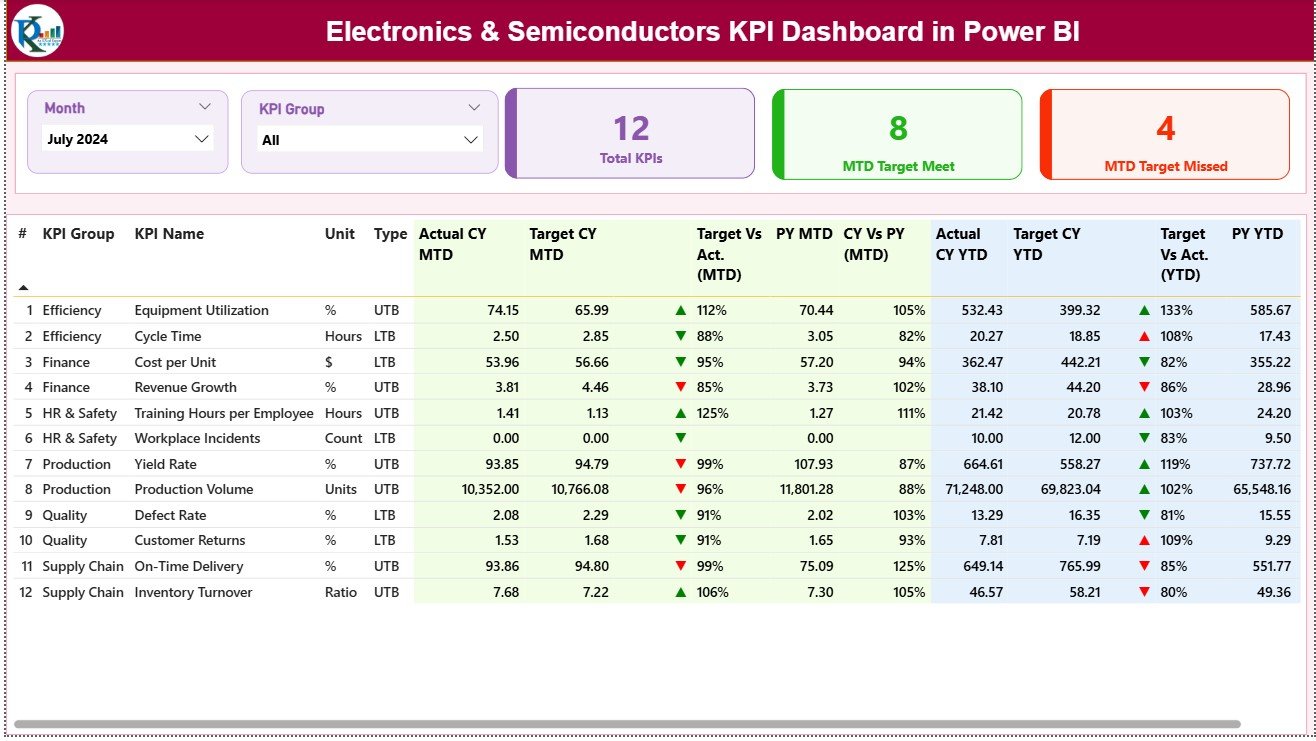
The Summary Page is the main control center for performance monitoring.
-
Two slicers at the top (Month & KPI Group) let users instantly filter data.
-
Summary Cards display:
✅ Total KPI Count
✅ MTD Target Met
✅ MTD Target Missed
Below, a detailed table shows:
-
KPI Group, KPI Name, Unit, Type (UTB/LTB)
-
Actual vs Target (MTD & YTD)
-
Previous Year comparisons
-
Trend indicators (▲ for improvement, ▼ for decline)
📈 This gives leaders a clear view of which KPIs are on track, which are lagging, and where intervention is needed.
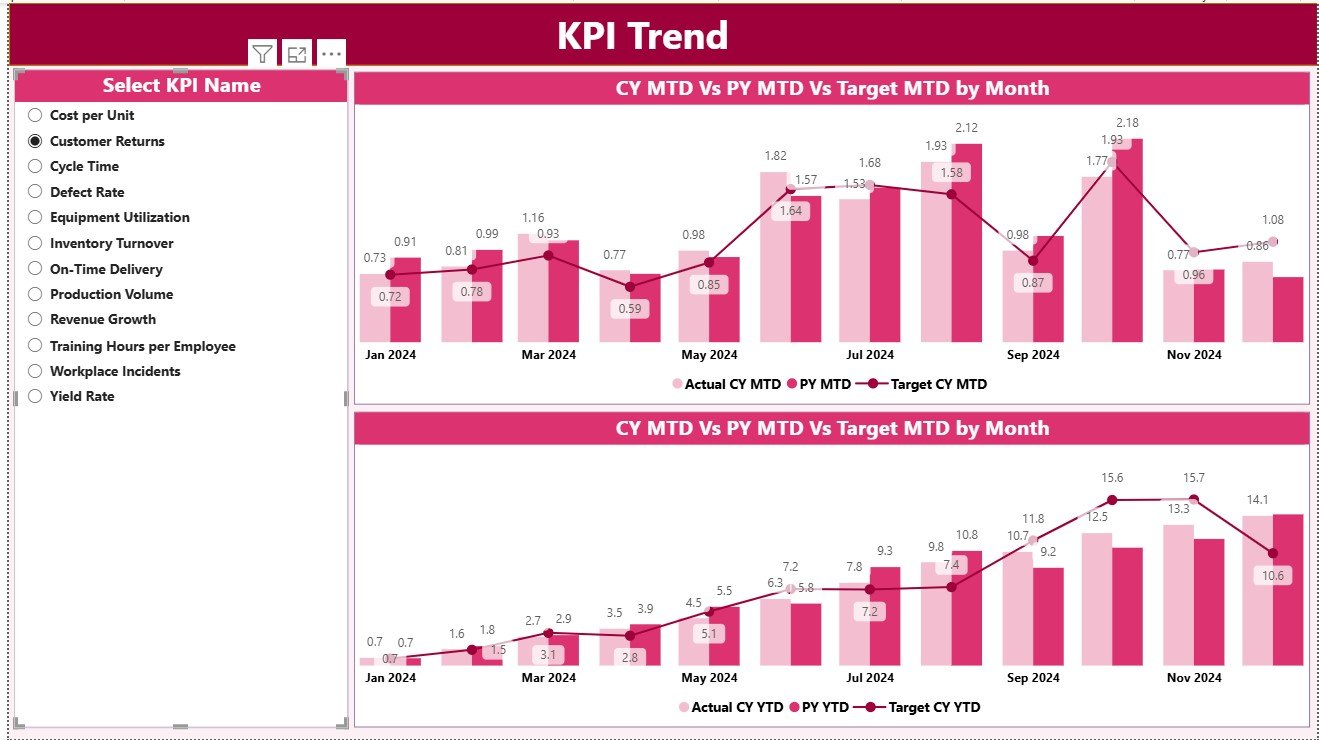
📊 2️⃣ KPI Trend Page – Deep Dive into Performance
Analyze trends and patterns over time for each KPI.
-
Choose a KPI name from the slicer to focus your analysis.
-
MTD Chart: Compare actual vs target vs last year, month by month.
-
YTD Chart: Evaluate cumulative yearly progress.
This helps managers identify improvement patterns, detect early warning signs, and forecast outcomes with precision.
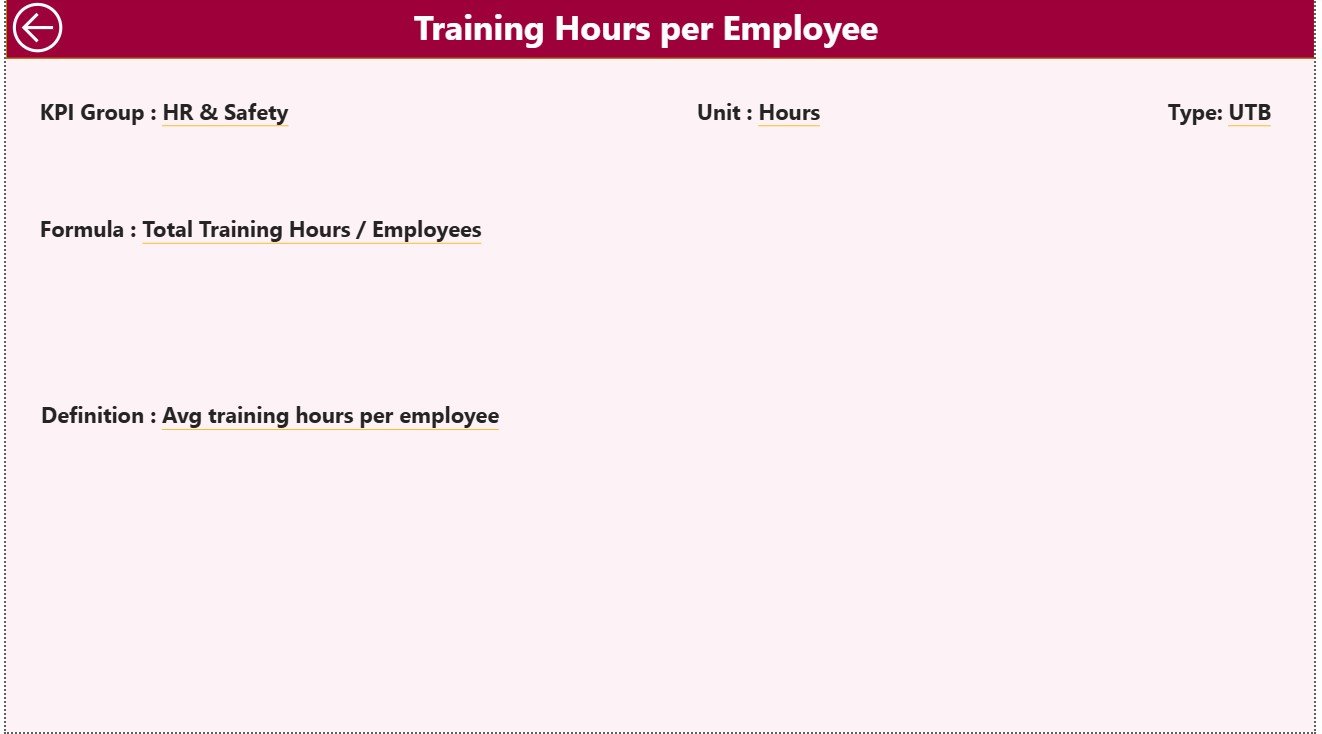
📘 3️⃣ KPI Definition Page – The Knowledge Base
A detailed drill-through view containing:
-
KPI Formula and Definition
-
Unit and Type (Upper/Lower the Better)
-
Associated Metadata
🔙 Includes a Back Button to return to the main page quickly.
This transparency ensures every KPI is clearly understood across teams.
💾 Excel Data Integration
The dashboard connects to a structured Excel file with three key sheets:
-
Input Actual: Monthly and yearly actuals.
-
Input Target: MTD and YTD targets for comparison.
-
KPI Definition: Master reference sheet with KPI details.
This setup ensures accurate, automated calculations for consistent and reliable reporting.
💡 Key KPIs for the Electronics & Semiconductor Industry
🔹 Production Yield Rate (%) – Measures efficiency and output quality.
🔹 Defect Rate (%) – Tracks quality performance.
🔹 Cycle Time (hrs) – Measures manufacturing speed.
🔹 Equipment Utilization (%) – Evaluates machine efficiency.
🔹 On-Time Delivery (%) – Monitors supply chain reliability.
🔹 Material Scrap Rate (%) – Identifies waste levels.
🔹 Inventory Turnover Ratio – Tracks stock management efficiency.
🔹 Downtime Hours – Measures operational reliability.
🔹 Cost per Unit (USD) – Evaluates cost-effectiveness.
These KPIs help organizations stay competitive, optimize output, and maximize profitability.
🌟 Advantages of Using This Power BI Dashboard
✅ Real-Time Insights – Monitor performance instantly with live data refresh.
✅ End-to-End Visibility – See production, logistics, and quality data in one place.
✅ Error-Free Analytics – Eliminate manual reporting and human error.
✅ Predictive Power – Spot trends early and take proactive measures.
✅ Cross-Department Transparency – Align production, engineering, and supply teams.
✅ Scalable Design – Easily expand for new KPIs, regions, or product lines.
✅ Executive-Level Presentation – Impress stakeholders with visual, interactive reporting.
⚙️ Best Practices for Effective Usage
📌 Verify Excel data before refreshing Power BI.
📌 Maintain consistent KPI naming and unit formats.
📌 Automate data refresh schedules.
📌 Restrict access based on user roles for data security.
📌 Review and update KPI definitions quarterly.
📌 Focus on actionable KPIs that drive real business outcomes.
👥 Who Can Benefit from This Dashboard
🏭 Manufacturing Managers – Track production yield and efficiency.
🔬 Quality Control Teams – Monitor defect rates and downtime.
🚚 Supply Chain Leaders – Measure on-time delivery and material waste.
💡 Executives & Analysts – Access real-time insights for strategic decisions.
⚙️ Engineering Teams – Optimize equipment utilization and process flow.


Reviews
There are no reviews yet.