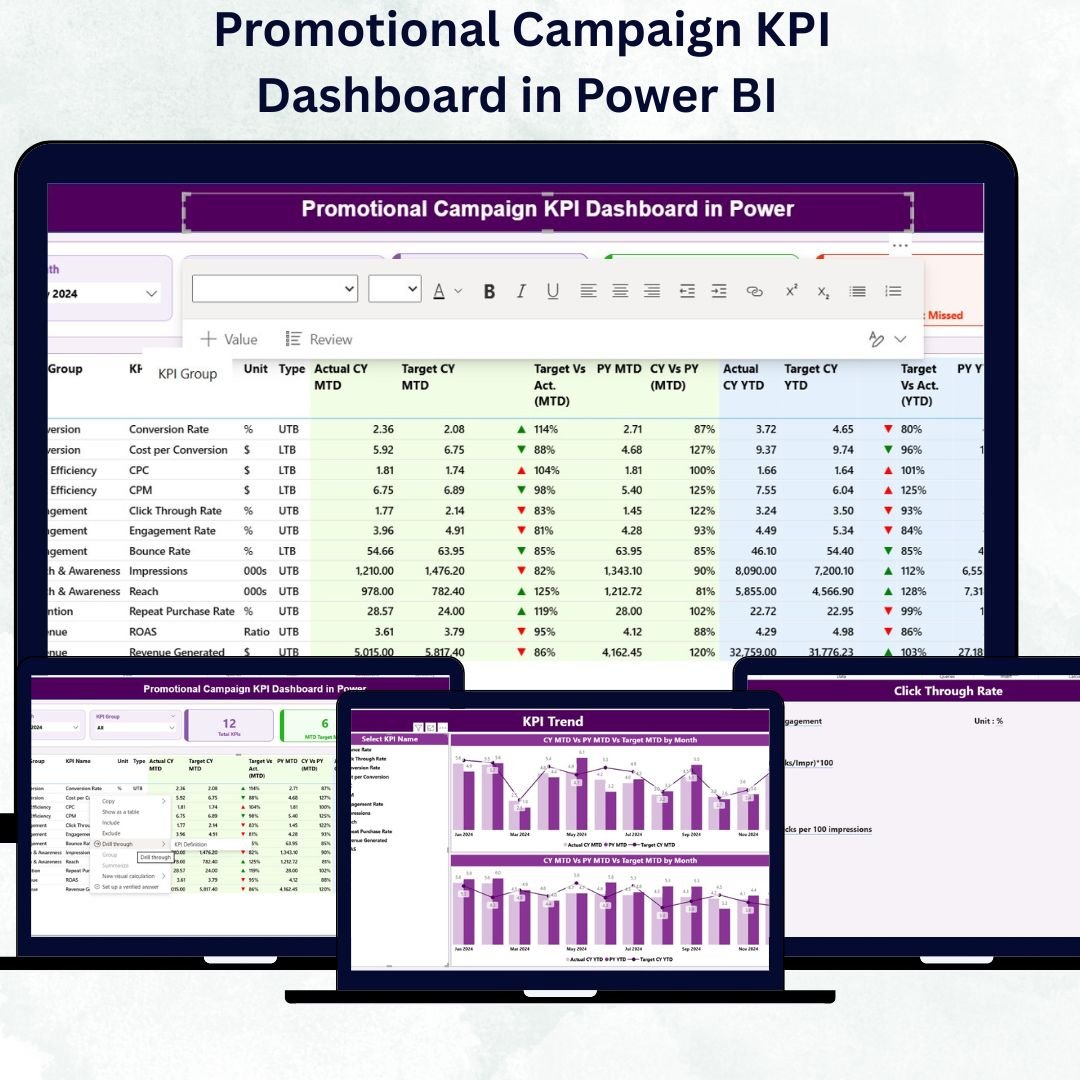
In today’s fast-paced marketing world, businesses can’t afford to waste a single dollar on campaigns that don’t perform. The Promotional Campaign KPI Dashboard in Power BI is your ultimate solution for tracking, analyzing, and optimizing every promotional effort — all in one dynamic, data-driven platform. 🚀Promotional Campaign KPI Dashboard in Power BI
This ready-to-use Power BI dashboard transforms raw marketing data into stunning visuals and actionable insights, giving you complete visibility into campaign performance, ROI, and engagement metrics. Whether you’re managing social media promotions, email campaigns, or sales activations, this dashboard empowers you to make smarter, faster, and more confident decisions.
✨ Key Features of the Promotional Campaign KPI Dashboard in Power BI
📊 Comprehensive KPI Tracking – Monitor campaign KPIs such as CTR, conversion rate, ROI, engagement, and more across multiple channels.Promotional Campaign KPI Dashboard in Power BI
📅 Interactive Filters and Slicers – Slice data by Month and KPI Group to get precise, time-bound insights.
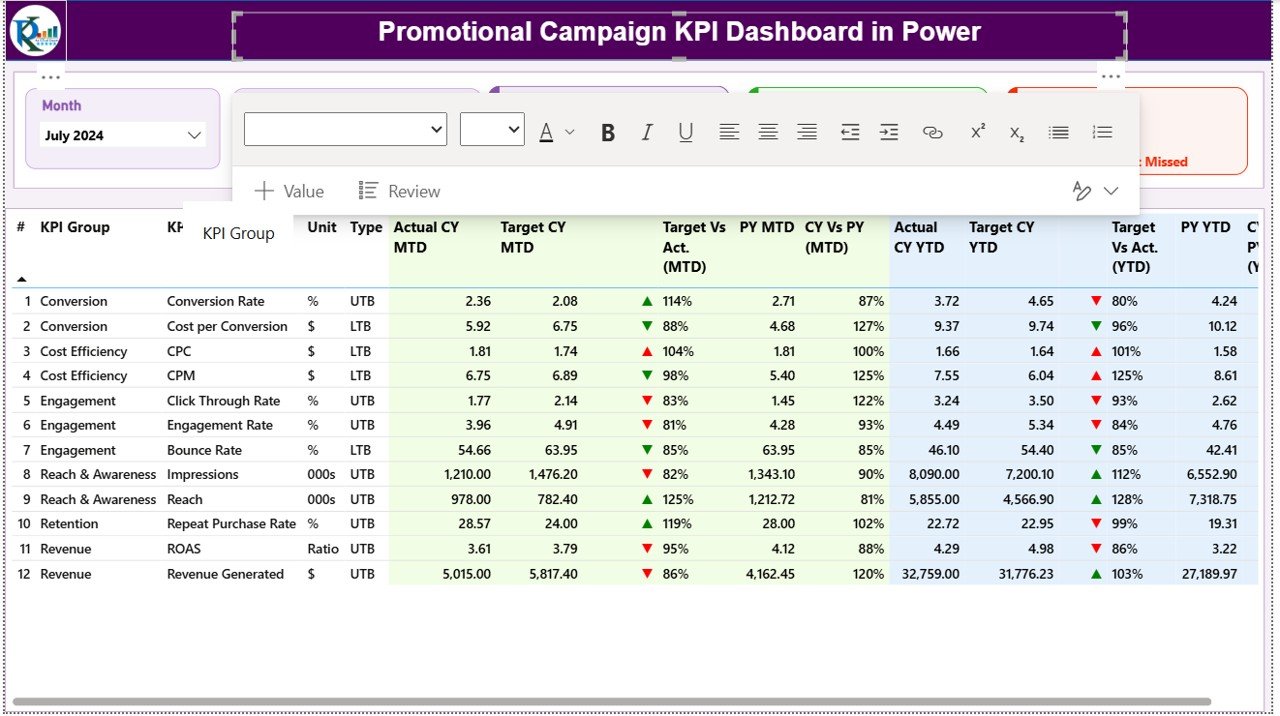
📈 Visual Performance Indicators – Instantly spot wins and gaps with dynamic green (▲) and red (▼) arrows showing MTD and YTD trends.
⚙️ Excel-Powered Backend – Update campaign data directly in Excel sheets for seamless automation in Power BI.
🔄 Real-Time Comparisons – Compare Current Year (CY) vs Previous Year (PY) performance to measure growth effectively.
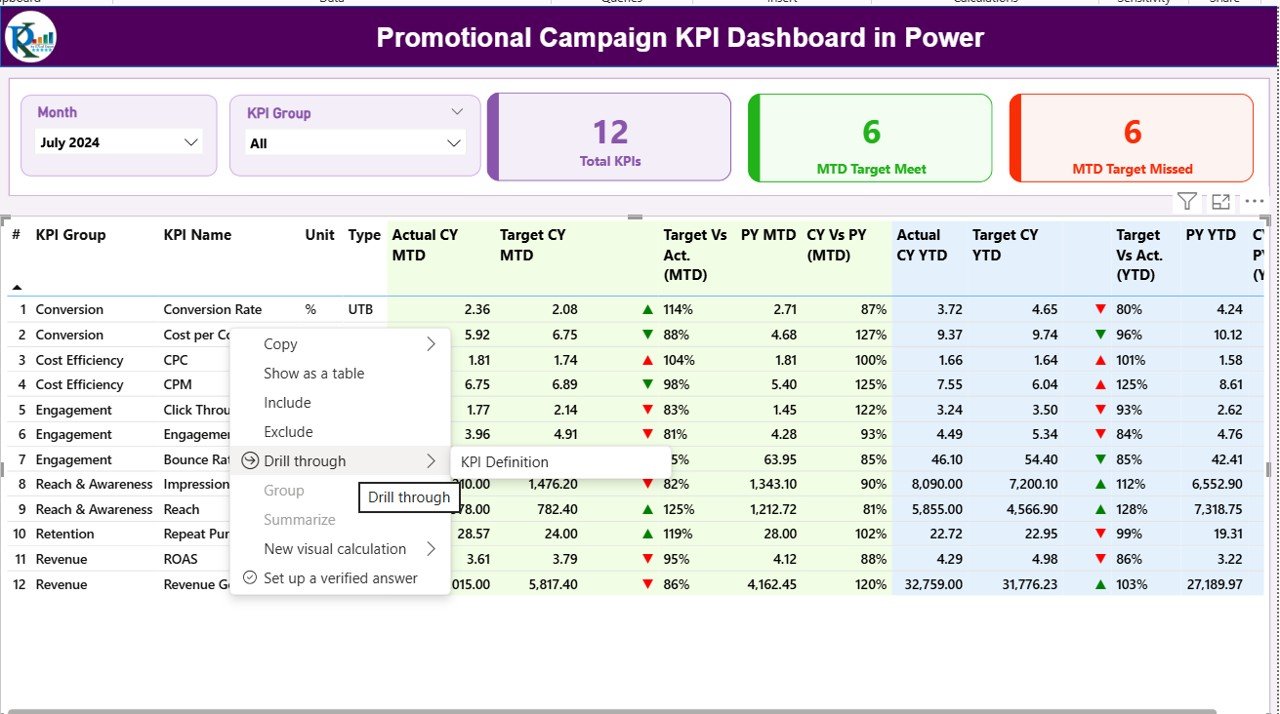
📑 Drill-Through KPI Details – Access detailed KPI formulas, definitions, and units at a single click using the KPI Definition Page.Promotional Campaign KPI Dashboard in Power BI
🧩 Fully Scalable Design – Add new KPIs or campaigns without breaking the dashboard structure.
📤 Publish and Share Easily – Share with your marketing, sales, or finance teams via Power BI Service for unified collaboration.
🧮 What’s Inside the Promotional Campaign KPI Dashboard in Power BI
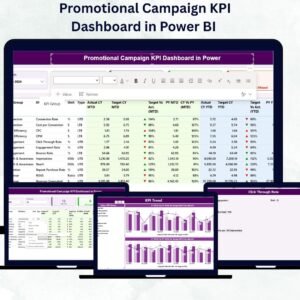
🖥️ 1. Summary Page:
The control center of your marketing analysis!
It showcases Total KPI Count, MTD Target Met, and Missed KPIs, along with detailed tables showing campaign status by KPI Group, KPI Name, and Type (UTB/LTB).
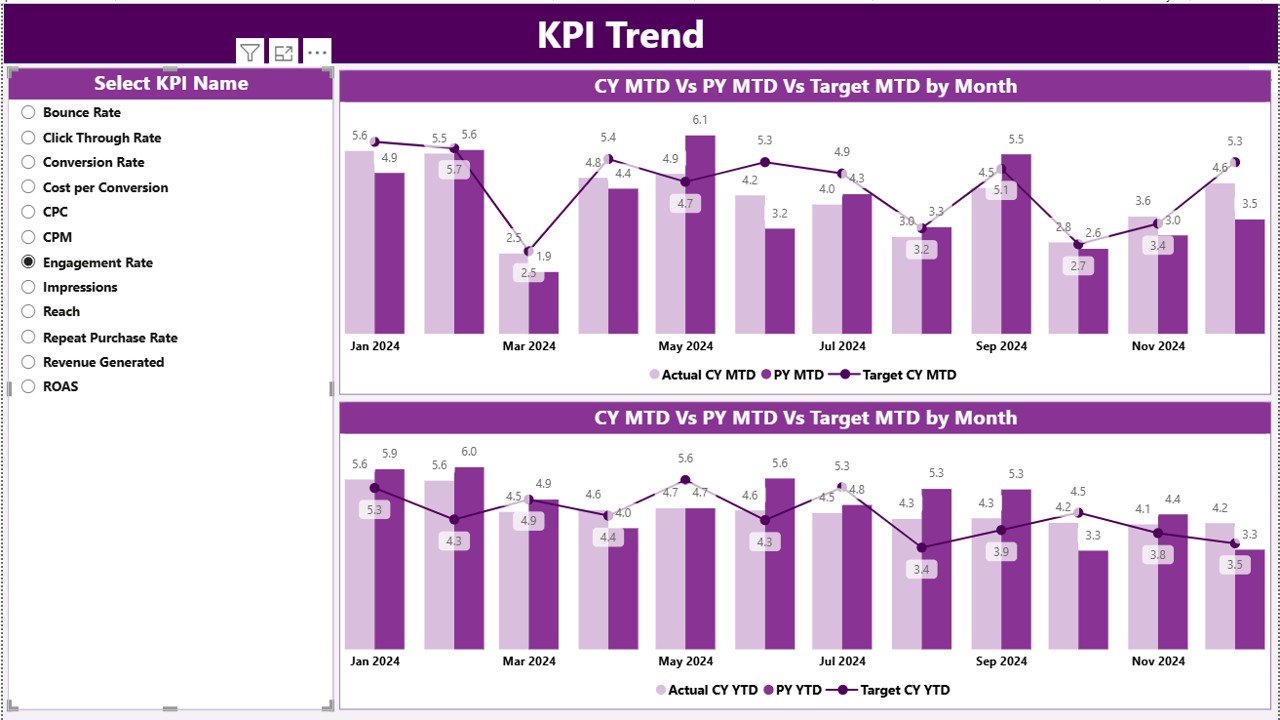
📉 2. KPI Trend Page:
Dive into trends and patterns with two combo charts — one for MTD and one for YTD performance. Visualize Actuals vs Targets side by side for real-time campaign evaluation.
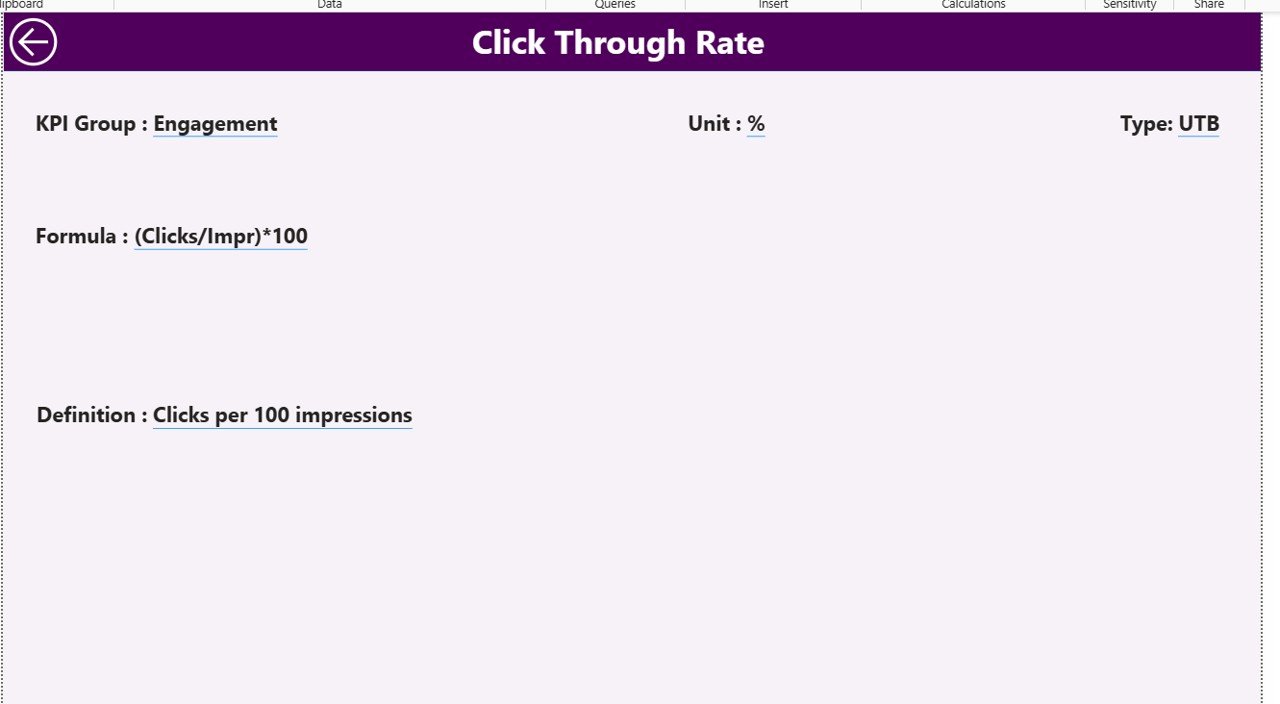
📋 3. KPI Definition Page:
A documentation-friendly sheet where you can view each KPI’s Formula, Definition, Unit, and Type — ensuring full transparency and standardization.
📗 Excel Data Source:
The foundation of the dashboard! It includes three sheets:
-
Input_Actual – Capture monthly actual data for each campaign KPI.
-
Input_Target – Record monthly and yearly target metrics.
-
KPI_Definition – Store all KPI-related metadata for smooth automation.
🧭 How to Use the Promotional Campaign KPI Dashboard in Power BI
1️⃣ Prepare Data in Excel – Enter Actual, Target, and Definition details in their respective sheets.
2️⃣ Import Data to Power BI – Use “Get Data” to load your Excel file.
3️⃣ Establish Relationships – Link your tables using common KPI fields.
4️⃣ Build Measures – Create DAX measures for Target vs Actual, MTD%, and YTD%.
5️⃣ Design Visuals – Add combo charts, cards, and slicers for clean visualization.
6️⃣ Format Indicators – Use green/red arrows for better clarity.
7️⃣ Publish Dashboard – Share insights instantly with your team via Power BI Service.
With this simple process, even non-technical users can maintain and enhance the dashboard effortlessly.
👥 Who Can Benefit from This Promotional Campaign KPI Dashboard
💼 Marketing Managers: Track campaign ROI, performance, and conversions in one place.
📣 Brand Strategists: Understand which channels drive the most engagement.
📊 Business Analysts: Access accurate, real-time visuals for performance reporting.
💰 Sales Teams: Align sales promotions with marketing performance data.
🏢 SMEs & Enterprises: From startups to large corporations, everyone can use this dashboard to make smarter marketing investments.


Reviews
There are no reviews yet.