In the fast-paced financial world, smart investors rely on data 📊. To stay competitive, portfolio managers, mutual-fund analysts, and institutional-asset professionals must monitor performance precisely and act quickly on insights. The Investment Management KPI Scorecard in Excel is the perfect solution — a ready-to-use, interactive tool that tracks, visualizes, and compares your investment KPIs with absolute clarity.
This Excel-based scorecard turns raw numbers into meaningful intelligence. Whether you’re measuring ROI, AUM growth, expense ratio, or client retention, it provides Month-to-Date (MTD) and Year-to-Date (YTD) comparisons that instantly reveal what’s working — and what needs attention.
Built entirely in Microsoft Excel, it’s simple, powerful, and cost-effective — ideal for finance professionals who want flexibility without the complexity of heavy analytics software 💼.
⚙️ Key Features of the Investment Management KPI Scorecard in Excel
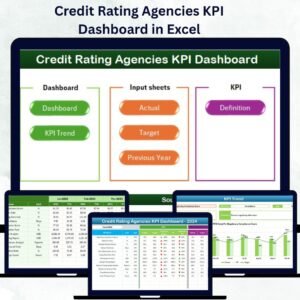
📊 Four Functional Sheets – Scorecard, KPI Trend, Input Data, and KPI Definition.
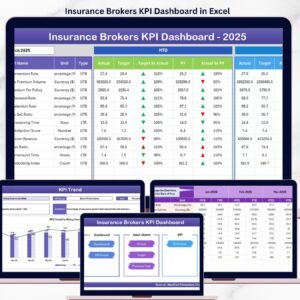
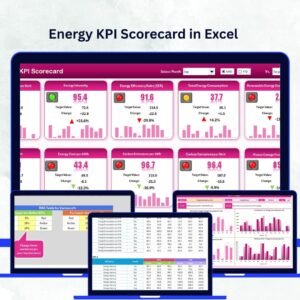
🎯 MTD & YTD Performance Tracking – Monitor short-term and long-term progress.
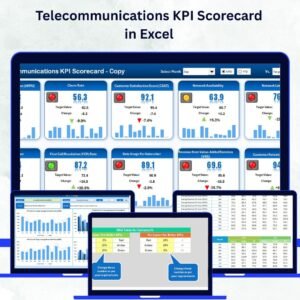
💡 Actual vs Target vs Previous Year (PY) – Benchmark performance instantly.
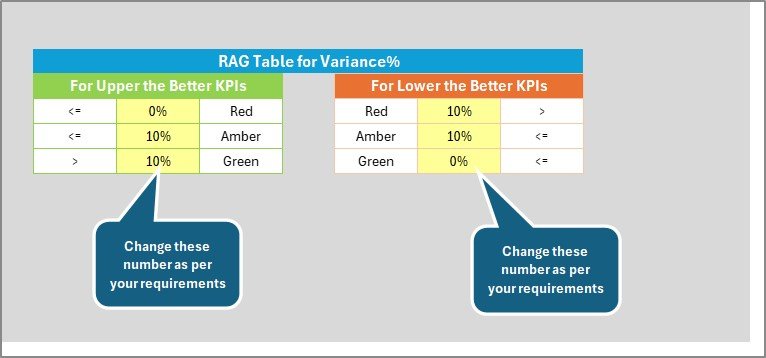
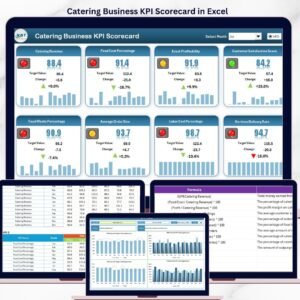
🟢 Conditional Formatting Indicators – Color-coded arrows and icons for quick visual feedback.
📈 Dynamic Charts & Dropdown Filters – Analyze each KPI with ease.
📘 Fully Editable Data Tables – Add, remove, or update KPIs anytime.
💼 Professional Design – Built for portfolio managers and financial analysts.
💰 No Extra Software Needed – Everything runs smoothly in Excel.
📦 What’s Inside the Scorecard
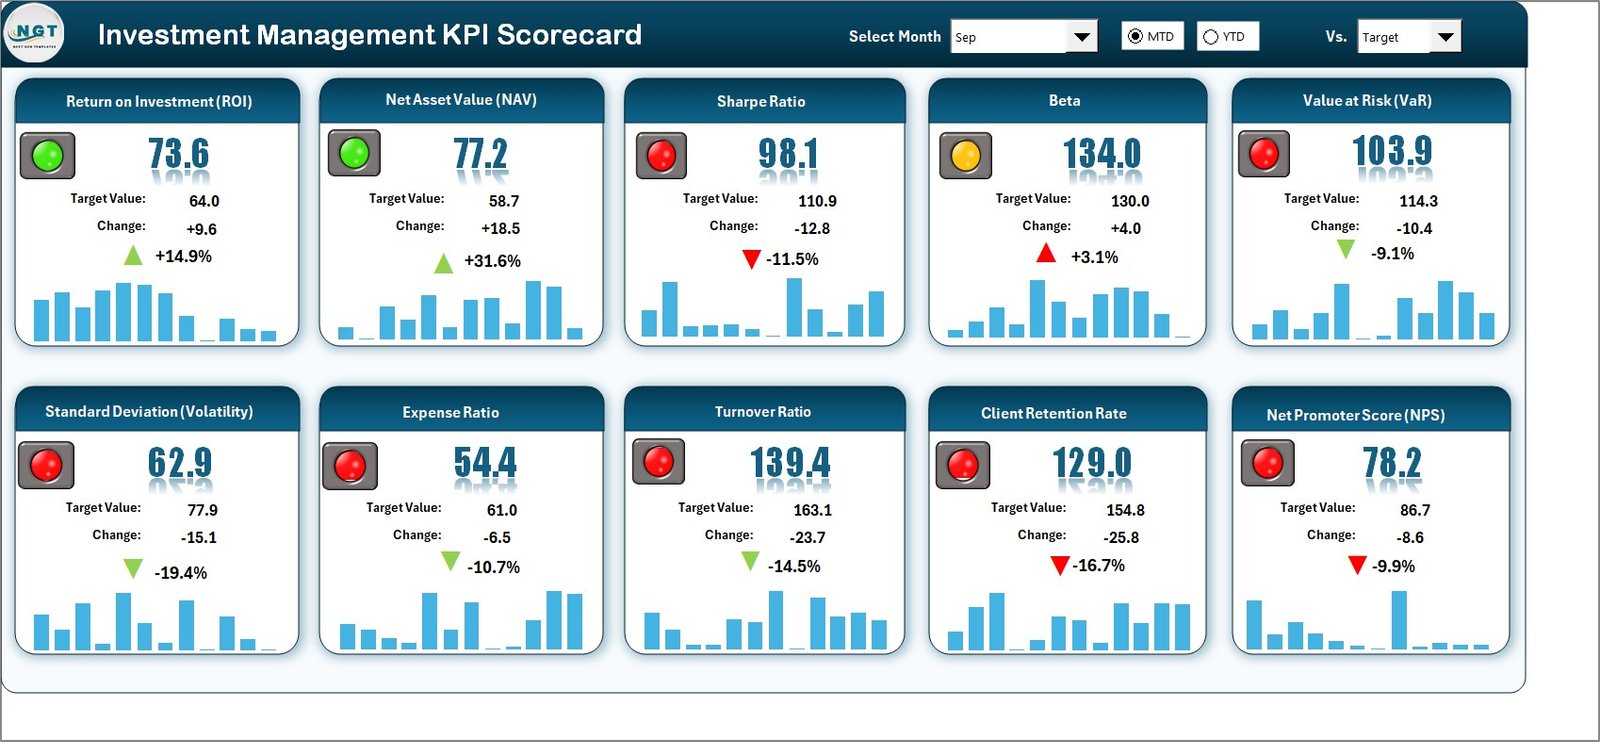
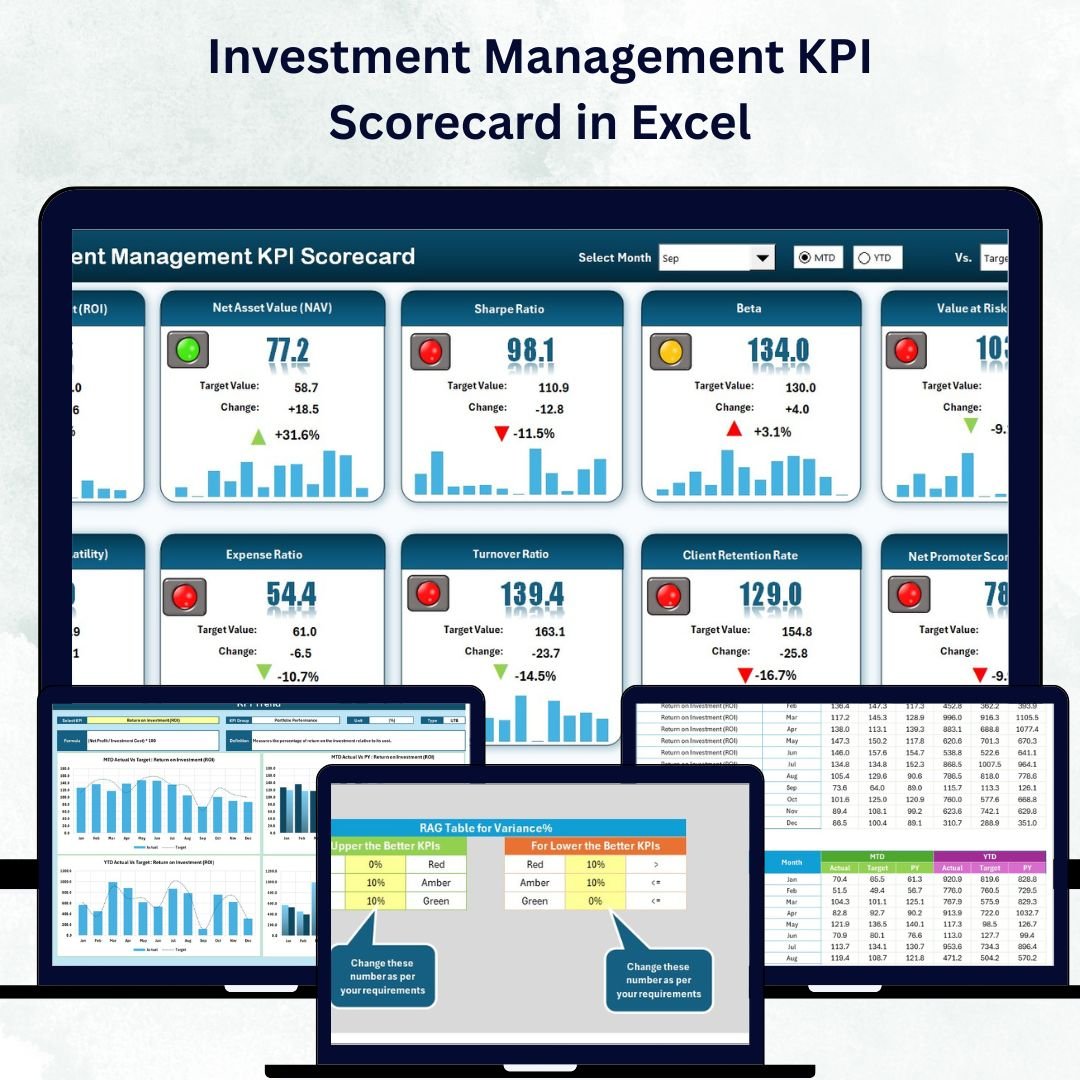
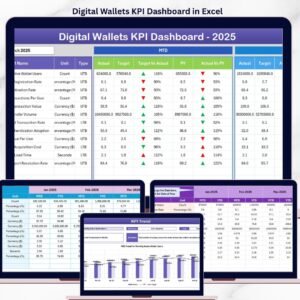
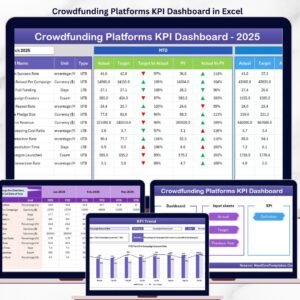
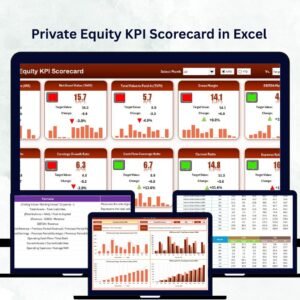
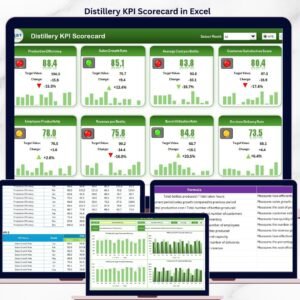
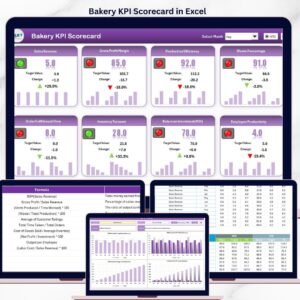
1️⃣ Scorecard Sheet – Your Main Dashboard View
The Scorecard Sheet is the heart of this template.
-
Select Month and MTD/YTD options via dropdowns 📅.
-
Compare Actual vs Target values side by side.
-
View color indicators (green for above target, yellow for near, red for below).
-
Instantly see your investment performance snapshot in one place.
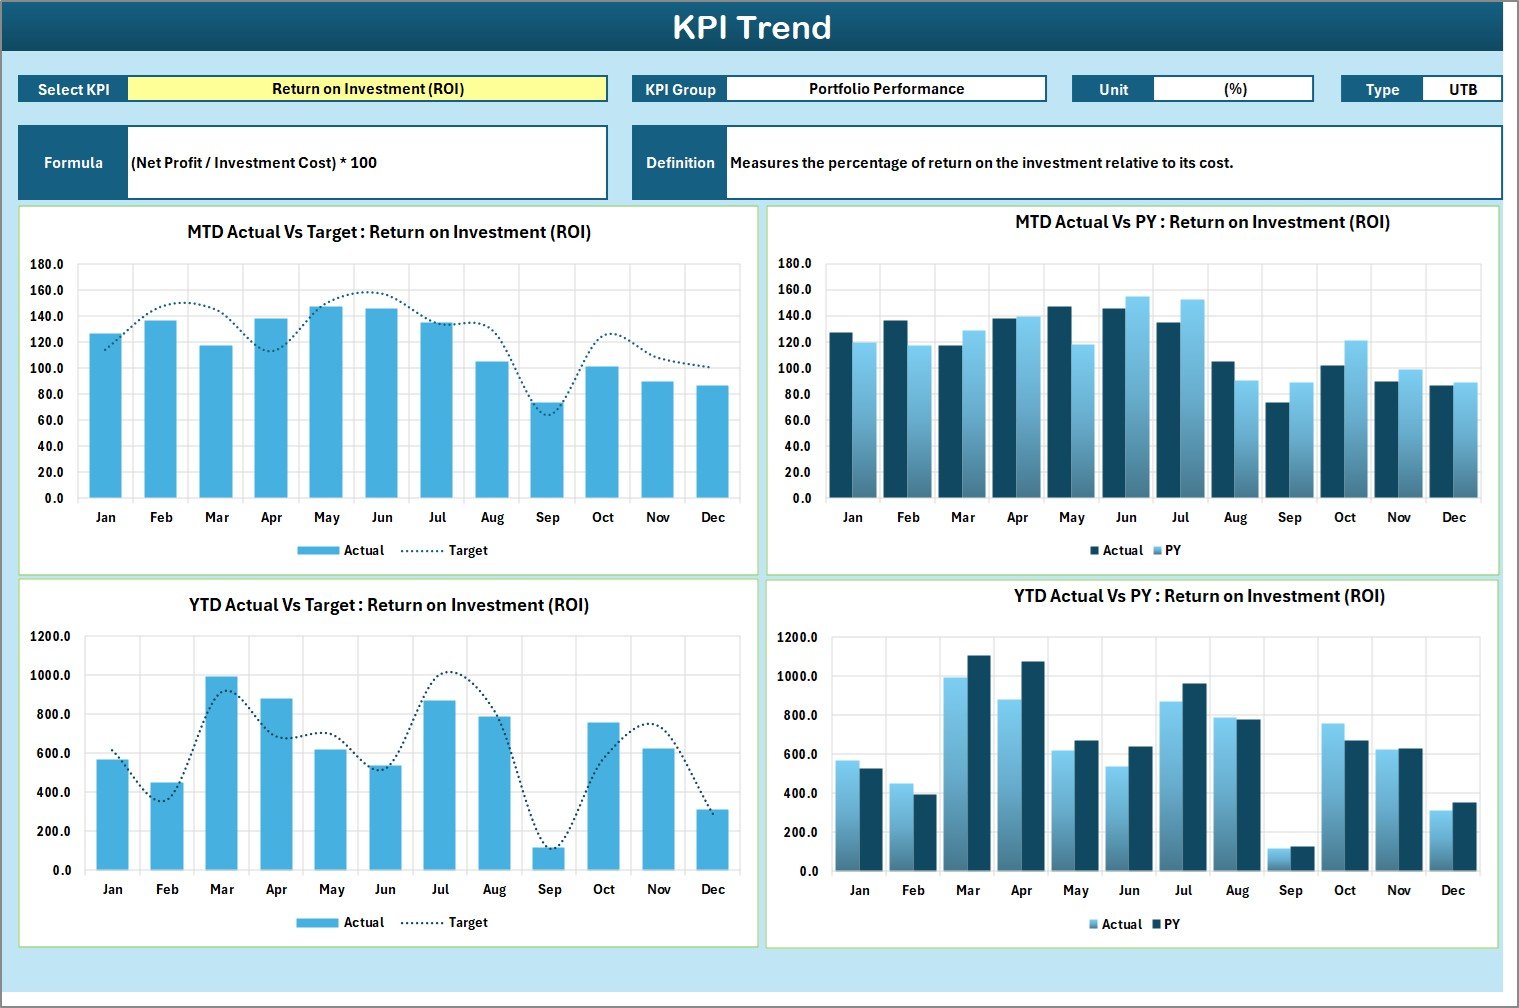
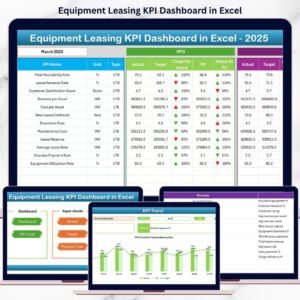
2️⃣ KPI Trend Sheet – Visualize Growth Patterns
-
Choose a specific KPI (C3 dropdown).
-
Automatically see its Group, Unit, Type (LTB or UTB), Formula, and Definition.
-
MTD and YTD trend charts show Actual, Target, and PY values.
📈 Spot performance shifts quickly and respond with strategic action.
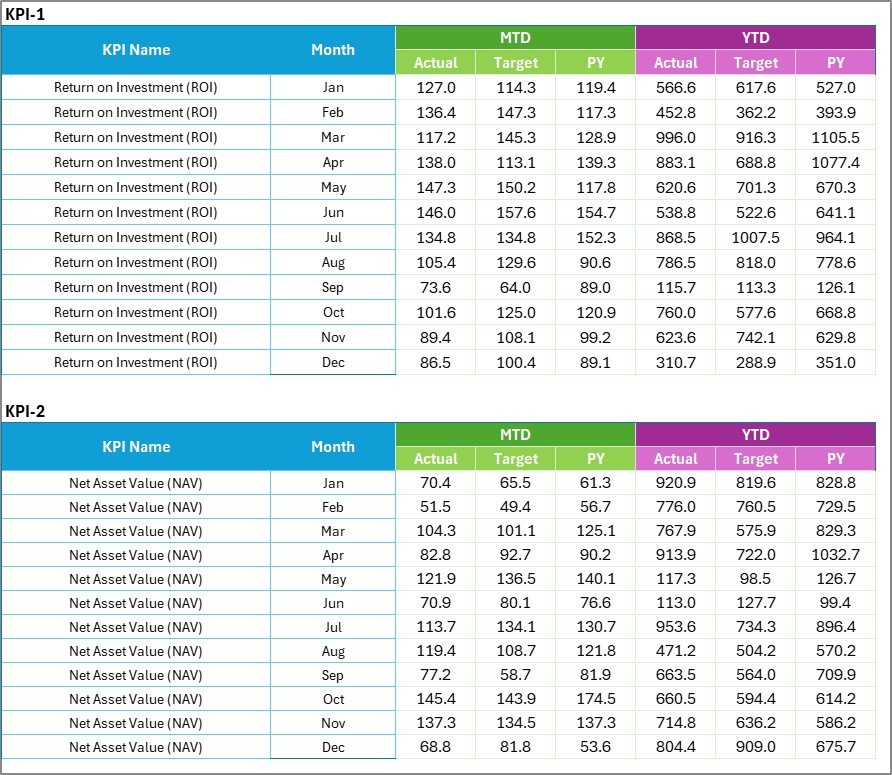
3️⃣ Input Data Sheet – The Data Engine
-
Record Actuals, Targets, and Historical data for each month.
-
Dynamic formulas update the entire dashboard automatically.
-
Organized columns make it simple even for non-technical users 💾.
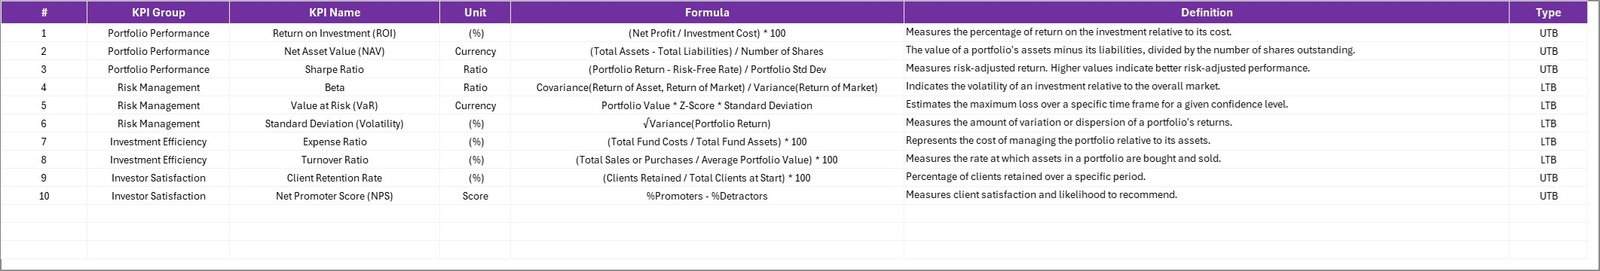
4️⃣ KPI Definition Sheet – Transparency & Standardization
-
Define each metric (Name, Group, Unit, Formula, Definition).
-
Separate Financial KPIs (ROI, AUM Growth) and Non-Financial KPIs (Client Retention, Compliance).
-
Ensure consistency and clarity across your organization.
💹 Example KPIs You Can Track
💰 Financial KPIs – Return on Investment (ROI), AUM Growth Rate, Portfolio Turnover, Expense Ratio, Alpha & Beta.
📑 Operational KPIs – Trade Execution Accuracy, Compliance Rate, Research Efficiency, Reporting Timeliness.
👥 Client KPIs – Retention Rate, New Client Acquisition, Customer Satisfaction Index.
These KPIs deliver a 360° view of profitability, efficiency, and client experience.
🌟 Advantages of the Investment Management KPI Scorecard in Excel
✅ Centralized Performance View – All KPIs in one visual dashboard.
✅ Transparency & Accuracy – Formula-driven and clearly defined metrics.
✅ Smarter Decisions – Instant insight into Actual vs Target vs PY values.
✅ Accountability – Assign ownership of KPIs to departments or analysts.
✅ Simple Customization – Add new KPIs or change calculations easily.
✅ No Subscription Costs – Excel-based solution for any budget.
✅ Professional Presentation – Perfect for executive reviews and client reporting.
💡 Best Practices for Effective Use
-
🎯 Set SMART KPIs (Specific, Measurable, Achievable, Relevant, Time-bound).
-
📅 Update data regularly for accurate tracking.
-
📈 Use charts and conditional formatting for clear visuals.
-
🧾 Separate input and output sheets to protect formulas.
-
🤝 Assign responsibility for each KPI to encourage ownership.
-
🔁 Refine your KPIs periodically to match evolving business goals.
Follow these steps to turn your Excel scorecard into a strategic decision-making system.


Reviews
There are no reviews yet.