Every growing organization faces the same challenge — keeping track of hundreds (or thousands) of IT assets scattered across departments, locations, and vendors. Laptops, servers, software licenses, networking equipment… the list keeps growing, and so does the chaos.
What if you could monitor every single asset, its cost, warranty status, depreciation, and utilization from one clean, visual dashboard? That is exactly what the IT Asset Management Dashboard templates from NextGenTemplates.com deliver — available in Excel, Power BI, and Google Sheets.
In this post, we will walk you through all three versions, their features, and help you pick the one that fits your workflow perfectly.
Why Do You Need an IT Asset Management Dashboard?
Tracking IT assets manually is a recipe for missed warranties, wasted budgets, and compliance headaches. A well-designed dashboard solves these problems by giving you real-time visibility into your entire IT inventory.
Here is what a smart IT asset dashboard helps you do:
- Track asset lifecycle from purchase to disposal in one place.
- Monitor depreciation and net book value to make smarter financial decisions.
- Identify inactive or underused assets before they become dead weight.
- Stay ahead of warranty expirations so you never pay for avoidable repairs.
- Evaluate vendor performance based on cost, reliability, and warranty coverage.
- Simplify audits and compliance reporting with ready-to-present visual summaries.
Whether you manage 50 assets or 5,000, having this data at your fingertips changes the way you plan, budget, and operate.
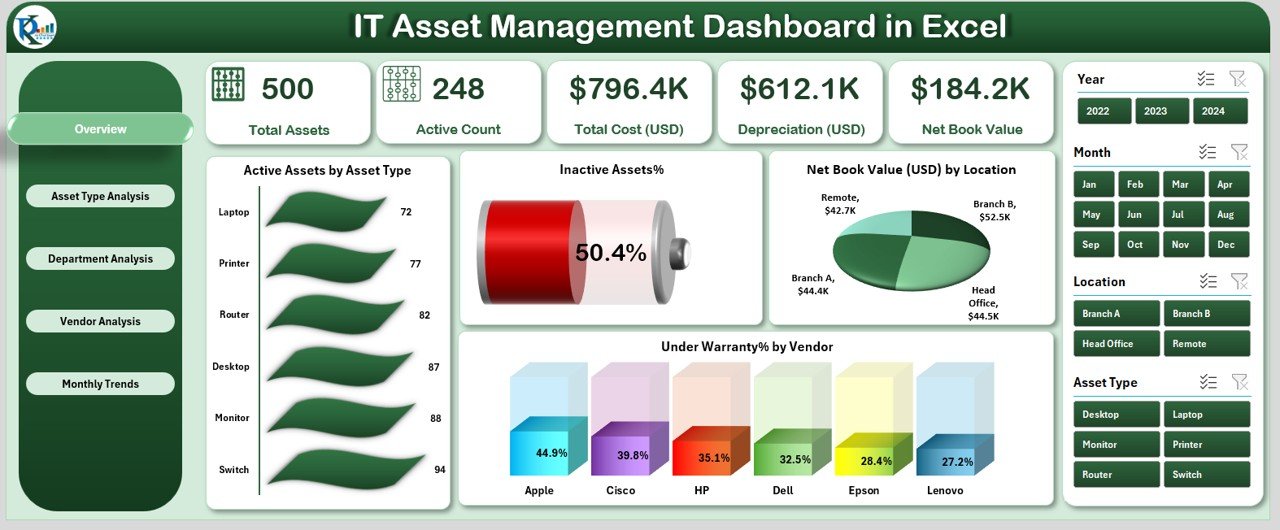
Option 1: IT Asset Management Dashboard in Excel
If your team lives in Microsoft Excel, this is the ideal starting point. The IT Asset Management Dashboard in Excel is built with PivotTables, slicers, and pre-formatted charts — no VBA or coding required.
Key Highlights of the Excel Version
- 5 Dashboard Pages: Overview, Asset Type, Department, Location, and Monthly Trends.
- KPI Cards: Total Assets, Active Assets, Inactive Assets, Net Book Value, and Warranty Coverage.
- Interactive Slicers: Filter instantly by date, department, asset type, or vendor.
- Centralized Data Sheet: One clean sheet with fields for Asset ID, Purchase Date, Vendor, Value, Status, and more.
- Works with Excel 2016 or later — no add-ins, no subscriptions, no external tools.
- Fully customizable to match your organization’s structure and branding.
Simply enter your data into the Data Sheet, and the dashboard updates automatically. It is perfect for monthly reviews, audits, and executive reports.
Price: $14.99 (discounted from $30.99)
Option 2: IT Asset Management Dashboard in Power BI
Need enterprise-grade analytics with drill-through capabilities? The IT Asset Management Dashboard in Power BI takes your asset tracking to the next level with interactive visuals, real-time data connections, and seamless sharing.
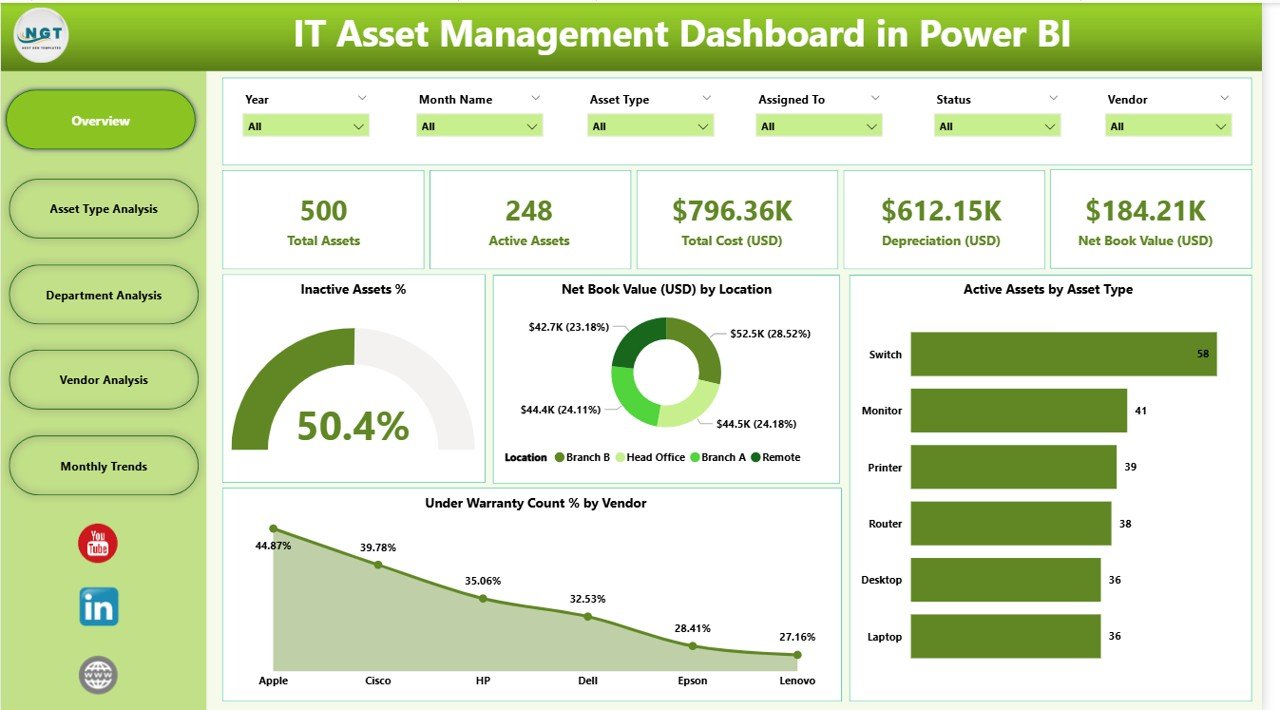
Key Highlights of the Power BI Version
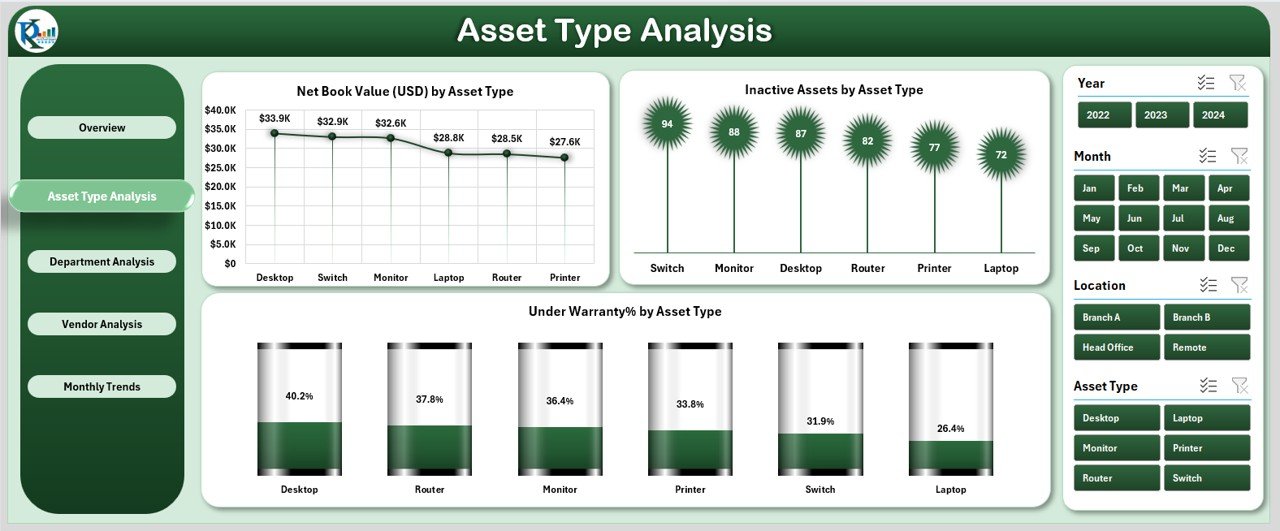
- 5 Analytical Pages: Overview, Asset Type Analysis, Department Analysis, Vendor Analysis, and Monthly Trends.
- Drill-Through Analysis: Click on any visual to explore deeper asset-level details.
- Interactive Slicers: Filter by type, department, vendor, warranty status, location, and date range.
- Vendor Performance Tracking: Evaluate suppliers based on cost, warranty, and reliability.
- Connect to Live Data: Link your Excel file, database, or asset management tool directly to Power BI.
- Easy Sharing: Export as PDF or share interactive dashboards with stakeholders.
This version is ideal for larger teams and organizations that need powerful data modeling, scheduled refreshes, and collaborative reporting.
Price: $17.99 (discounted from $40.99)
Option 3: IT Asset Management Dashboard in Google Sheets
Prefer cloud-based collaboration with zero software installation? The IT Asset Management Dashboard in Google Sheets gives you everything you need — accessible from any browser, on any device.
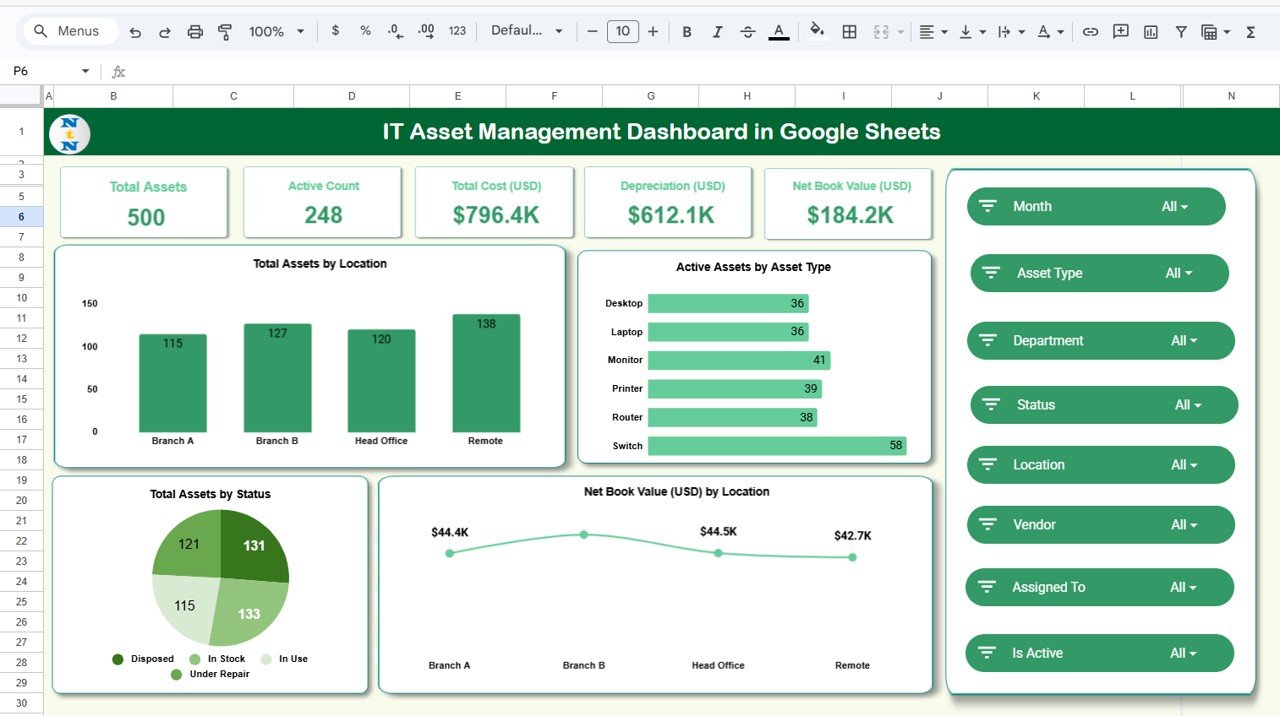
Key Highlights of the Google Sheets Version
- 7 Sheet Tabs: Overview, Asset Type Analysis, Department Analysis, Vendor Analysis, Monthly Trends, Search, and Data Sheet.
- KPI Cards: Total Assets, Active Count, Total Cost (USD), Depreciation (USD), and Net Book Value (USD).
- Built-in Search Tab: Look up any asset by keyword — search by type, vendor, status, or warranty.
- Real-Time Cloud Access: Edit and view from anywhere. Multiple team members can collaborate simultaneously.
- Automated Charts: All visuals update instantly as you add or edit data.
- 100% Google Sheets-Based: No external software, plugins, or subscriptions required.
The bonus Search Tab makes this version especially useful for organizations managing hundreds of assets across multiple sites.
Price: $14.99 (discounted from $28.99)
Quick Comparison: Excel vs Power BI vs Google Sheets
| Feature | Excel | Power BI | Google Sheets |
|---|---|---|---|
| Dashboard Pages | 5 | 5 | 7 (incl. Search) |
| KPI Cards | ✅ | ✅ | ✅ |
| Interactive Filters / Slicers | ✅ | ✅ | ✅ |
| Drill-Through Analysis | ❌ | ✅ | ❌ |
| Cloud-Based Access | ❌ | ✅ (Power BI Service) | ✅ |
| Built-in Search Tab | ❌ | ❌ | ✅ |
| Live Data Connection | ❌ | ✅ | ❌ |
| Best For | Offline users & Excel pros | Enterprise & BI teams | Remote teams & startups |
| Price | $14.99 | $17.99 | $14.99 |
Who Should Use These Dashboards?
These templates are designed for anyone responsible for managing IT infrastructure and budgets. Here are some ideal users:
- IT Managers and System Administrators — stay on top of every hardware and software asset.
- Finance and Accounting Teams — track net book value, depreciation, and total cost of ownership.
- Procurement Officers — evaluate vendor performance and optimize purchasing decisions.
- Facility Managers — monitor asset deployment and condition across locations.
- Internal Auditors — ensure compliance with depreciation schedules and asset records.
- Small Business Owners — manage IT efficiently without expensive ERP software.
Which Version Should You Choose?
The right choice depends on your team’s workflow and technical comfort level.
Choose Excel if your team works primarily offline and is comfortable with spreadsheets. It is the most straightforward option with no learning curve.
Choose Power BI if you need advanced analytics, drill-through capabilities, live data connections, and the ability to share interactive reports across your organization.
Choose Google Sheets if you want cloud-based access, real-time collaboration, and a built-in search feature — all without installing any software.
No matter which version you pick, you are getting a professional, ready-to-use dashboard that saves hours of manual work and delivers clear, actionable insights.
Ready to Take Control of Your IT Assets?
👉 Download the Excel Version |
Download the Power BI Version |
Download the Google Sheets Version
🎥 Visit our YouTube channel to watch the demo.