Solar Panel Manufacturing KPI Dashboard in Excel Are you still managing solar manufacturing performance using scattered spreadsheets and manual reports? In today’s fast-growing renewable energy industry, delayed insights can directly impact production efficiency, quality control, and profitability.
The Solar Panel Manufacturing KPI Dashboard in Excel is a powerful, ready-to-use performance monitoring solution designed specifically for solar panel manufacturers. This smart Excel dashboard transforms complex production data into clear visual insights, helping managers track KPIs, compare targets, and make faster data-driven decisions — without expensive software.
Built using an easy and familiar Excel environment, this dashboard centralizes all manufacturing metrics into one interactive system. From production efficiency to quality performance and operational trends, everything becomes visible in seconds.
Solar Panel Manufacturing KPI Dashboard in Excel Whether you manage wafer processing, cell production, module assembly, testing, or packaging operations, this dashboard gives you complete performance clarity.
🚀 Key Features of Solar Panel Manufacturing KPI Dashboard in Excel
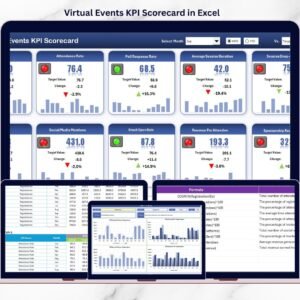
✅ Interactive dashboard with automated KPI tracking
✅ Month selector for dynamic performance analysis
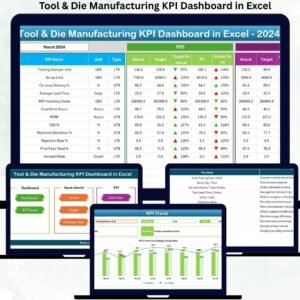
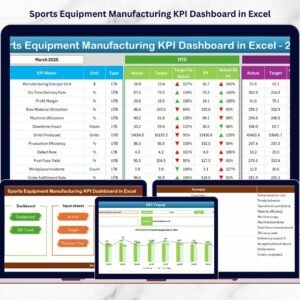
✅ MTD & YTD comparison with visual indicators
✅ Target vs Actual and Previous Year comparison
✅ Automated calculations to reduce manual effort
✅ KPI trend analysis with dynamic charts
✅ Centralized KPI documentation system
✅ User-friendly navigation with quick-access buttons
Visual arrows and conditional formatting instantly highlight performance improvements or risks, allowing managers to react quickly.
📦 What’s Inside the Solar Panel Manufacturing KPI Dashboard in Excel
This ready-to-use template includes 7 professionally designed worksheets:

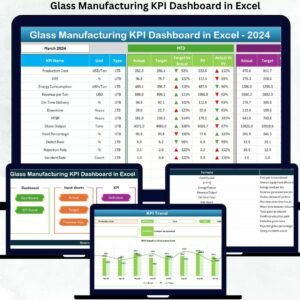
📊 Home Sheet – Navigation hub with quick-access buttons
📈 Dashboard Sheet – Complete KPI overview with monthly selector
📉 KPI Trend Sheet – Trend analysis with KPI selection dropdown
🧾 Actual Data Sheet – Monthly operational data entry area
🎯 Target Sheet – Performance planning and benchmarking
📅 Previous Year Sheet – Historical comparison tracking
📘 KPI Definition Sheet – KPI formulas, units, and documentation
Each sheet works together automatically, ensuring seamless performance monitoring without complex setup.
🛠️ How to Use the Solar Panel Manufacturing KPI Dashboard in Excel
Using this dashboard is simple and requires only basic Excel knowledge:
1️⃣ Define KPIs in the KPI Definition sheet
2️⃣ Enter monthly and yearly targets
3️⃣ Add actual production data regularly
4️⃣ Input previous year performance values
5️⃣ Select the reporting month from the dashboard
6️⃣ Instantly analyze performance insights
The dashboard automatically updates charts, comparisons, and calculations — saving hours of manual reporting work.
👥 Who Can Benefit from This Solar Panel Manufacturing KPI Dashboard in Excel
This dashboard is designed for professionals across manufacturing operations:
👨🏭 Production Managers monitoring efficiency
🔍 Quality Teams tracking defect and yield performance
🏭 Plant Supervisors managing operational output
📊 Business Analysts analyzing trends
📈 Operations Leaders improving productivity
💼 Manufacturing Executives making strategic decisions
Because the dashboard simplifies complex analytics, every department gains actionable insights.
By centralizing KPIs into one structured system, organizations gain real-time visibility, improve accountability, and make confident operational decisions. Instead of spending hours compiling reports, teams can focus on improving performance and achieving production targets.
The Solar Panel Manufacturing KPI Dashboard in Excel helps manufacturers enhance efficiency, reduce reporting complexity, and build a strong foundation for data-driven manufacturing management.
## Click here to read the Detailed blog post
Visit our YouTube channel to learn step-by-step video tutorials
👉 https://youtube.com/@PKAnExcelExpert