Smart Wearables KPI Dashboard are transforming healthcare, fitness, sports, and lifestyle industries at an unprecedented pace ⌚📈. From device usage and engagement metrics to performance targets and historical trends, smart wearables businesses generate massive volumes of KPI data every month. However, when this data remains locked in Excel sheets or static reports, it becomes difficult to analyze and act on.
That is exactly where the Smart Wearables KPI Dashboard in Power BI delivers real value 🚀.
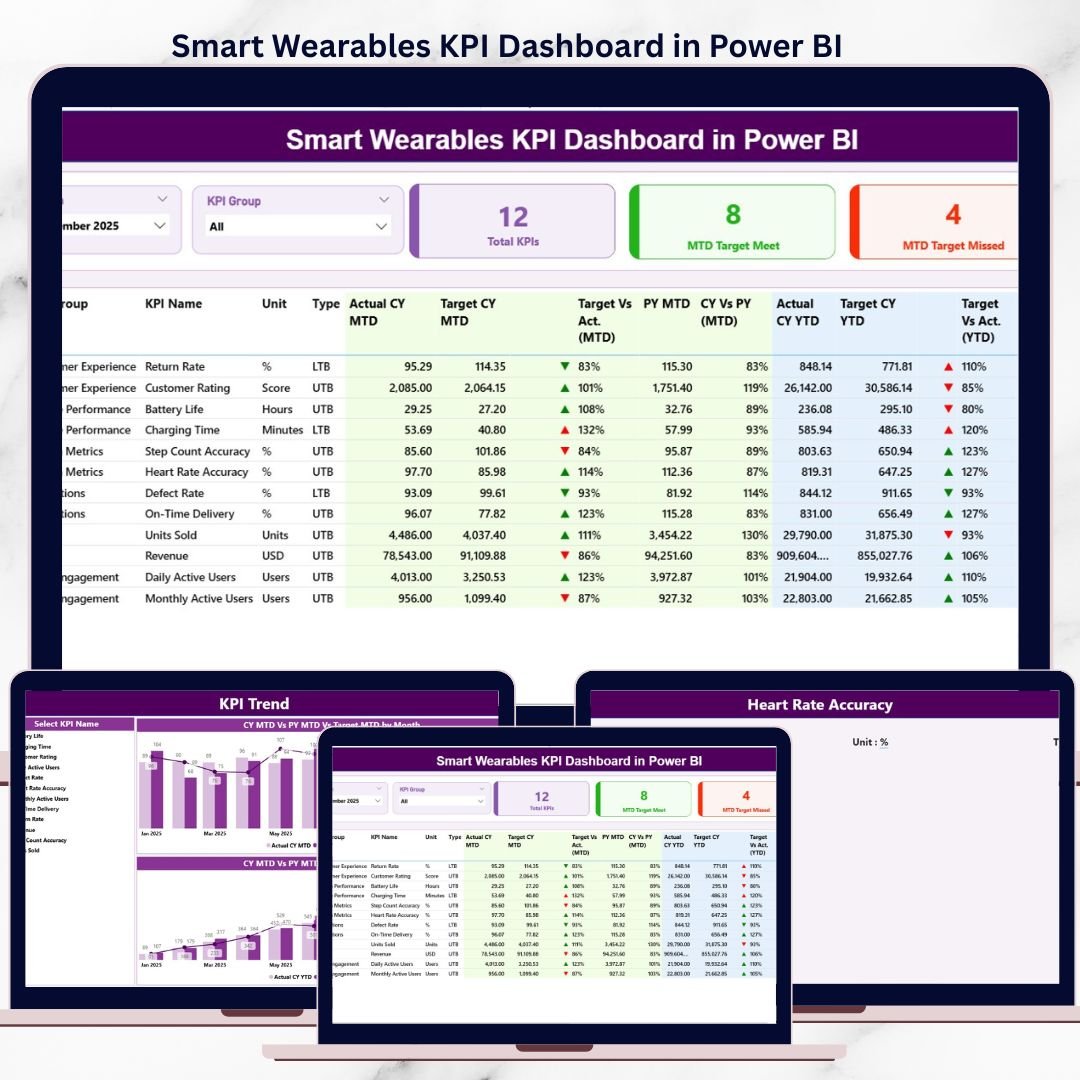
This professionally designed Power BI dashboard converts raw smart wearables data into clear, interactive, and actionable KPI insights. Instead of manually compiling reports or switching between multiple spreadsheets, decision-makers can monitor MTD, YTD, Target, and Previous Year performance from a single, unified dashboard.
The dashboard uses Microsoft Power BI for visualization and Microsoft Excel as the data source, making it both powerful and easy to maintain. You simply update the Excel file, refresh the Power BI report, and instantly see updated KPIs. No complex coding, no heavy IT dependency.
Whether you are a smart wearable manufacturer, health-tech startup, IoT analytics team, or product manager, this dashboard helps you track performance accurately, identify gaps early, and make faster data-driven decisions with confidence.
🔑 Key Features of Smart Wearables KPI Dashboard in Power BI
📊 Centralized KPI tracking in one Power BI dashboard
📅 Month and KPI Group slicers for dynamic filtering
📈 MTD & YTD Actual vs Target comparison
🔄 Current Year vs Previous Year analysis
⬆️⬇️ Performance indicators with up/down icons
📉 MTD & YTD KPI trend combo charts
📘 Built-in KPI Definition drill-through page
⚡ Excel-based data input (easy to update)
🚀 No coding required for end users
📂 What’s Inside the Smart Wearables KPI Dashboard in Power BI
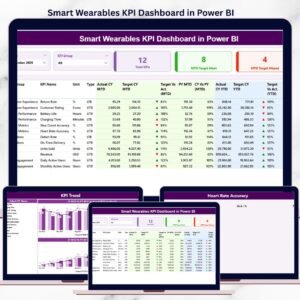
📌 Summary Page – Complete KPI Snapshot
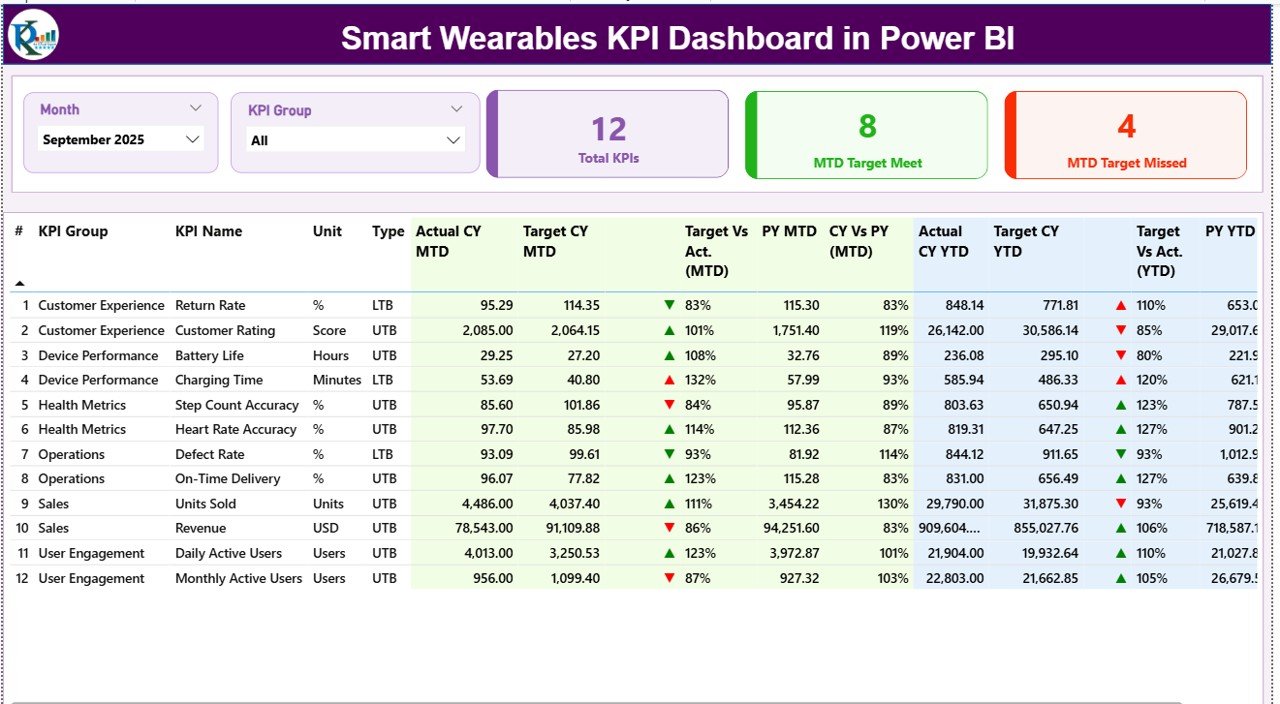
Smart Wearables KPI Dashboard
The Summary Page is the main control panel of the dashboard.
Key elements include:
-
📅 Month slicer for period-wise analysis
-
🗂️ KPI Group slicer to focus on specific KPI categories
High-impact KPI cards:
-
📊 Total KPIs Count
-
✅ MTD Target Met Count
-
❌ MTD Target Missed Count
Detailed KPI table with:
-
KPI Number, Group, Name, Unit, and Type (UTB / LTB)
-
Actual CY MTD vs Target CY MTD
-
Target vs Actual (MTD %)
-
Previous Year MTD and CY vs PY comparison
-
Actual CY YTD vs Target CY YTD
-
Target vs Actual (YTD %)
-
Previous Year YTD and CY vs PY comparison
⬆️⬇️ Visual indicators instantly highlight over-performance and under-performance, allowing leaders to act quickly.
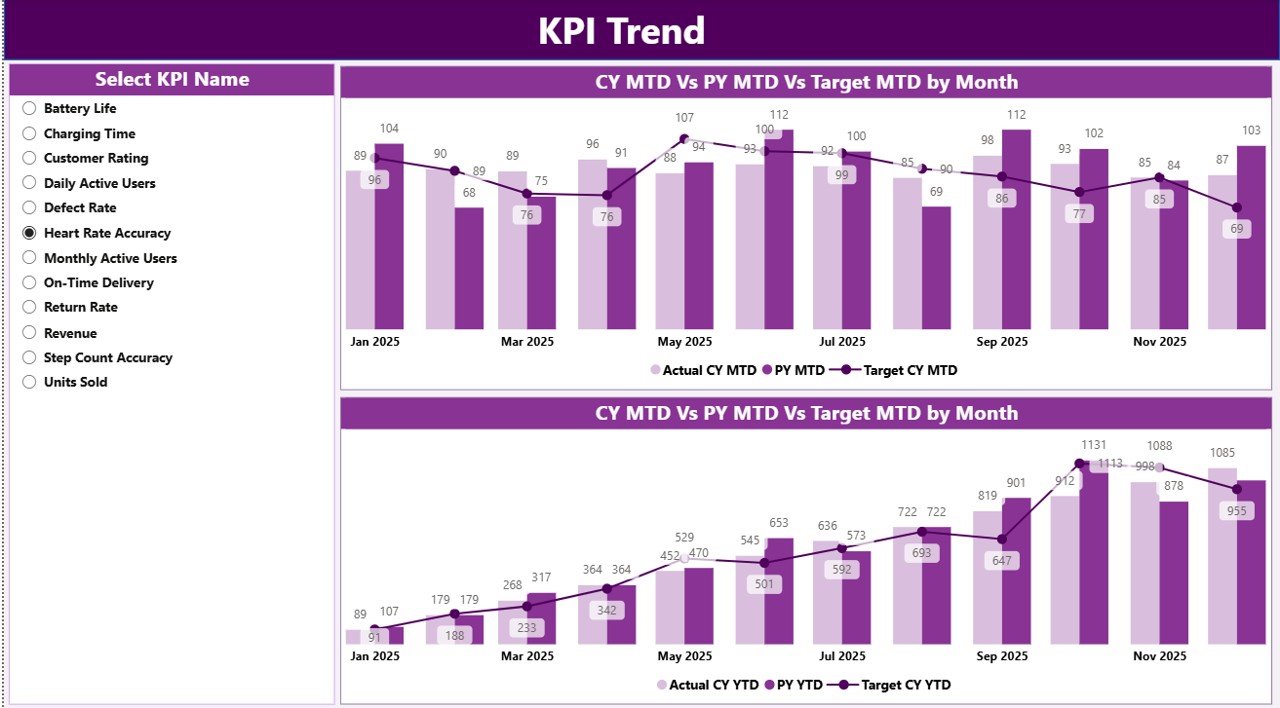
📉 KPI Trend Page – Performance Over Time
The KPI Trend Page focuses on trend-based analysis.
Interactive features:
-
🎯 KPI Name slicer on the left
-
📊 Two combo charts showing:
-
MTD Actual vs Target vs Previous Year
-
YTD Actual vs Target vs Previous Year
-
This page helps users:
-
Identify growth or decline trends
-
Detect seasonality patterns
-
Understand long-term KPI behavior
As a result, strategy discussions become data-backed instead of assumption-based.
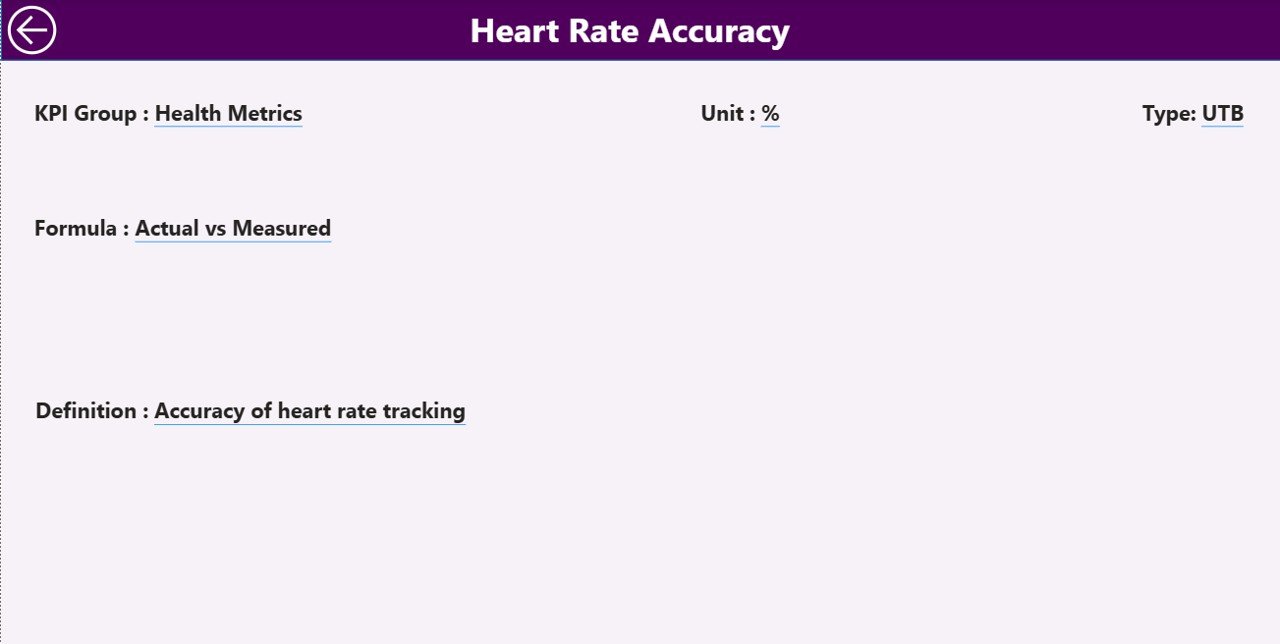
📘 KPI Definition Page – Clarity & Consistency
The KPI Definition Page acts as a KPI knowledge base.
What it includes:
-
KPI Formula
-
KPI Definition
-
KPI Type (Upper the Better / Lower the Better)
This page is available as a drill-through from the Summary Page, ensuring users always understand what each KPI means. A back button allows easy return to the main dashboard.
📊 Excel Data Source Structure (Simple & Scalable)
The dashboard connects to a structured Excel file with three sheets:
📥 Input_Actual Sheet
Stores actual performance values:
-
KPI Name
-
Month (first date of month)
-
MTD Actual
-
YTD Actual
🎯 Input_Target Sheet
Stores target values:
-
KPI Name
-
Month
-
MTD Target
-
YTD Target
📘 KPI Definition Sheet
Stores KPI metadata:
-
KPI Number
-
KPI Group
-
KPI Name
-
Unit
-
Formula
-
Definition
-
Type (UTB / LTB)
This structure ensures clean data, easy updates, and reliable insights.
🎯 Who Should Use This Dashboard?
⌚ Smart Wearable Manufacturers
🏃 Health & Fitness Tech Companies
📡 IoT & Wearable Analytics Teams
📊 Product & Operations Managers
📈 Business Analysts & Leadership Teams
▶️ Visit our YouTube channel to learn step-by-step video tutorials
https://youtube.com/@PKAnExcelExpert
🔗 Click here to read the Detailed blog post


Reviews
There are no reviews yet.