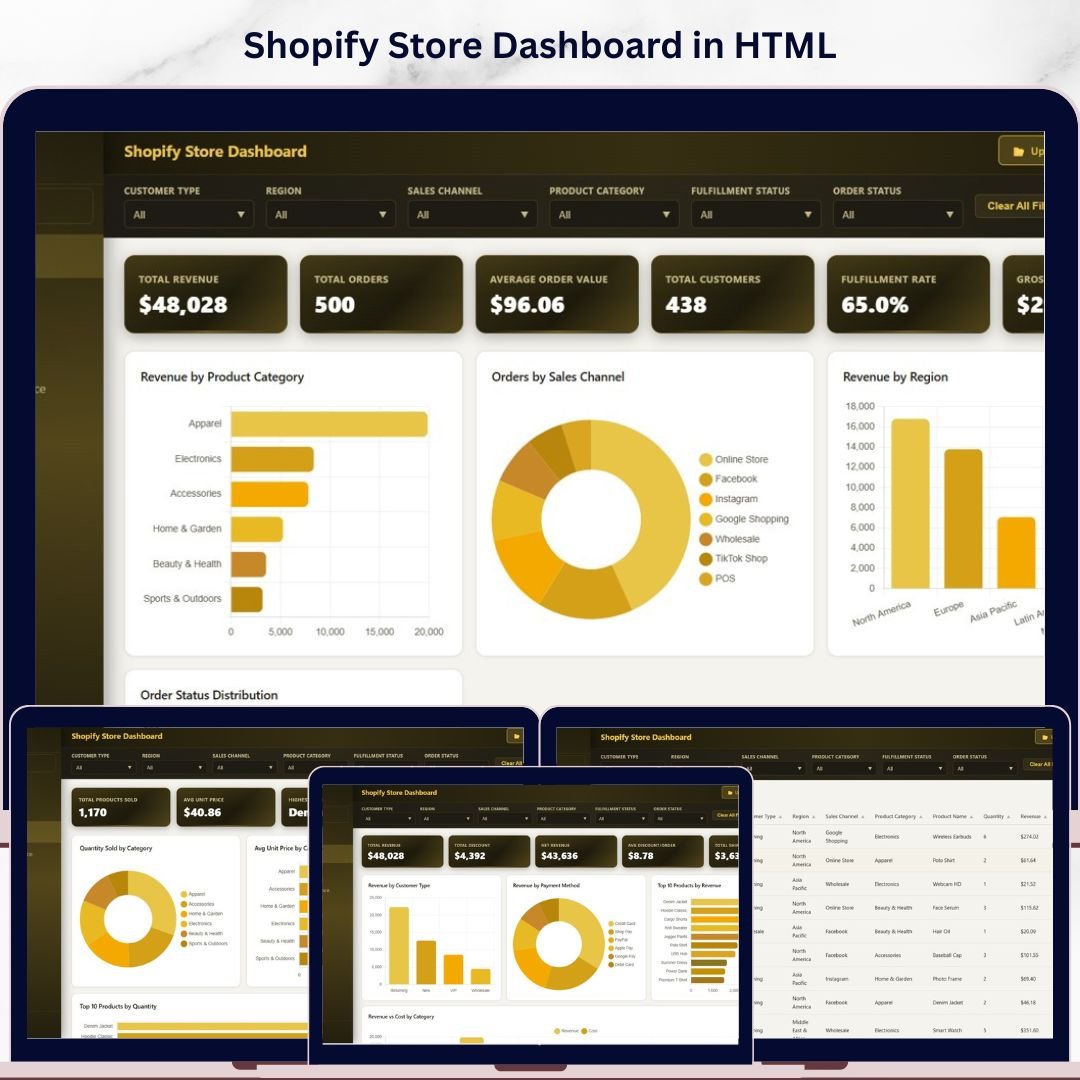
Shopify Store Dashboard in HTML is the ultimate browser-based analytics solution for Shopify store owners who want complete visibility into their sales, orders, fulfillment, and profitability — without installing any software. If you are managing a Shopify store and want a lightweight, interactive dashboard that runs directly in your web browser, this HTML dashboard template transforms raw order data into powerful visual insights instantly. 📊💡
This dashboard includes 5 interactive analysis pages plus a detailed data view, each packed with dynamic charts, KPI cards, and slicers that let you filter your data with a single click. Whether you want to compare revenue by product category, track fulfillment rates, analyze sales channel performance, or monitor monthly trends — this Shopify Store Dashboard in HTML delivers it all with modern SaaS-style design and zero dependencies. Built for Shopify entrepreneurs, e-commerce managers, operations teams, and business analysts who want instant browser-based analytics with professional-grade visualizations.
🔑 Key Features of Shopify Store Dashboard in HTML
✅ 5 dedicated dashboard pages plus a data view page covering every aspect of Shopify store analytics
✅ Real-time KPI cards showing Total Revenue, Total Orders, Average Order Value, Total Customers, Fulfillment Rate, and Gross Profit
✅ Dynamic charts that refresh automatically when you update the data file
✅ Interactive slicers for instant filtering across all dashboard pages
✅ Sales channel performance comparison across all Shopify channels
✅ Product-level insights including quantity sold, pricing analysis, and category breakdowns
✅ Order fulfillment tracking with status distribution and monthly trends
✅ Revenue vs cost analysis by product category for profitability monitoring
✅ Searchable data table with sort, pagination, and CSV export features
✅ Works in any modern browser — Chrome, Firefox, Edge, Safari — no software needed
📦 What’s Inside the Shopify Store Dashboard in HTML
This template includes 5 interactive dashboard pages and 1 data view that work together as a complete Shopify analytics system. The dashboard tracks 6 core KPIs and features over 15 analytical charts across all pages.
1️⃣ Overview Page — Your Shopify Command Center
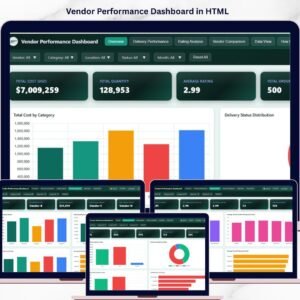
The Overview Page provides a high-level snapshot of your entire Shopify store performance. At the top, you see KPI cards displaying Total Revenue, Total Orders, Average Order Value, Total Customers, Fulfillment Rate, and Gross Profit. Below, dynamic charts visualize Revenue by Product Category to pinpoint top-selling categories, Orders by Sales Channel to compare platform performance, Revenue by Region for geographic insights, Order Status Distribution for order tracking, and Monthly Revenue Trend to identify growth patterns. Multiple slicers let you filter the entire dashboard instantly.
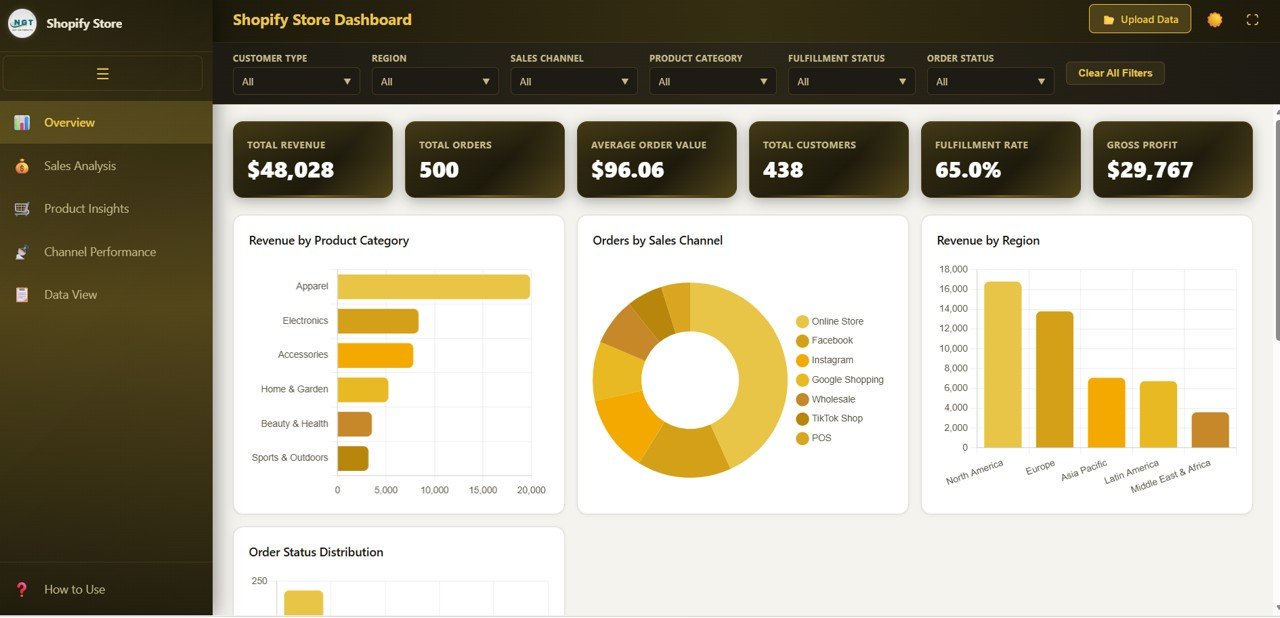
Shopify Store Dashboard Overview
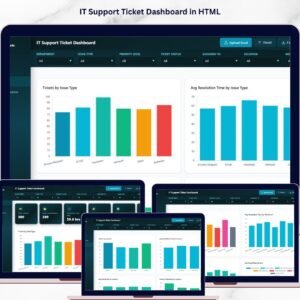
2️⃣ Sales Analysis Page
This page dives deeper into your Shopify sales performance. It features Revenue by Customer Type to compare new vs returning buyers, Revenue by Payment Method to see which payment options customers prefer, Top 10 Products by Revenue to identify bestsellers, and Revenue vs Cost by Category to evaluate category-level profitability. These insights help you optimize pricing, improve targeting, and strengthen revenue strategies.
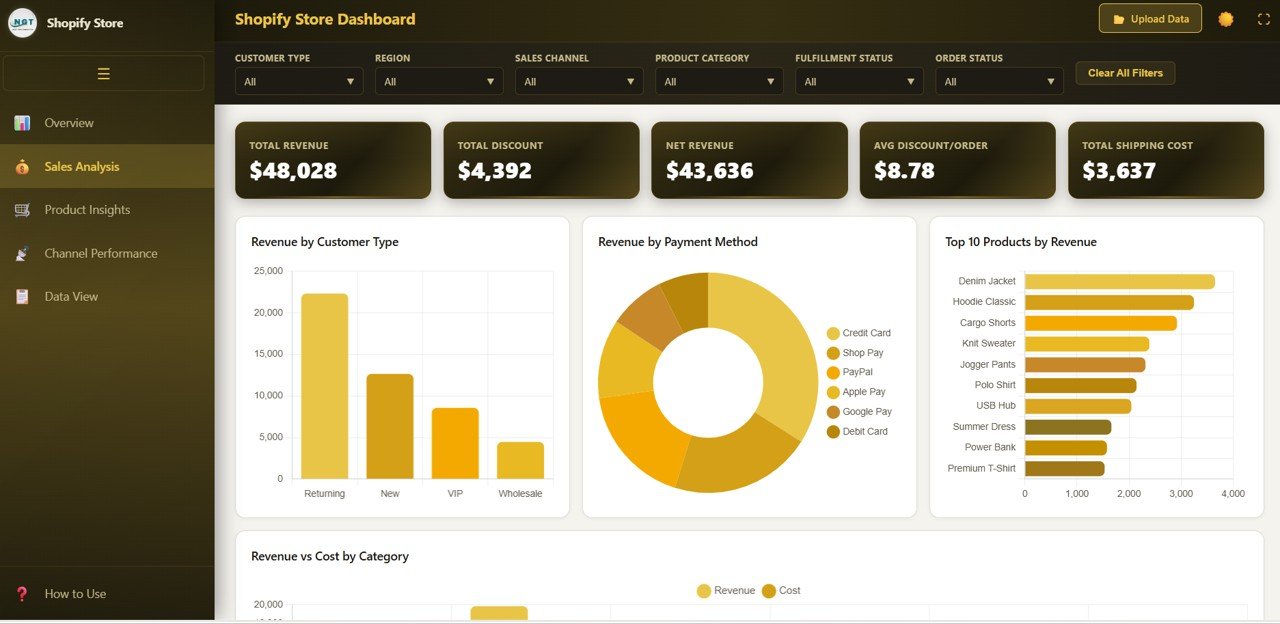
Sales Analysis
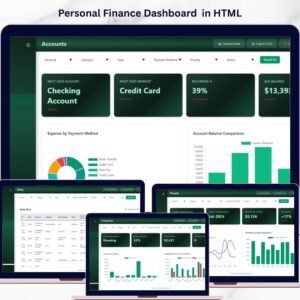
3️⃣ Product Insights Page
Understand your product performance at a granular level. This page shows Quantity Sold by Category to identify volume leaders, Avg Unit Price by Category for pricing analysis, Revenue by Category and Customer Type for segment-level insights, and Top 10 Products by Quantity to track your most popular items. These analytics help you make smarter inventory and pricing decisions.
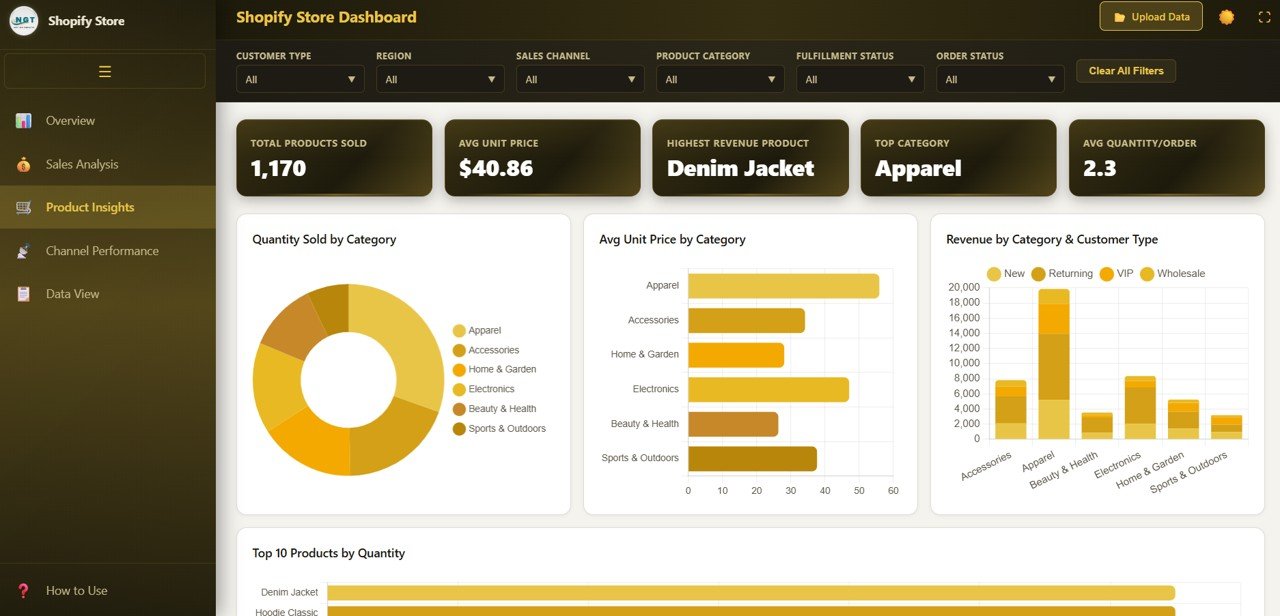
Product Insights
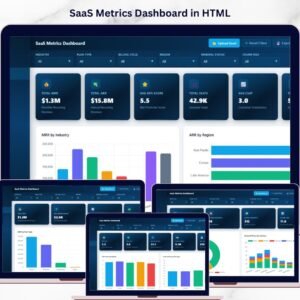
4️⃣ Channel Performance Page
If you sell through multiple Shopify sales channels, this page is essential. It visualizes Revenue by Sales Channel, Orders by Channel and Region, Fulfillment Status by Channel, and Avg Order Value by Channel — helping you identify your strongest and weakest channels quickly. Compare online store, POS, social media, and marketplace performance side by side.
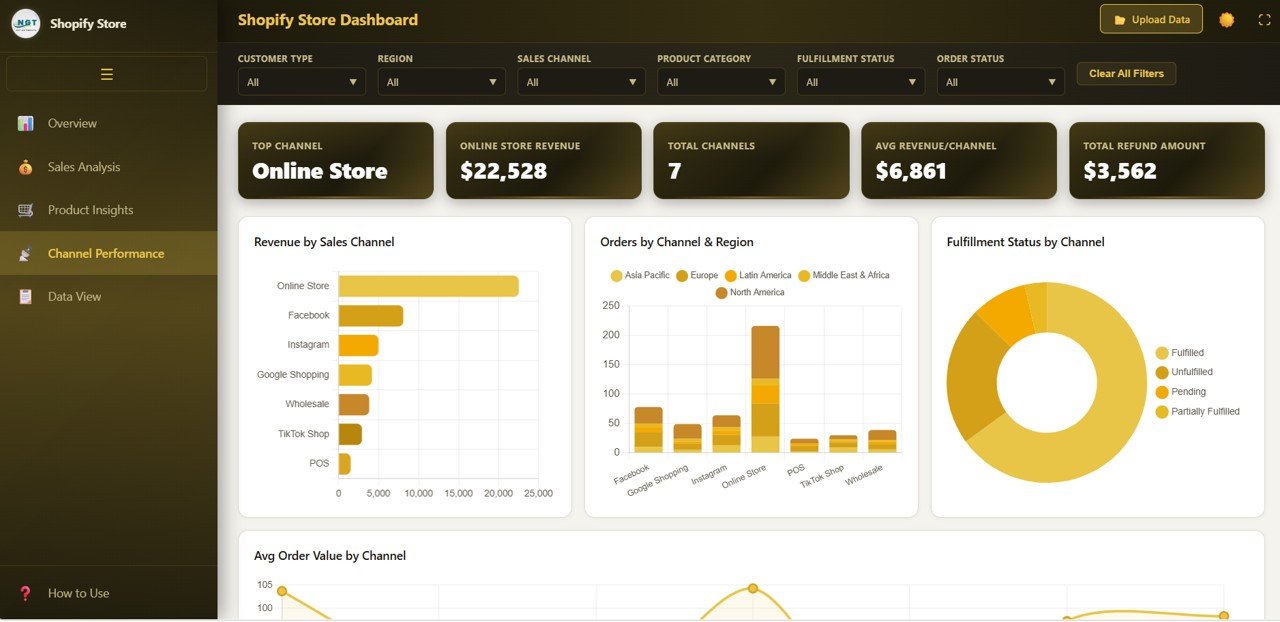
Channel Performance
5️⃣ Data View Page
This is the detailed data table page where you can see all records with search, sort, and pagination features. You can also export the filtered data to CSV for further analysis in Excel or Google Sheets. This page gives you complete transparency into every order in your dataset.
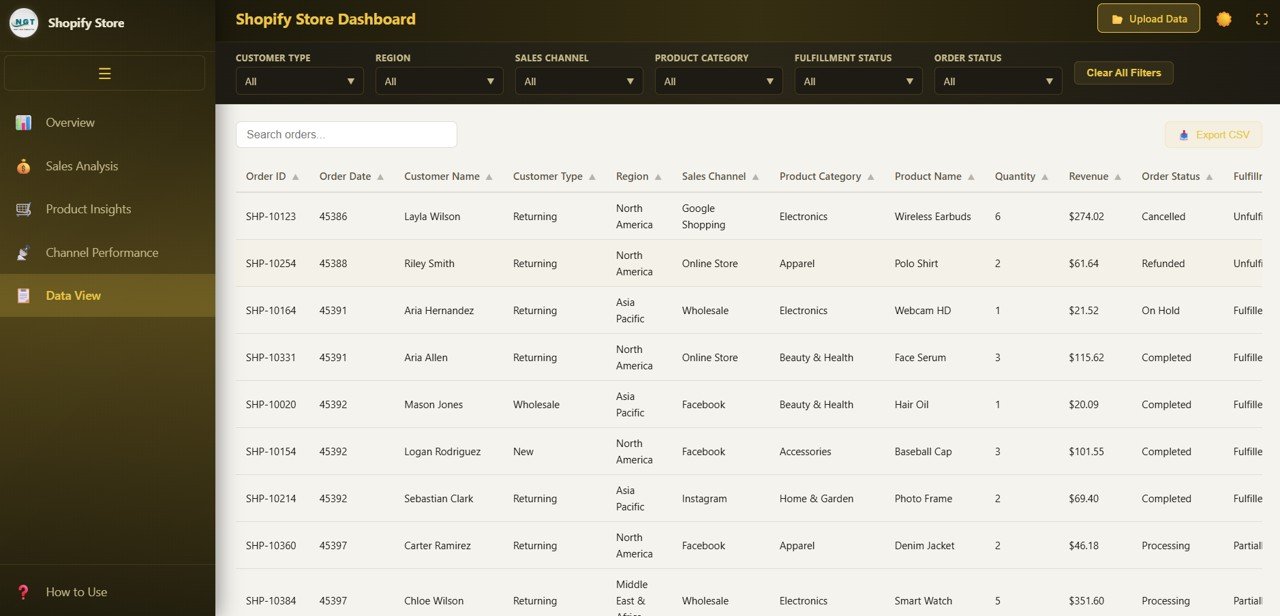
Data View
⚙️ How to Use the Shopify Store Dashboard in HTML
1️⃣ Unzip the downloaded file to any folder on your computer.
2️⃣ Open the index.html file in any modern web browser (Chrome, Firefox, Edge, Safari).
3️⃣ Replace the sample data in the data file with your Shopify store export data.
4️⃣ Refresh the browser to see updated charts and KPI cards instantly.
5️⃣ Navigate through the 5 dashboard pages using the tab navigation.
6️⃣ Use slicers on each page to filter by category, region, channel, status, or month.
The entire process takes less than 5 minutes — no server setup, no software installation, no coding needed.
👥 Who Can Benefit from This Shopify Store Dashboard
🛒 Shopify Store Owners tracking sales, costs, and profitability across their product catalog
📊 E-Commerce Managers monitoring fulfillment rates, channel performance, and order trends
💰 Finance Teams analyzing revenue vs cost by region and customer type
🚀 Marketing Teams evaluating sales channel effectiveness and product performance
📦 Operations Teams tracking order fulfillment status and delivery performance
📈 Business Analysts building data-driven strategies using Shopify store data
If your business runs on Shopify, this dashboard helps you move from scattered data to actionable insights. Explore more HTML Dashboard Templates or check out the Shopify Store Dashboard in Excel for a pivot-table based alternative. You may also like the Shopify Store Dashboard in Power BI for advanced Power BI-based analytics.
❓ Frequently Asked Questions
What KPIs does the Shopify Store Dashboard in HTML track?
The Shopify Store Dashboard in HTML tracks 6 key performance indicators including Total Revenue, Total Orders, Average Order Value, Total Customers, Fulfillment Rate, and Gross Profit. It also provides 15+ chart-based analyses across sales channels, product categories, customer types, regions, and monthly trends.
Do I need any special software to use this dashboard?
No. This dashboard runs 100% in your web browser. Simply unzip the file and open index.html in Chrome, Firefox, Edge, or Safari. No server, no database, no installation required.
Can I use this dashboard for multiple Shopify stores?
Yes. You can combine order data from multiple Shopify stores into a single data file. The dashboard will analyze all data together. Alternatively, maintain separate copies for each store.
How do I export data from Shopify to use with this dashboard?
Go to your Shopify Admin → Orders → Export. Download the CSV file, then map the columns to match the data file format included in this template.
Can I customize the charts and add new pages?
Yes. The dashboard is built with standard HTML, CSS, and JavaScript. You can modify existing charts, add new visualizations, or extend the data structure to include more fields.
Is this dashboard mobile-friendly?
Yes. The dashboard uses responsive design principles and works on tablets and large-screen mobile devices. For the best experience, a desktop or laptop browser is recommended.
🔗 Explore Related Templates
📊 Shopify Store Dashboard in Excel — Track Shopify store performance using Excel pivot tables and charts.
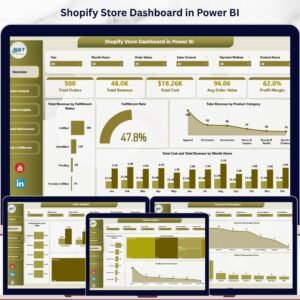
📈 Shopify Store Dashboard in Power BI — Advanced Shopify analytics with dynamic Power BI visuals.
📋 E-Commerce Sales Performance Dashboard in Google Sheets — Cloud-based e-commerce analytics with real-time collaboration.
📖 Click here to read the Detailed Blog Post
🎥 Visit our YouTube channel to learn step-by-step video tutorials
👉 YouTube.com/@NextGenTemplates
Watch the step-by-step video tutorial:
YouTube


Reviews
There are no reviews yet.