Production must stay efficient. Raw material costs must stay controlled. Machines must run smoothly. Labor must stay productive.
But when data lives in scattered spreadsheets, leaders lose clarity. Costs rise quietly. Plants perform unevenly. Maintenance issues go unnoticed.
What if you could monitor everything — revenue, cost, maintenance, product performance, and shift efficiency — in one powerful system?
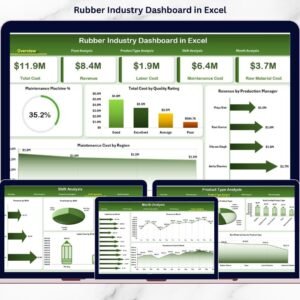
That’s exactly what the Rubber Industry Dashboard in Excel delivers. 🏭📊
This ready-to-use Excel dashboard transforms raw operational data into interactive charts, KPI cards, and slicer-based analysis. Instead of manually reviewing reports, you simply select filters and see insights instantly.
🚀 Key Feature of Rubber Industry Dashboard in Excel
📊 5 Interactive Analytical Pages – Overview, Plant, Product Type, Shift, and Month analysis.
📌 Executive KPI Cards – Maintenance %, Total Cost, Revenue, Maintenance Cost.
🎛 Right-Side Slicers – Filter by Plant, Product Type, Region, Shift, or Manager.
🏭 Plant-Level Cost & Revenue Tracking – Compare performance instantly.
📦 Product Profitability Analysis – Identify high-margin products.
👷 Shift-Wise Performance Monitoring – Track labor and cost efficiency.
📈 Monthly Trend Analysis – Detect revenue growth and cost spikes.
🔧 Maintenance Cost Tracking – Control machine-related expenses.
💡 Fully Customizable Excel Structure – Add plants, products, or KPIs easily.
📦 What’s Inside the Rubber Industry Dashboard in Excel
This structured Excel solution includes 5 powerful analytical pages along with Support and Data Sheets.
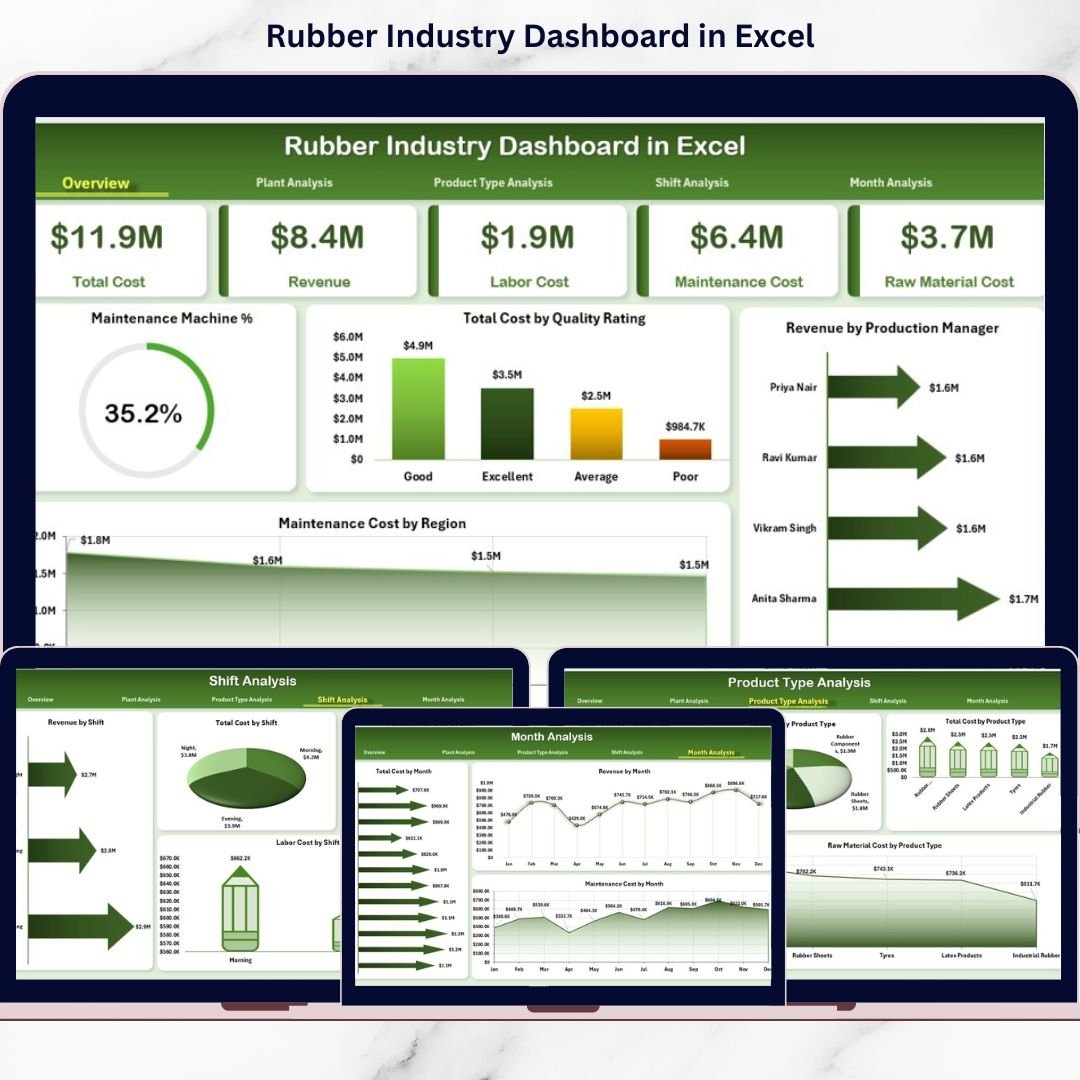
1️⃣ Overview Page – The Command Center
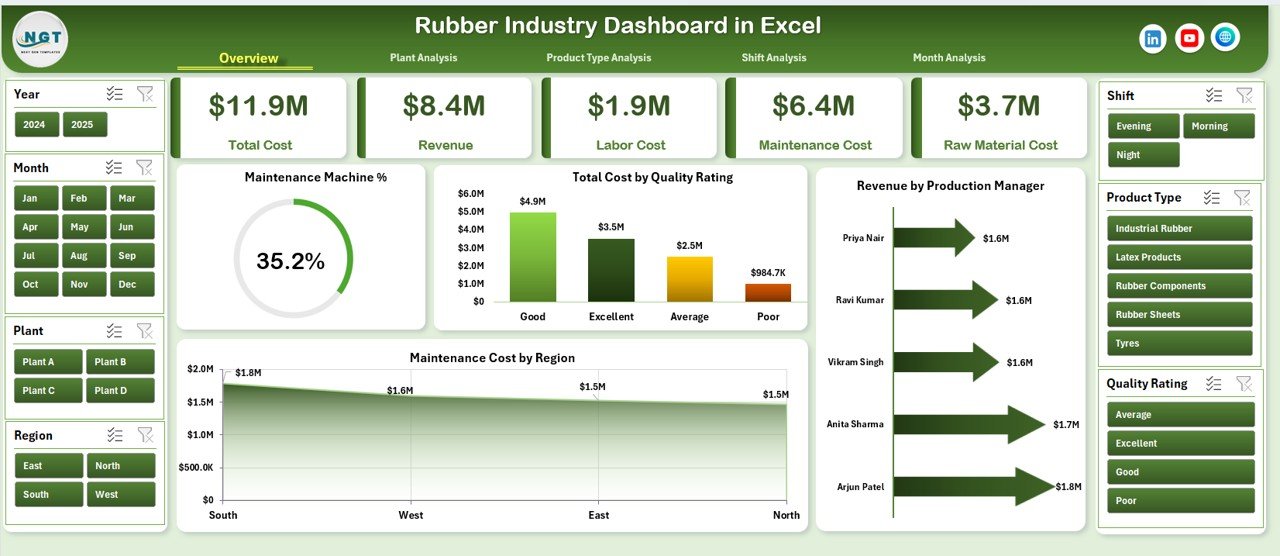
The Overview page gives leaders a complete performance snapshot.
✔ KPI Cards Include:
-
Maintenance Machine %
-
Total Cost
-
Total Revenue
-
Maintenance Cost
✔ Charts Included:
-
Maintenance Machine %
-
Total Cost by Quality Rating
-
Revenue by Production Manager
-
Maintenance Cost by Region
This page supports quick executive decisions by summarizing overall operations.
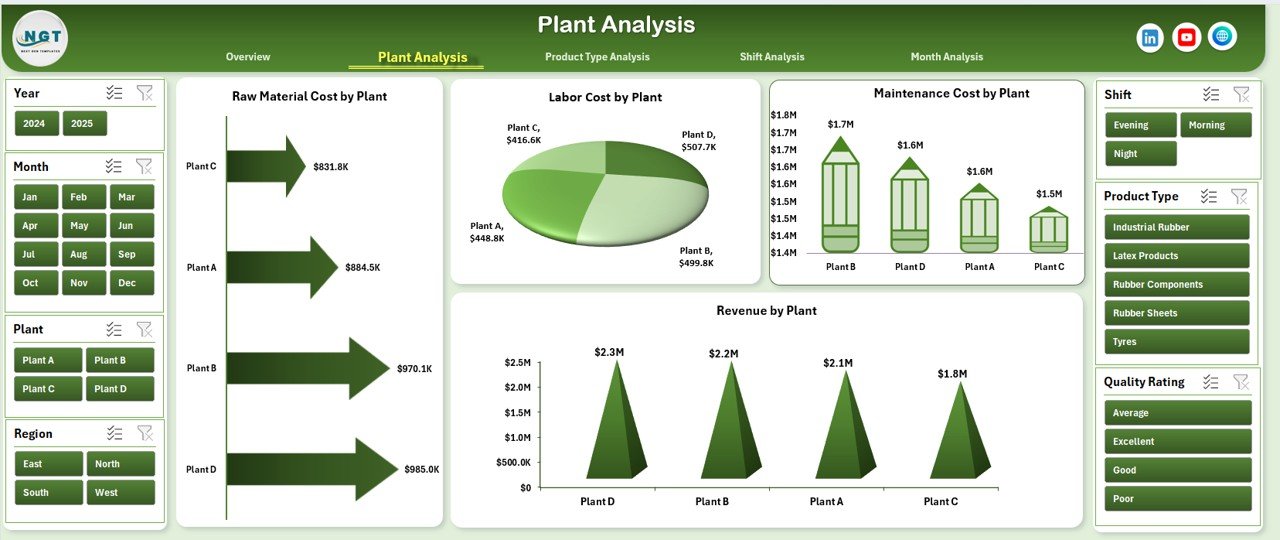
2️⃣ Plant Analysis – Compare Locations Clearly
Monitor performance across multiple manufacturing plants.
✔ Revenue by Plant
✔ Maintenance Cost by Plant
✔ Labor Cost by Plant
✔ Raw Material Cost by Plant
Identify high-cost plants. Improve underperforming units. Optimize resource allocation efficiently.
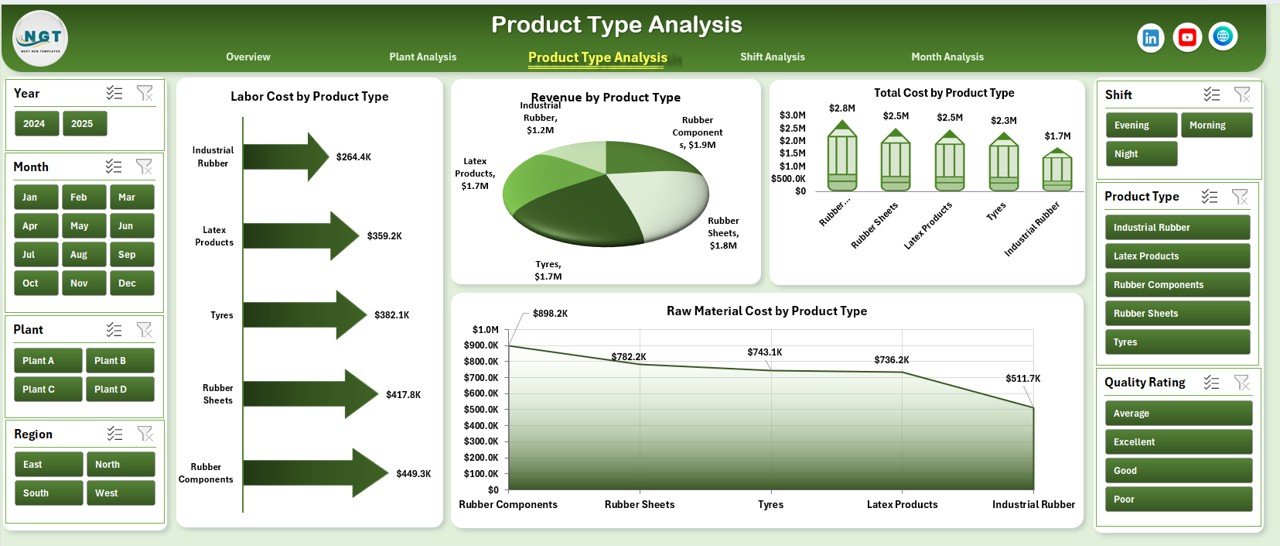
3️⃣ Product Type Analysis – Which Products Drive Profit?
Analyze rubber products such as:
Industrial sheets
Automotive components
Rubber seals
Rubber hoses
✔ Labor Cost by Product Type
✔ Revenue by Product Type
✔ Total Cost by Product Type
✔ Raw Material Cost by Product Type
Focus on profitable product lines and reduce cost-heavy segments.
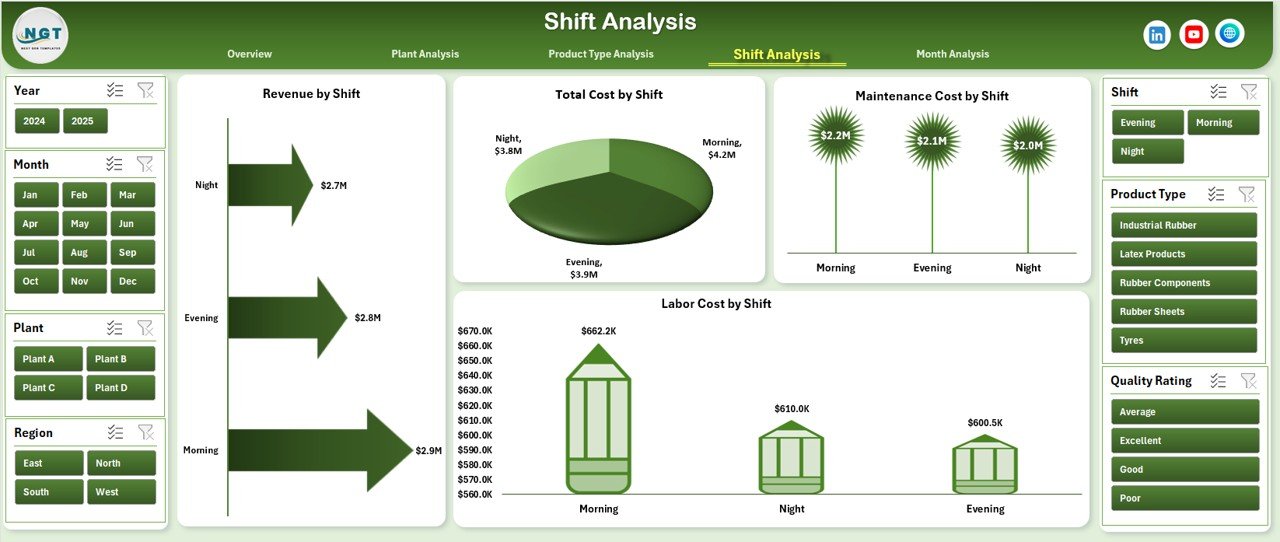
4️⃣ Shift Analysis – Improve Workforce Efficiency
Evaluate performance across:
Morning Shift
Evening Shift
Night Shift
✔ Labor Cost by Shift
✔ Revenue by Shift
✔ Total Cost by Shift
✔ Raw Material Cost by Shift
Detect inefficiencies. Improve shift planning. Reduce waste.
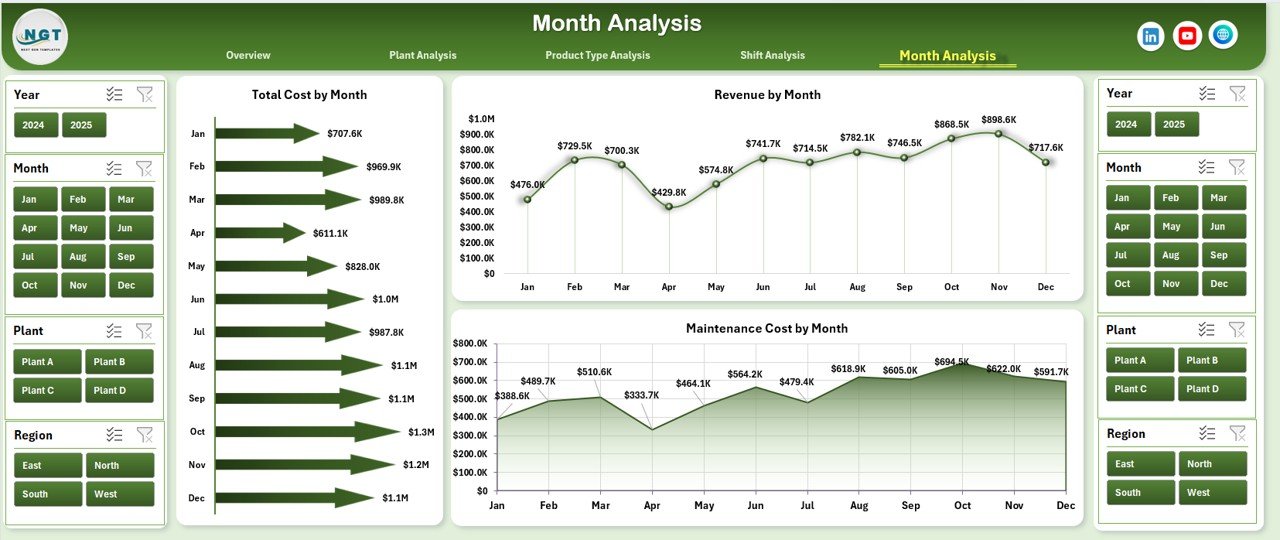
5️⃣ Month Analysis – Track Trends Over Time
✔ Revenue by Month
✔ Total Cost by Month
✔ Raw Material Cost by Month
Monitor seasonal changes, cost spikes, and revenue growth patterns.
🛠 How to Use the Rubber Industry Dashboard in Excel
1️⃣ Enter data in the Data Sheet
2️⃣ Verify plant, shift, and product names
3️⃣ Refresh Pivot Tables
4️⃣ Use slicers to filter by plant, region, or manager
5️⃣ Start with Overview page
6️⃣ Drill into Plant, Product, Shift, or Month analysis
7️⃣ Make data-driven operational decisions
No complex setup required.
👥 Who Can Benefit from This Rubber Industry Dashboard?
✔ Plant Managers
✔ Production Managers
✔ Operations Heads
✔ Maintenance Supervisors
✔ Cost Controllers
✔ Manufacturing Business Owners
Whether you operate one plant or multiple facilities, this dashboard simplifies monitoring.
📊 What KPIs Can You Track?
Maintenance Machine %
Revenue Growth
Total Production Cost
Labor Cost Ratio
Raw Material Cost %
Plant Profitability
Product Margin
Shift Efficiency
These KPIs directly impact profitability and operational efficiency.
💰 How This Dashboard Improves Profit Margins
When you monitor:
✔ Raw material cost trends
✔ Labor efficiency by shift
✔ Maintenance expenses
✔ Product profitability
✔ Plant-level revenue
You reduce waste.
You control costs.
You improve productivity.
You increase margins.
Data clarity leads to smarter manufacturing.
🔥 Advantages of Rubber Industry Dashboard in Excel
✅ Centralized Operational Control
✅ Instant Insights with Slicers
✅ Improved Maintenance Planning
✅ Plant & Product Comparison
✅ Cost Leakage Detection
✅ Real-Time Reporting
✅ Flexible & Customizable Design
✅ ERP-Friendly Data Import
Excel keeps it simple yet powerful.
Best Practices for Maximum Impact
✔ Update data daily or weekly
✔ Maintain clean and consistent naming
✔ Review KPIs weekly
✔ Monitor cost ratios regularly
✔ Analyze trends monthly
✔ Protect formula cells
✔ Train team members for accurate usage
Consistency ensures reliability.
Click here to read the Detailed blog post
Visit our YouTube channel to learn step-by-step video tutorials
YouTube Channel