Research & Development (R&D) institutes thrive on innovation, scientific discovery, and breakthrough technologies—but without structured performance visibility, even the best teams face delays, inefficiencies, and increased costs. Many R&D departments still rely on scattered spreadsheets, disconnected reports, and manual calculations, making it difficult to track key KPIs, timelines, targets, and productivity.
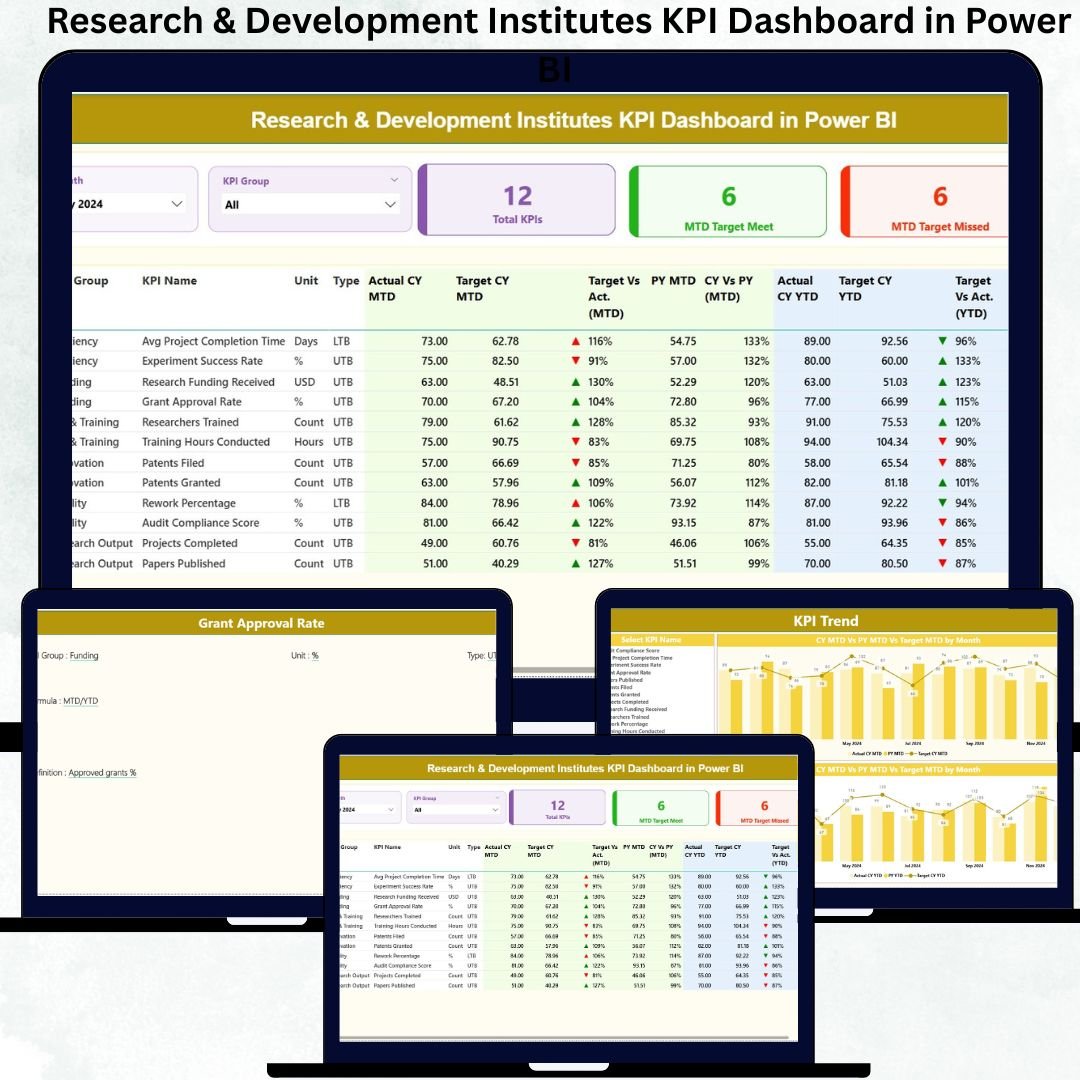
That is exactly why the Research & Development Institutes KPI Dashboard in Power BI is a game-changing solution. Research & Development Institutes KPI Dashboard in Power BI This powerful dashboard transforms raw data into visual intelligence, enabling leaders, scientists, program managers, and analysts to monitor every critical metric in real time. With this dashboard, R&D performance becomes measurable, transparent, and easy to improve.
Research & Development Institutes KPI Dashboard in Power BI This ready-to-use Power BI dashboard connects seamlessly with a simple Excel file and displays all KPIs through dynamic visuals. Users can instantly filter data by month or KPI group, monitor target achievements, compare year-over-year performance, and analyze trends with a few clicks. It turns complex R&D reporting into meaningful insights.
✨ Key Features of the Research & Development Institutes KPI Dashboard in Power BI
1. Summary Page – Complete Performance Visibility
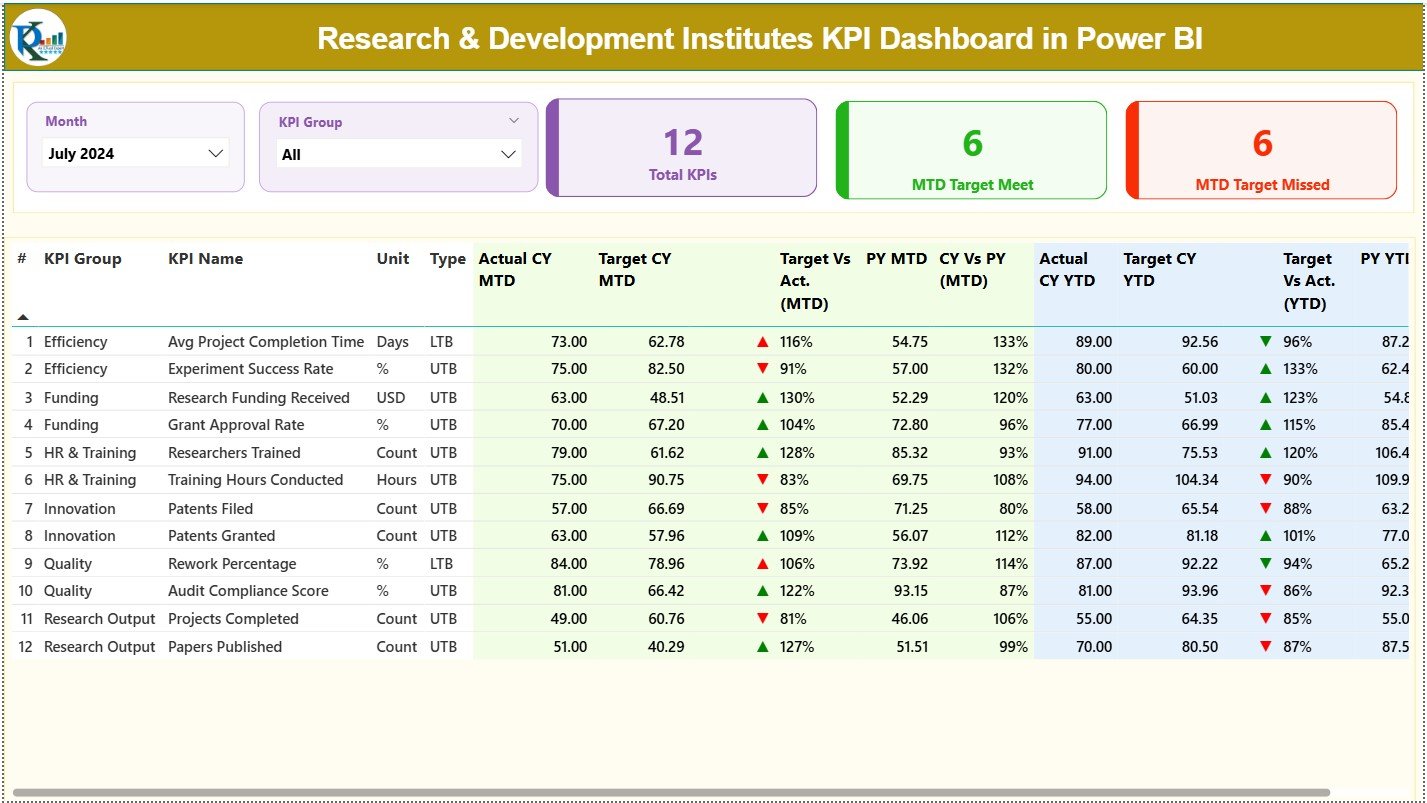
The Summary Page acts as the central intelligence hub.
At the top, Month and KPI Group slicers allow quick filtering.
You will see three high-level KPI cards:
-
Total KPIs Count
-
MTD Target Met Count
-
MTD Target Missed Count
Below the cards, a comprehensive KPI table displays:
-
KPI Number, Group, Name, Unit
-
KPI Type (UTB or LTB)
-
Actual vs Target (MTD & YTD)
-
PY comparisons
-
▲ / ▼ icons to highlight performance status
This page provides a complete picture of R&D effectiveness, efficiency, and target achievement.
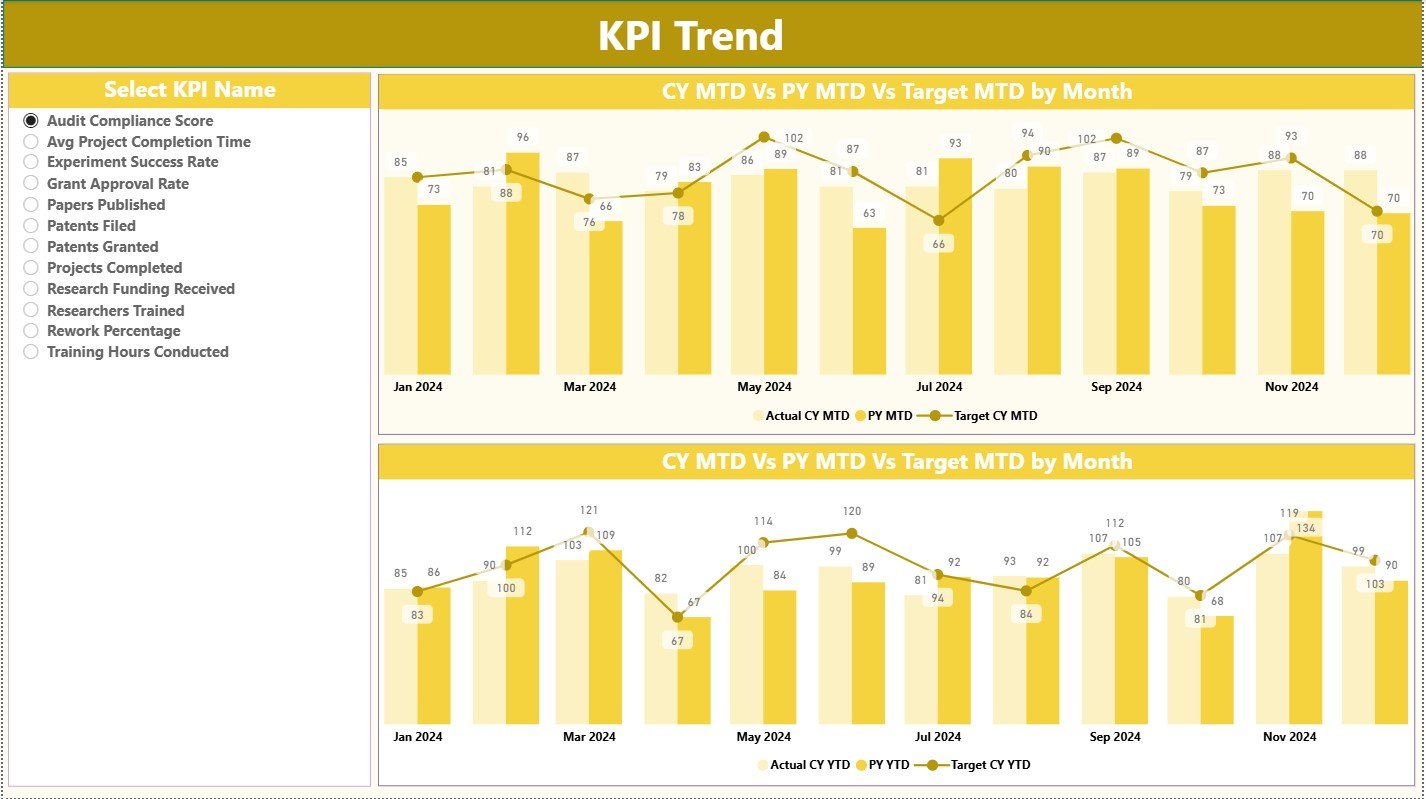
2. KPI Trend Page – Visual Trend Intelligence
This page displays MTD and YTD trend charts for any selected KPI.
Each chart compares:
-
Current Year Actual
-
Previous Year Actual
-
Target Values
These visuals help leaders understand progress, patterns, improvement areas, and long-term performance behavior—essential for scientific planning and research forecasting.
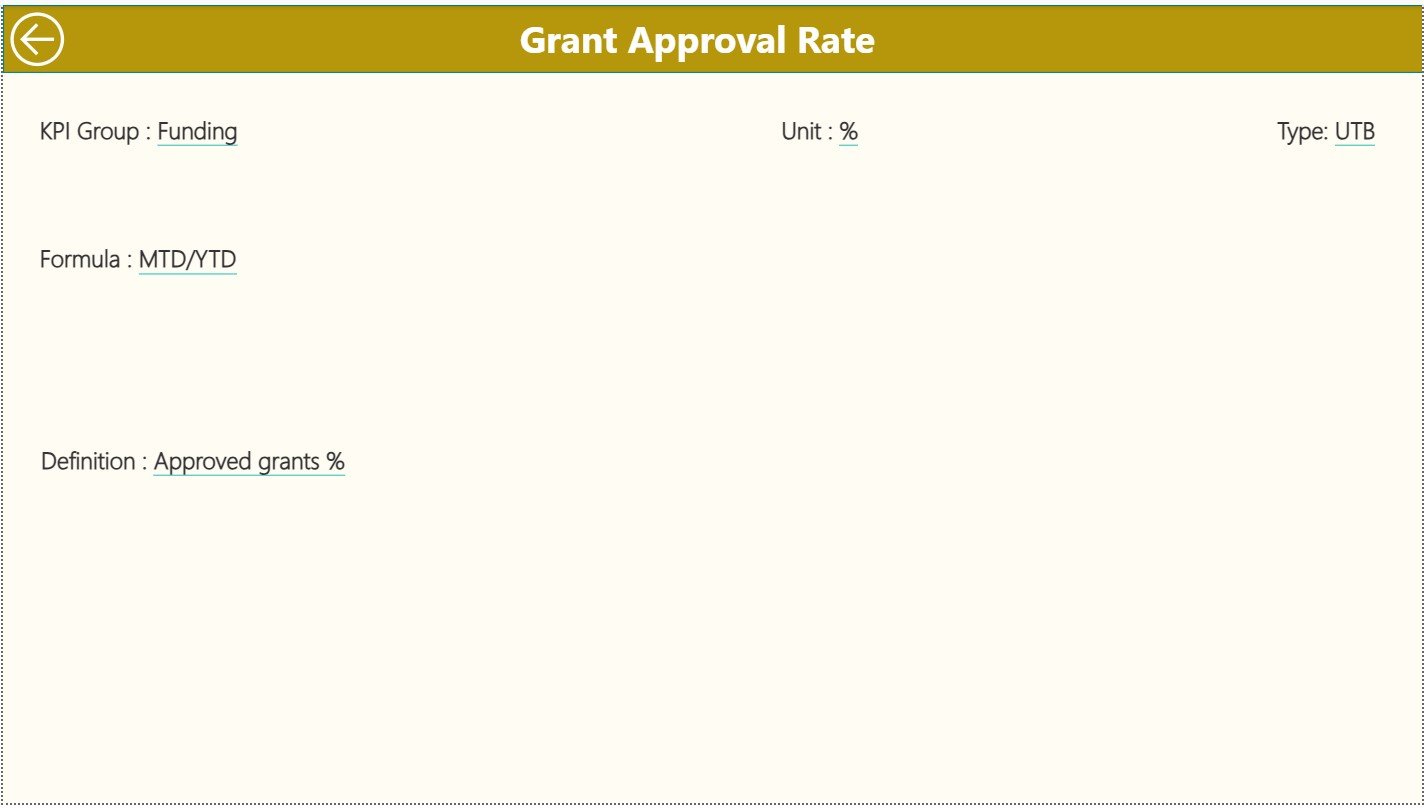
3. KPI Definition Page – Formula & Meaning Transparency
This drill-through page ensures complete clarity.
It shows:
-
KPI Formula
-
Definition
-
Unit
-
KPI Group
-
Type (UTB/LTB)
Teams no longer guess KPI meanings—everything is documented and visible. Perfect for cross-functional teams and new members.
📊 What’s Inside the Dashboard (Excel + Power BI Structure)
The dashboard runs on three simple Excel sheets:
-
Input Actual → MTD & YTD actual values
-
Input Target → MTD & YTD target values
-
KPI Definition → Formulas, descriptions, KPI metadata
Update the Excel file → Refresh Power BI → Get clean, updated insights instantly.
🧠 Who Can Benefit from This Dashboard?
-
R&D Directors & Leaders
-
Program & Project Managers
-
Scientists & Researchers
-
Innovation & Technology Teams
-
Data Analysts & Performance Teams
-
Government, Private & Academic Research Units
If your work involves scientific progress, breakthrough development, or innovation management, this dashboard is the perfect tool.
📌 How to Use the Research & Development KPI Dashboard
-
Enter actual & target values into Excel.
-
Refresh the Power BI file.
-
Use slicers to filter by month or KPI group.
-
Drill through for KPI definitions and formulas.
-
Analyze trends, target performance, and YOY comparisons.
-
Take data-driven decisions for research excellence.
🌟 Advantages of This Dashboard
-
🔍 Real-time visibility across all research KPIs
-
📈 Clear trend charts for strategic analysis
-
🧪 Better experiment, prototype, and project control
-
🎯 Quick target tracking with intuitive indicators
-
💡 Zero manual reporting workload
-
🔧 Fully customizable using Excel
-
🤝 Improved transparency for stakeholders
This dashboard helps R&D organizations innovate faster, reduce risks, and simplify complex performance tracking.


Reviews
There are no reviews yet.