


Rental Property Investment Dashboard in HTML is a powerful, interactive, and professionally designed browser-based dashboard template built for property investors, landlords, real estate portfolio managers, and financial analysts who want to track every critical aspect of their rental property investments from a single, unified interface. This template includes 5 interactive dashboard pages covering portfolio overview, financial analysis, property insights, risk and financing, and a detailed data view — making it the most comprehensive HTML-based rental property analytics solution available today.
If you have been looking for a modern, data-driven solution to manage your rental property portfolio without installing any software, the Rental Property Investment Dashboard in HTML is exactly what you need. Simply unzip the file, open it in any modern browser like Chrome, Firefox, or Edge, and start analyzing your property investments instantly. This dashboard transforms raw rental property data into beautiful, actionable visual insights that help you maximize returns and minimize risk 🚀.
🔑 Key Features of Rental Property Investment Dashboard in HTML
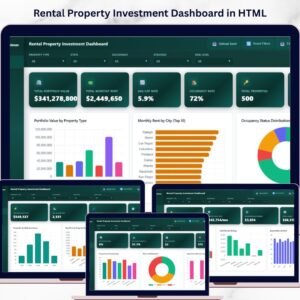
📊 Real-Time KPI Monitoring – Track 6 essential rental property metrics including Total Portfolio Value, Total Monthly Rent, Avg Cap Rate, Occupancy Rate, Total Properties, and Avg ROI — all displayed as dynamic KPI cards on the Overview page for instant performance visibility.
📈 5 Interactive Dashboard Pages – This template includes 5 dedicated analysis pages: Overview, Financial Analysis, Property Insights, Risk and Financing, and Data View — each designed to give you deep insights into a specific dimension of your rental property portfolio.
🎯 Smart Slicers and Filters – Instantly filter your data by property type, city, state, investment strategy, occupancy status, and more. Drill down into the numbers that matter most to your investment portfolio with just a few clicks.
📉 Comprehensive Chart Library – Visualize your property data through interactive charts such as Portfolio Value by Property Type, Monthly Rent by City, Occupancy Status Distribution, Investment Strategy Breakdown, Revenue vs Expenses by Property Type, Cash Flow by Strategy, and many more.
🏠 Financial Analysis Tools – The dedicated Financial Analysis page lets you evaluate revenue versus expenses by property type, track cash flow by strategy, monitor appreciation by state, and break down expenses by category — helping you identify your most profitable investments.
💰 Risk and Financing Insights – Analyze properties by financing type, view risk level distribution, compare average interest rates by financing type, and evaluate properties by risk and strategy to make smarter investment decisions.
🖥️ Browser-Based — No Software Needed – This dashboard runs entirely inside your web browser. There is no need to install Excel, Power BI, or any other software. Just open the HTML file and you are ready to analyze your rental property portfolio.
📱 Data Explorer with Search and Export – The Data View page provides a comprehensive data table with search, sort, pagination, and CSV export functionality — giving you full control over your raw property data.
If you are also looking for a similar dashboard in Excel, check out the Rental Property Investment Dashboard in Excel. For a Power BI version, explore the Rental Property Investment Dashboard in Power BI. Browse all our HTML Dashboard Templates and Real Estate Templates for more options.
📦 What’s Inside the Rental Property Investment Dashboard in HTML
This dashboard template contains 5 interactive pages packed with powerful analytics for comprehensive rental property management:
📌 Overview Page – High-level KPI cards showing Total Portfolio Value, Total Monthly Rent, Avg Cap Rate, Occupancy Rate, Total Properties, and Avg ROI. Charts include Portfolio Value by Property Type, Monthly Rent by City, Occupancy Status Distribution, Investment Strategy Breakdown, and Purchase Price vs Current Value Trend. Multiple slicers are available to quickly filter and analyze your data.
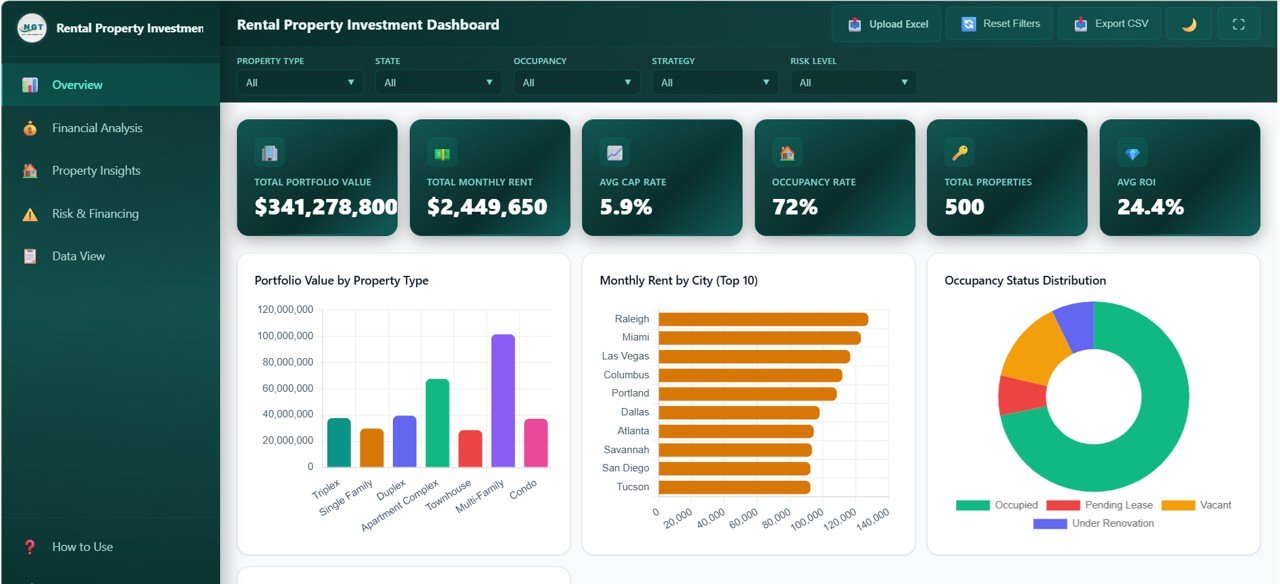
Overview Page
📌 Financial Analysis – Deep-dive into financial performance with charts for Revenue vs Expenses by Property Type, Cash Flow by Strategy, Appreciation by State, and Expense Breakdown by Category. Quickly identify the most profitable property types and investment strategies.
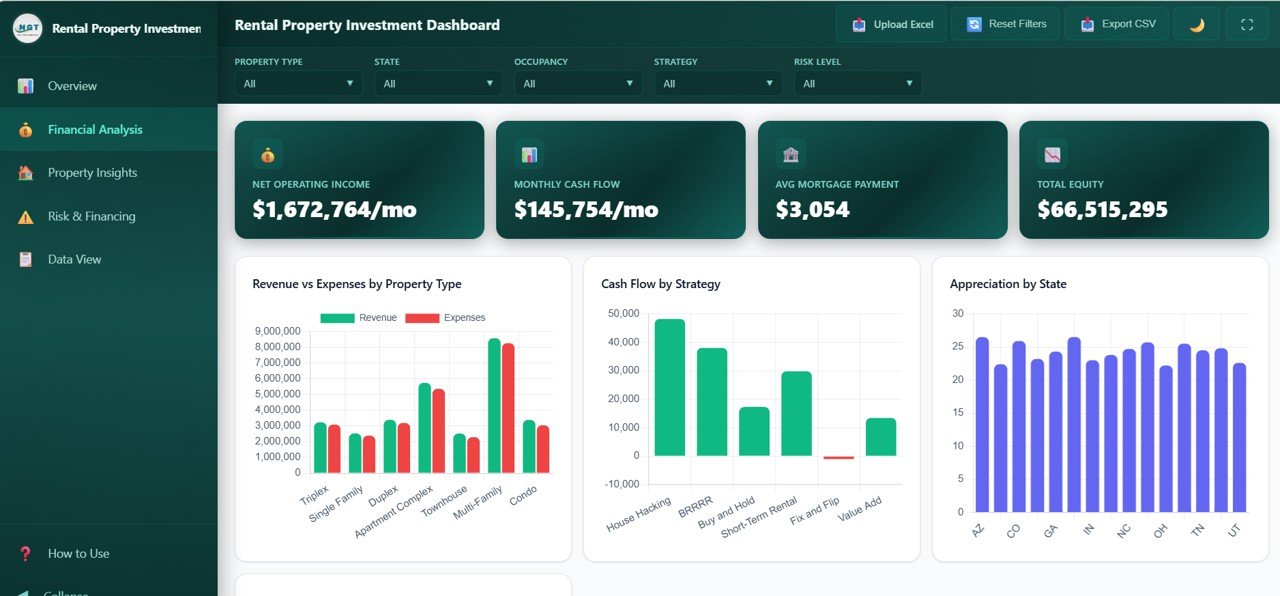
Financial Analysis
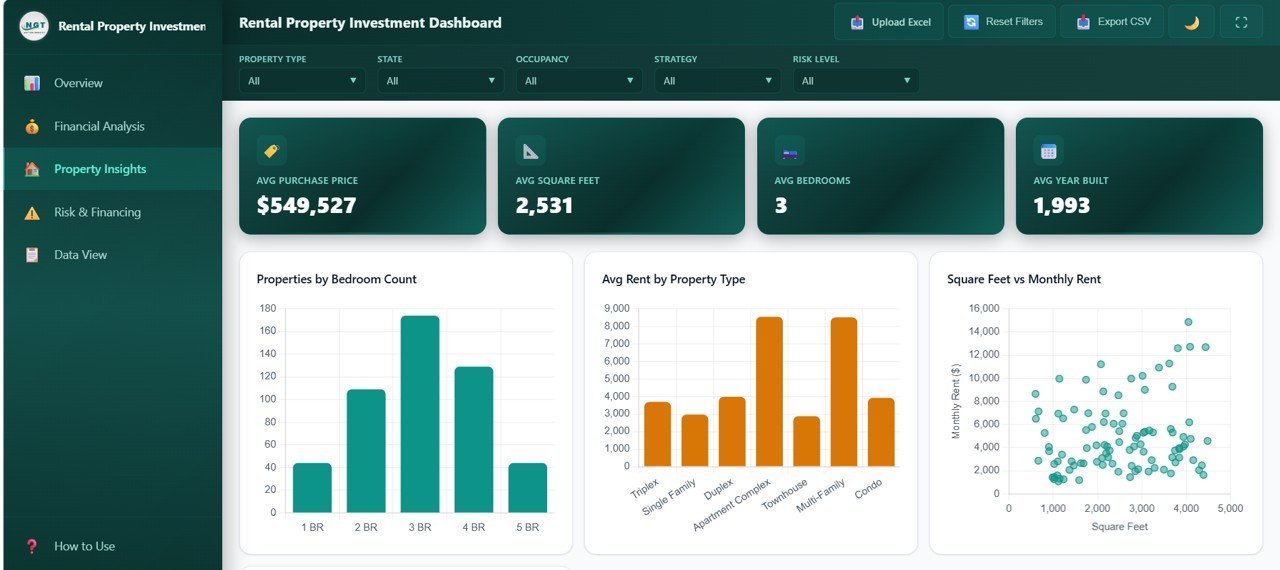
📌 Property Insights – Analyzes your portfolio with charts for Properties by Bedroom Count, Average Rent by Property Type, Square Feet vs Monthly Rent, and Properties by Neighborhood. Understand which property configurations generate the most rental income.
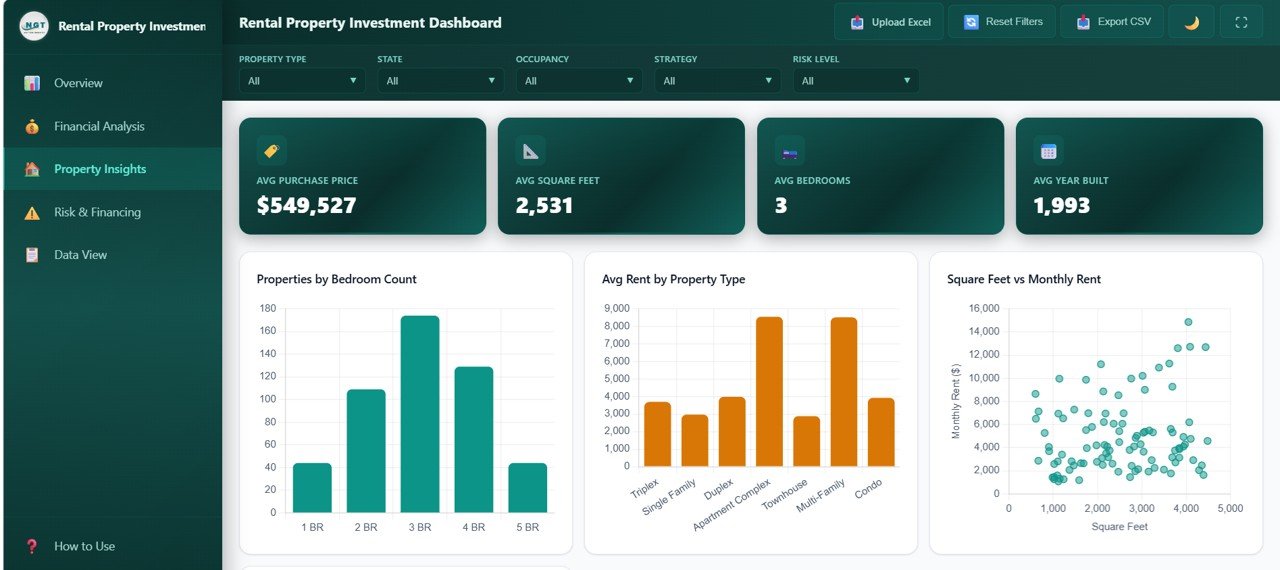
Property Insights
📌 Risk and Financing – Evaluates investment risk and financing with charts showing Properties by Financing Type, Risk Level Distribution, Average Interest Rate by Financing Type, and Properties by Risk and Strategy. Make data-backed decisions on portfolio risk management.
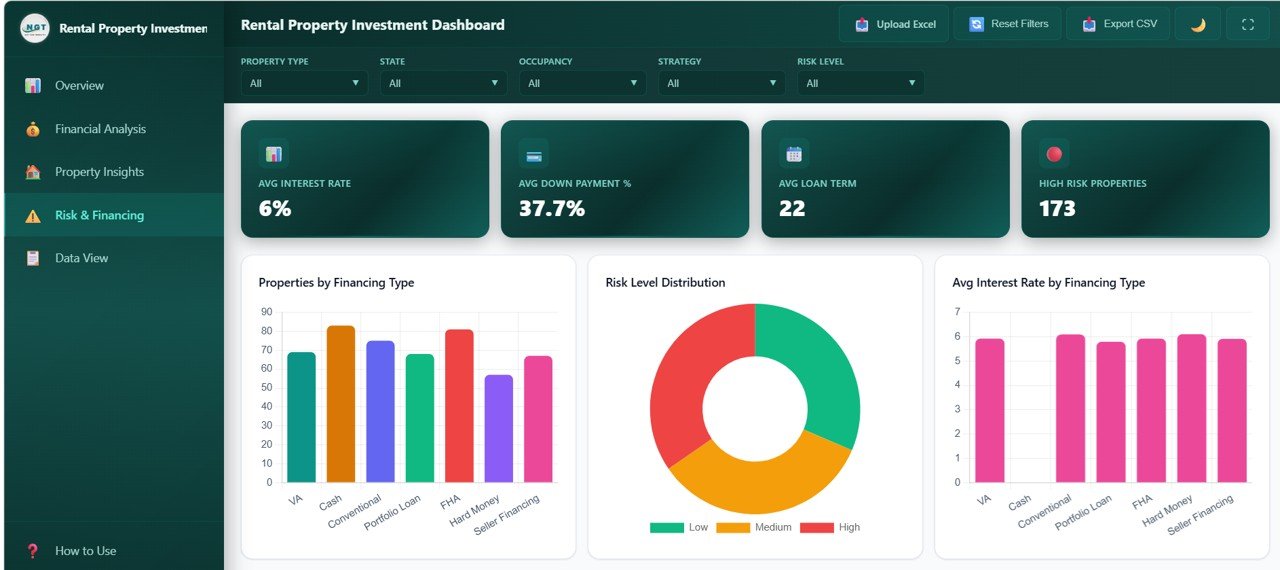
Risk and Financing
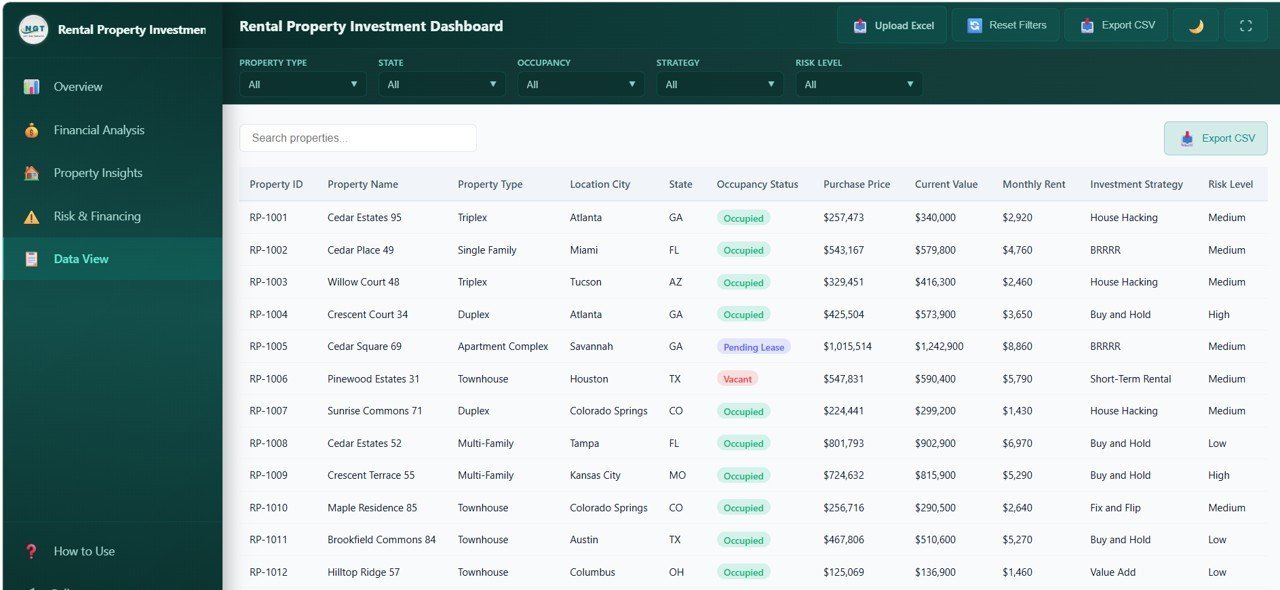
📌 Data View – A detailed data table page where you can see all property records with search, sort, and pagination features. You can also export the filtered data to CSV for further analysis.

Data View
⚙️ How to Use the Rental Property Investment Dashboard in HTML
1️⃣ Download the ZIP file after purchase and extract it on your computer.
2️⃣ Open the index.html file in any modern browser like Chrome, Firefox, Edge, or Safari.
3️⃣ Navigate through the 5 dashboard tabs — Overview, Financial Analysis, Property Insights, Risk and Financing, and Data View — to explore your rental property analytics.
4️⃣ Replace the sample data with your own rental property data to get real-time insights.
5️⃣ Use the built-in slicers and filters to narrow down your analysis by property type, city, state, strategy, and more.
6️⃣ Export data from the Data View tab to CSV for presentations or further analysis.
👥 Who Can Benefit from This Rental Property Investment Dashboard in HTML
🏘️ Property Investors – Track ROI, portfolio value, cap rates, and rental income across all your investment properties in one place.
🏢 Real Estate Portfolio Managers – Monitor occupancy, vacancy trends, and financial performance by property type and location.
📋 Landlords and Property Owners – Keep a close eye on rent collection, expenses, and financing details without complex spreadsheets.
💼 Real Estate Analysts – Generate presentation-ready dashboards for stakeholders, banks, and partners with interactive property analytics.
🏦 Financial Advisors – Evaluate rental property investment portfolios with comprehensive risk analysis and financial breakdowns.
📊 Students and Educators – Use this as a learning tool or project submission for data analytics and real estate management courses.
❓ Frequently Asked Questions
What KPIs does the Rental Property Investment Dashboard in HTML track?
The Rental Property Investment Dashboard in HTML tracks 6 key performance indicators including Total Portfolio Value, Total Monthly Rent, Avg Cap Rate, Occupancy Rate, Total Properties, and Avg ROI. It also includes detailed financial analysis across revenue, expenses, cash flow, appreciation, and risk metrics.
Do I need any software to use this HTML dashboard?
No. This dashboard runs entirely in your web browser. Simply unzip the downloaded file and open index.html in Chrome, Firefox, Edge, or Safari. No installation, plugins, or licenses are required.
How many dashboard pages are included in this template?
This template includes 5 fully interactive dashboard pages: Overview, Financial Analysis, Property Insights, Risk and Financing, and Data View. Each page focuses on a different aspect of rental property investment management.
Can I customize the data in this HTML dashboard?
Yes. Replace the sample data with your own rental property data to get personalized insights. The dashboard automatically updates all charts, KPIs, and filters based on the data you provide.
What is the best HTML dashboard template for tracking rental property investments?
The Rental Property Investment Dashboard in HTML from NextGenTemplates is one of the best options available. It includes 5 interactive pages covering portfolio overview, financial analysis, property insights, risk assessment, and a data explorer — all in a professionally designed, browser-based template that requires no software installation.
🔗 Explore Related Templates
🔹 Rental Property Investment Dashboard in Excel – The Excel version of this dashboard for users who prefer Microsoft Excel with pivot tables and slicers.
🔹 Rental Property Investment Dashboard in Power BI – The Power BI version with advanced DAX measures and interactive visualizations.
🔹 Real Estate Dashboard in HTML – A browser-based real estate analytics dashboard with property, agent, and regional analysis.
🔹 Hospitality Dashboard in HTML – Track hotel and resort performance with revenue, occupancy, and guest satisfaction analytics.
📖 Click here to read the Detailed Blog Post about Rental Property Investment Dashboard in HTML
🎥 Visit our YouTube channel to learn step-by-step video tutorials
👉 YouTube.com/@NextGenTemplates


Reviews
There are no reviews yet.