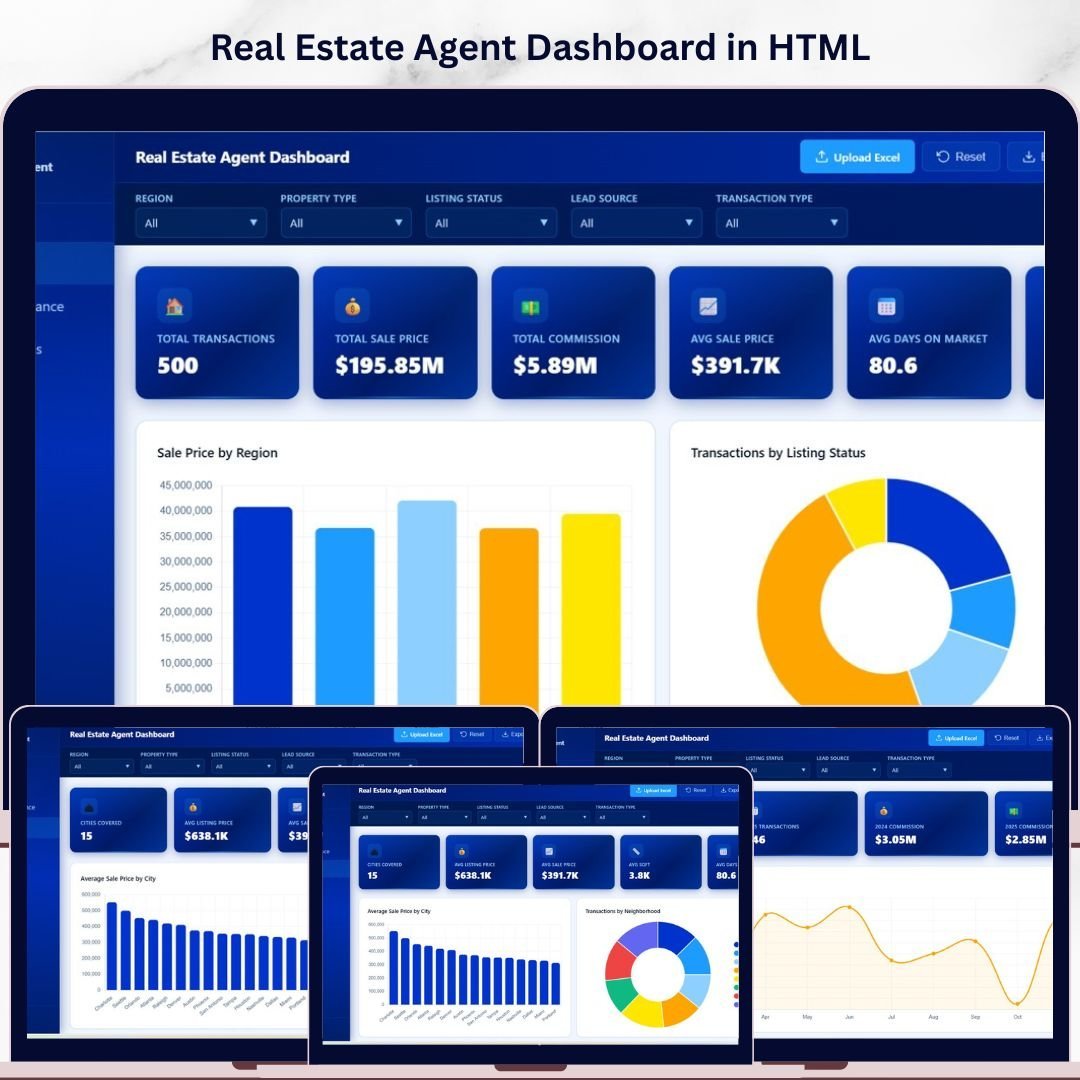


🔑 Key Features of Real Estate Agent Dashboard in HTML
Real Estate Agent Dashboard in HTML is a powerful, browser-based analytics tool designed to help real estate professionals monitor agent performance, track commissions, analyze market trends, and make smarter decisions. This dashboard includes 5 interactive pages covering everything from high-level overviews to granular sales data — all viewable in any modern web browser with no software installation required.
This template tracks 6 key performance indicators including Total Transactions, Total Sale Price, Total Commission, Average Sale Price, Average Days On Market, and Average Client Satisfaction. With interactive slicers and filters, you can quickly drill down into specific regions, property types, lead sources, and listing statuses. Whether you are an individual real estate agent or managing a team of agents, this dashboard gives you the insights you need to boost productivity and close more deals.
Explore our complete range of HTML Dashboard Templates for every industry and department.
📦 What’s Inside the Real Estate Agent Dashboard
This dashboard contains 5 professionally designed pages:
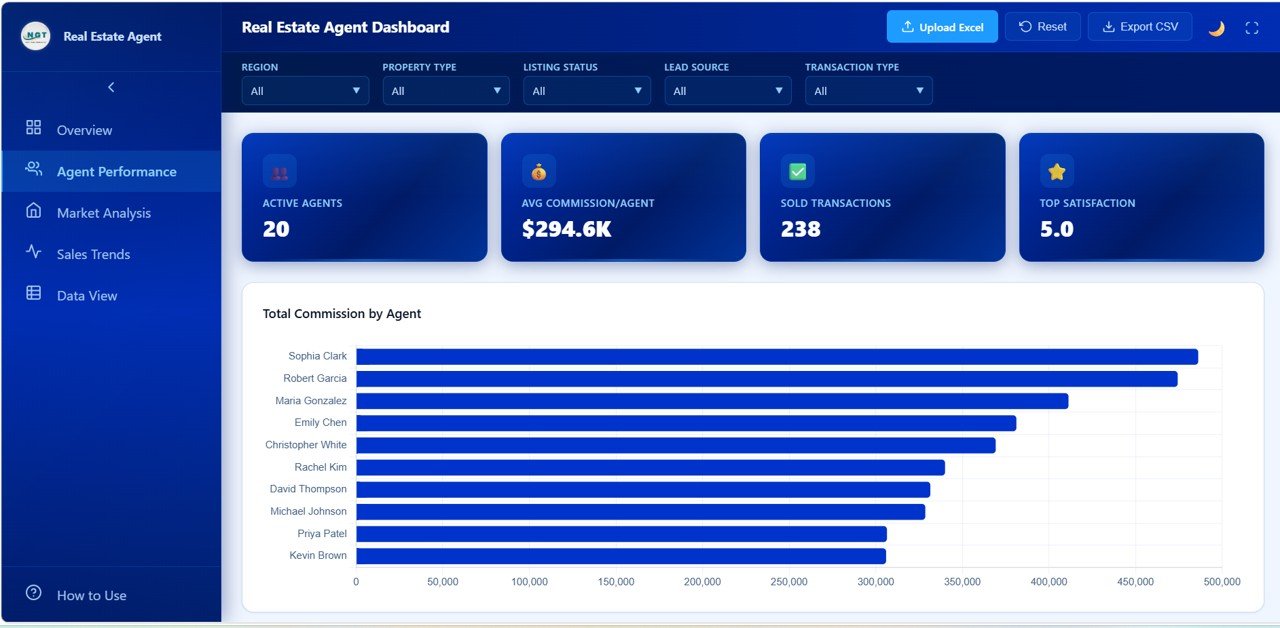
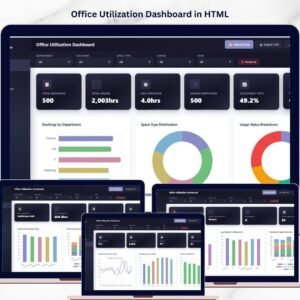
📊 Overview Page — Displays high-level KPI cards for Total Transactions, Total Sale Price, Total Commission, Average Sale Price, Average Days On Market, and Average Client Satisfaction. Features interactive charts including Sale Price by Region, Transactions by Listing Status, Commission by Property Type, Transactions by Lead Source, and Monthly Sale Price Trend. Multiple slicers let you filter the entire dashboard instantly.
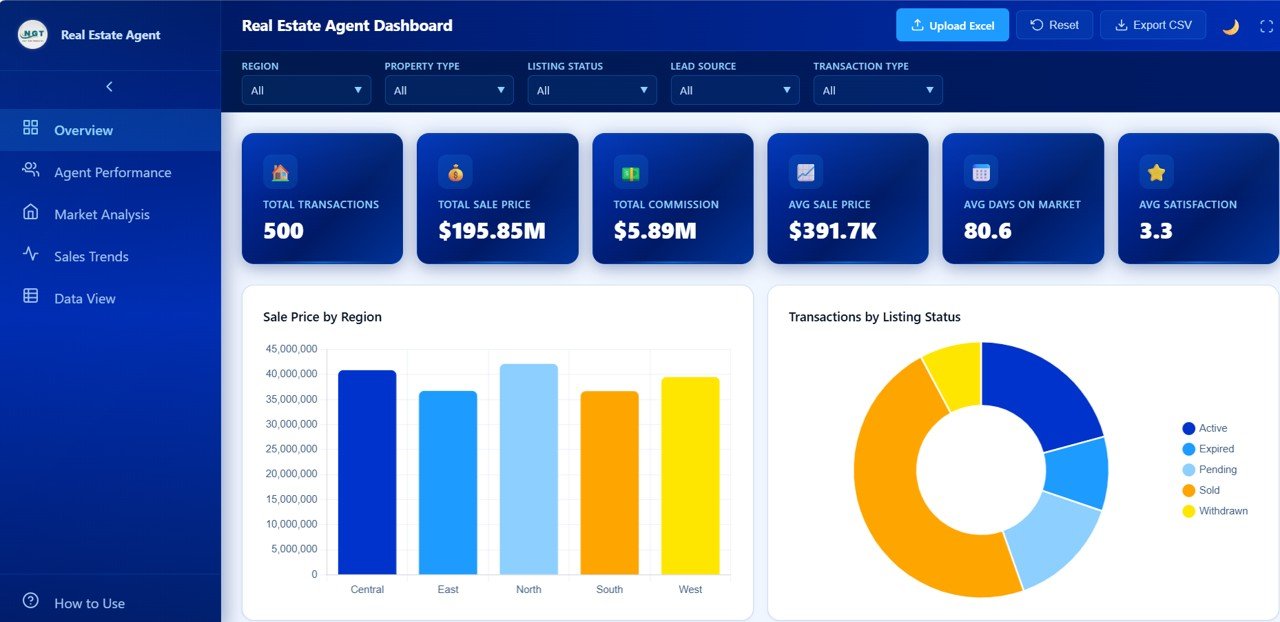 Real Estate Agent Overview
📈 Agent Performance — Analyze individual agent metrics with charts for Total Commission by Agent, Average Client Satisfaction by Agent, Average Days On Market by Agent, Transactions by Agent, and Sold Ratio by Agent. Identify your top performers and areas for coaching at a glance.
 Agent Performance
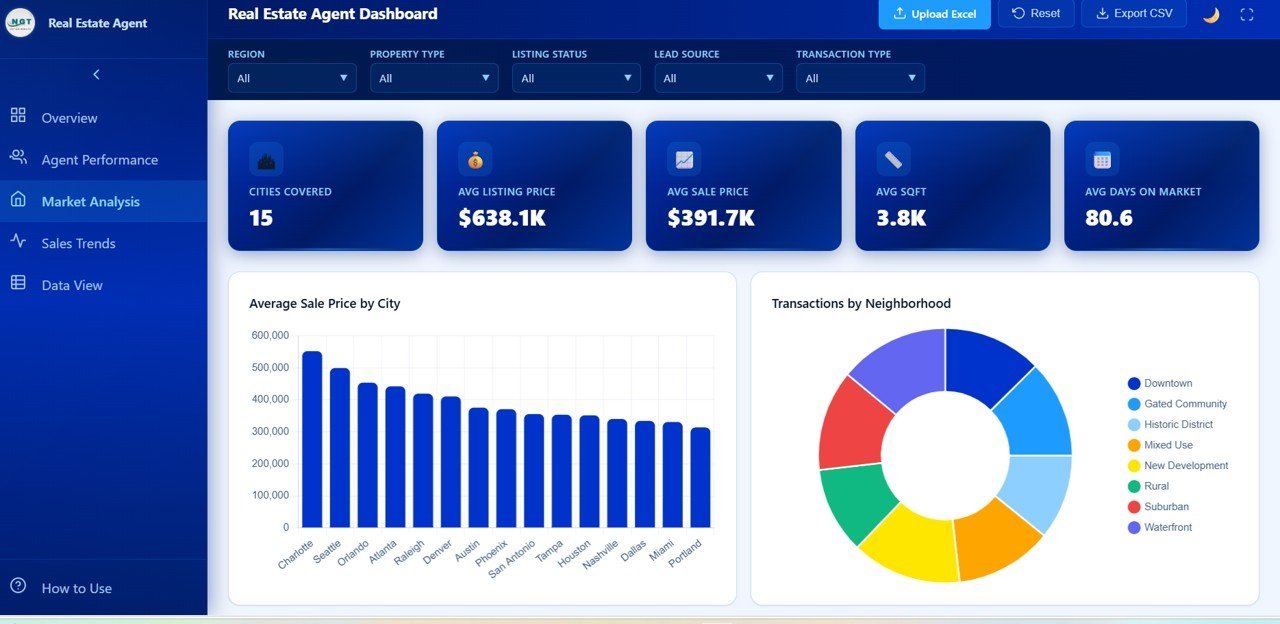
🏘️ Market Analysis — Dive into location-based insights with Average Sale Price by City, Transactions by Neighborhood, Average Price by Property Type, Days On Market by Region, and Listing Price vs Sale Price by City. Understand market dynamics and pricing trends across different areas.
 Market Analysis
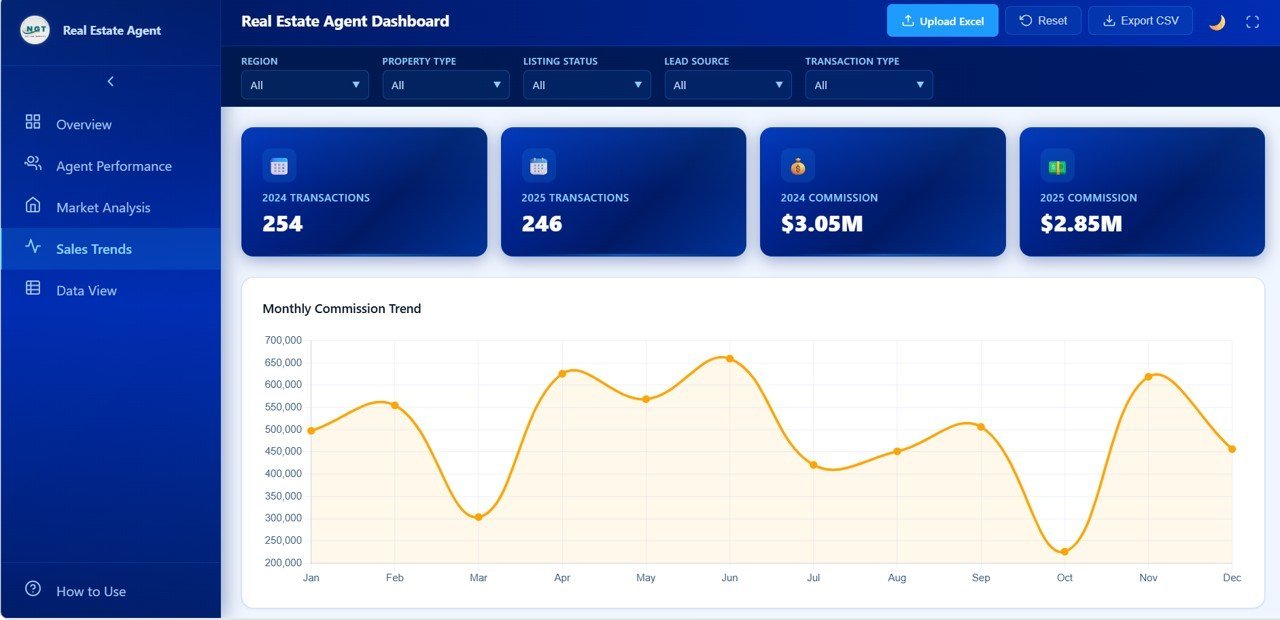
📅 Sales Trends — Track time-based patterns with Monthly Commission Trend, Monthly Transactions by Year, Average Days On Market by Month, Sale Price by Transaction Type, and Commission by Year. Spot seasonal patterns and year-over-year growth.
 Sales Trends
📋 Data View — A detailed data table page with search, sort, and pagination features. Export filtered data to CSV for further analysis or reporting.
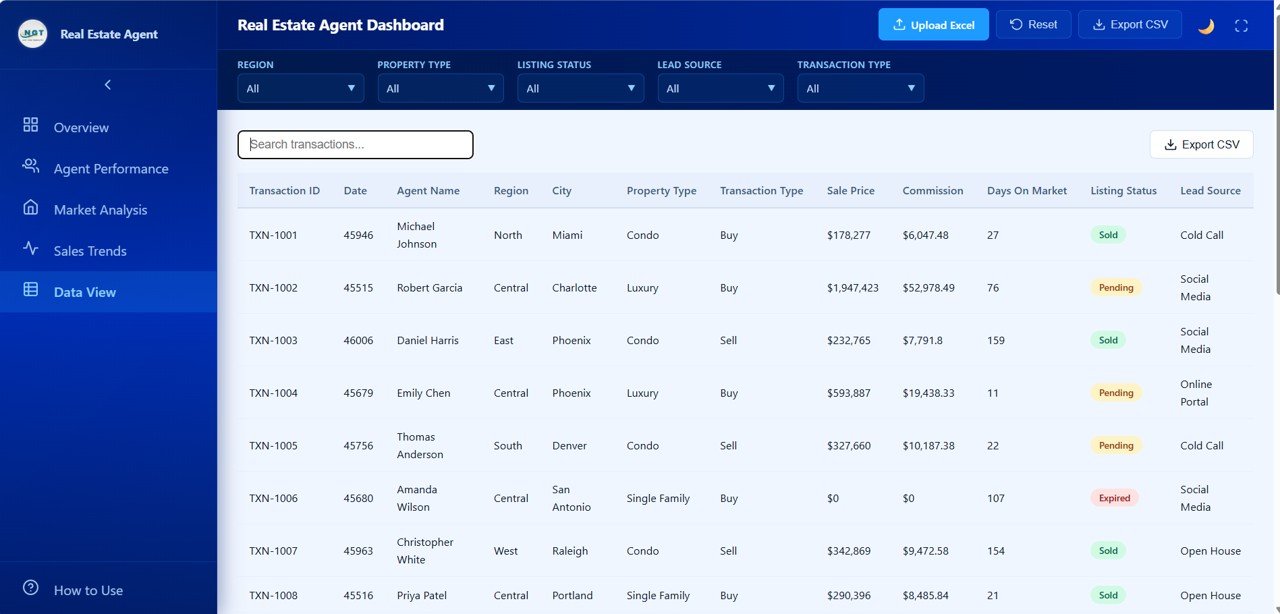 Data View
⚙️ How to Use the Real Estate Agent Dashboard
1️⃣ Download and unzip the file to your computer.
2️⃣ Open the index.html file in any modern browser such as Chrome, Edge, or Firefox.
3️⃣ Replace the sample data in the data file with your own real estate transaction records.
4️⃣ Use the interactive slicers and filters to analyze performance by region, agent, property type, or time period.
5️⃣ Export data from the Data View page to CSV for sharing with stakeholders.
👥 Who Can Benefit from This Dashboard
🔹 Real estate agents tracking personal sales and commission performance
🔹 Real estate brokerages monitoring team productivity and market trends
🔹 Property managers analyzing listing performance and days on market
🔹 Real estate investors evaluating neighborhood and city-level pricing data
🔹 Sales managers comparing agent performance and identifying coaching opportunities
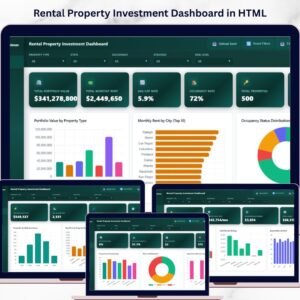
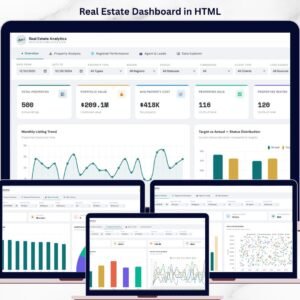
Also check out our Real Estate Dashboard in HTML and Rental Property Investment Dashboard in HTML for related analytics solutions.
❓ Frequently Asked Questions
What KPIs does the Real Estate Agent Dashboard track?
The Real Estate Agent Dashboard in HTML tracks 6 key metrics: Total Transactions, Total Sale Price, Total Commission, Average Sale Price, Average Days On Market, and Average Client Satisfaction. These KPIs are displayed as interactive cards on the Overview page.
Can I use this dashboard without any coding knowledge?
Yes. Simply unzip the downloaded file and open index.html in any modern web browser. Replace the sample data with your own records and the dashboard updates automatically. No programming or coding skills are needed.
What is the best HTML dashboard for real estate agents?
The Real Estate Agent Dashboard in HTML by NextGenTemplates is one of the best options available. It includes 5 interactive pages covering agent performance, market analysis, sales trends, and a full data table with export capabilities — all running directly in your browser.
How do I track real estate agent commissions with this template?
The dashboard provides Total Commission as a KPI card on the Overview page, Commission by Property Type as a chart, and dedicated Agent Performance page showing Total Commission by Agent. The Sales Trends page also includes Monthly Commission Trend and Commission by Year charts.
Does this dashboard support data filtering?
Yes. The Overview page includes multiple interactive slicers that let you filter all charts and KPIs by region, property type, listing status, lead source, and time period. The Data View page also supports search, sort, and CSV export.
🔗 Explore Related Templates
🔹 Real Estate Dashboard in HTML — Comprehensive real estate analytics for property listings and market overview.
🔹 Rental Property Investment Dashboard in HTML — Track rental income, expenses, occupancy rates, and investment returns.
🔹 Construction Dashboard in HTML — Monitor construction project progress, budgets, and timelines.
📖 Click here to read the Detailed Blog Post
Watch the step-by-step video tutorial:


Reviews
There are no reviews yet.