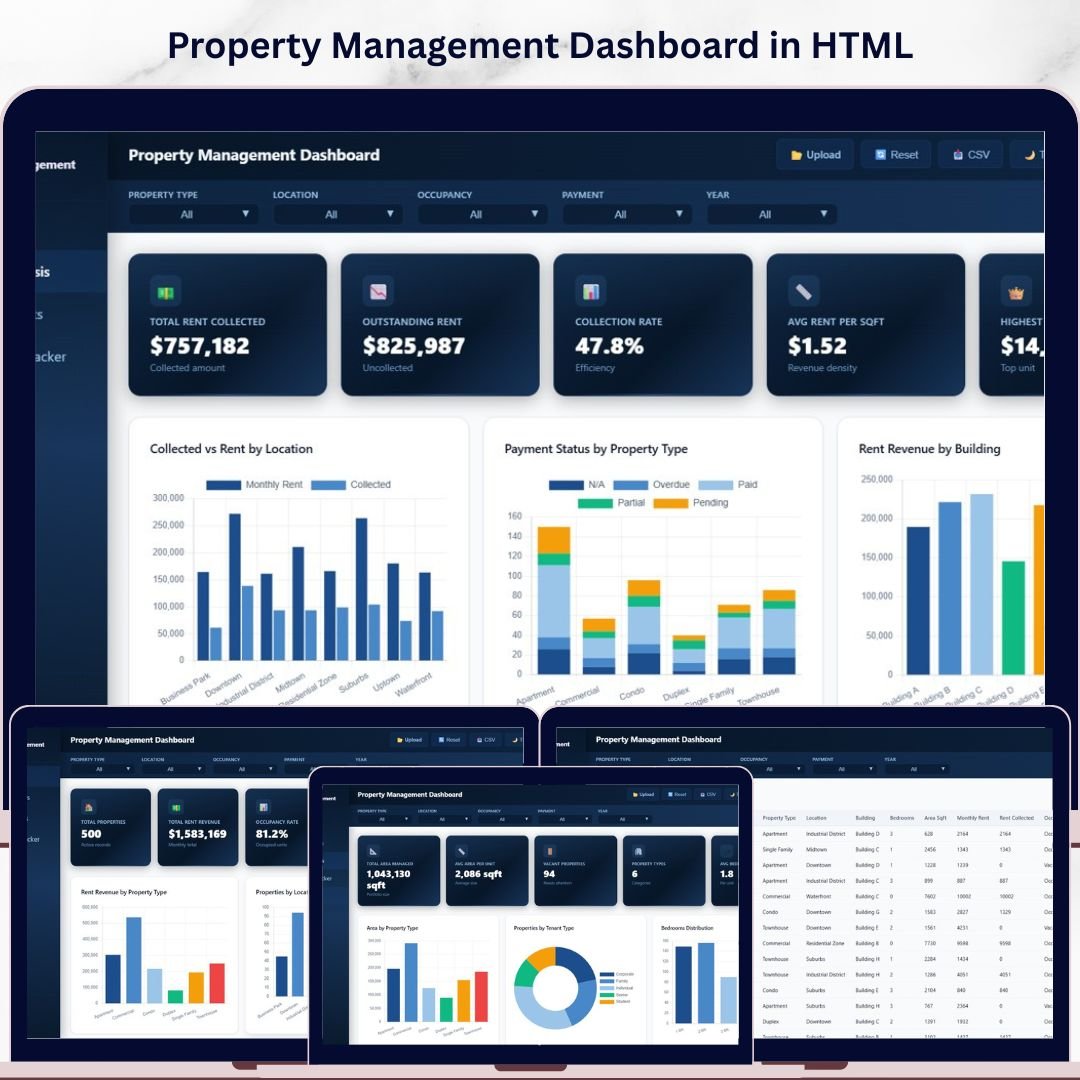
Property Management Dashboard in HTML is a powerful, interactive, and professionally designed browser-based dashboard template built for property managers, landlords, real estate investors, and facilities operations teams who need to track rent revenue, occupancy, tenant satisfaction, maintenance costs, and property performance — all from a single unified HTML dashboard. This template includes 5 interactive dashboard pages covering an overview, financial analysis, property insights, maintenance tracking, and a detailed data view — making it one of the most comprehensive HTML-based property management analytics solutions available today.
If you have been searching for a modern, browser-based solution to manage your property portfolio without installing any software, the Property Management Dashboard in HTML is exactly what you need. Simply unzip the downloaded file, open index.html in any modern browser like Chrome, Firefox, or Edge, and start analyzing your property data instantly. This dashboard transforms raw property management data into beautiful, actionable visual insights that help you maximize occupancy, minimize maintenance costs, and improve tenant satisfaction 🚀. Explore our complete collection of HTML Dashboard Templates and Real Estate Templates for more options.
🔑 Key Features of Property Management Dashboard in HTML
📊 5 Interactive Dashboard Pages – Overview, Financial Analysis, Property Insights, Maintenance Tracker, and Data View give you 360-degree visibility into your property management operations across every critical metric.
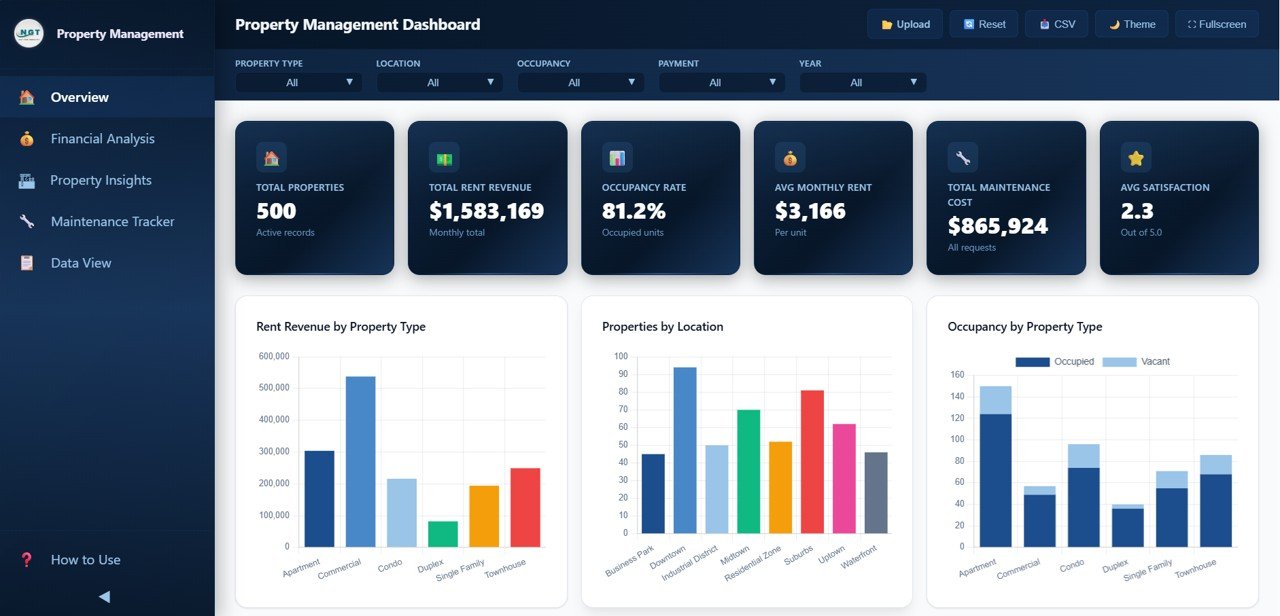
📈 6 Dynamic KPI Cards – Instantly track Total Properties, Total Rent Revenue, Occupancy Rate, Avg Monthly Rent, Total Maintenance Cost, and Avg Tenant Satisfaction from the Overview page for at-a-glance decision-making.
🎯 Smart Slicers and Filters – Instantly filter your data by property type, location, building, tenant type, and more. Drill down into the numbers that matter most to your property portfolio with just a few clicks.
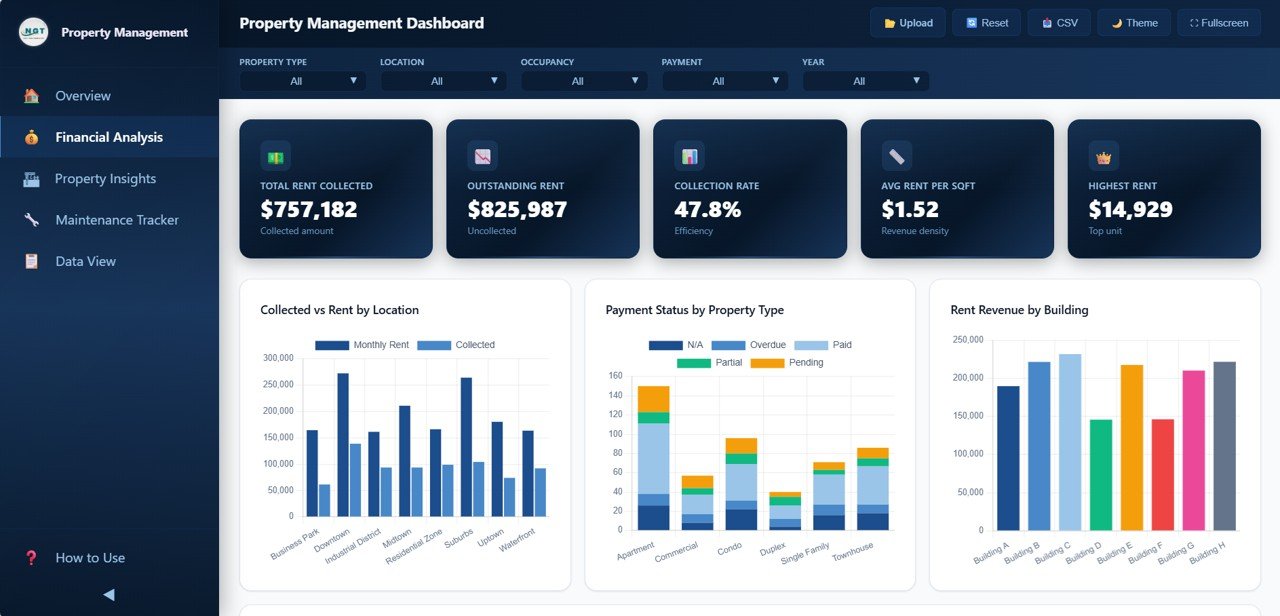
💰 Financial Analysis Module – The dedicated Financial Analysis page lets you evaluate Collected vs Rent by Location, Payment Status by Property Type, Rent Revenue by Building, and Monthly Revenue Trend by Year — helping you identify revenue leakage and collection gaps.
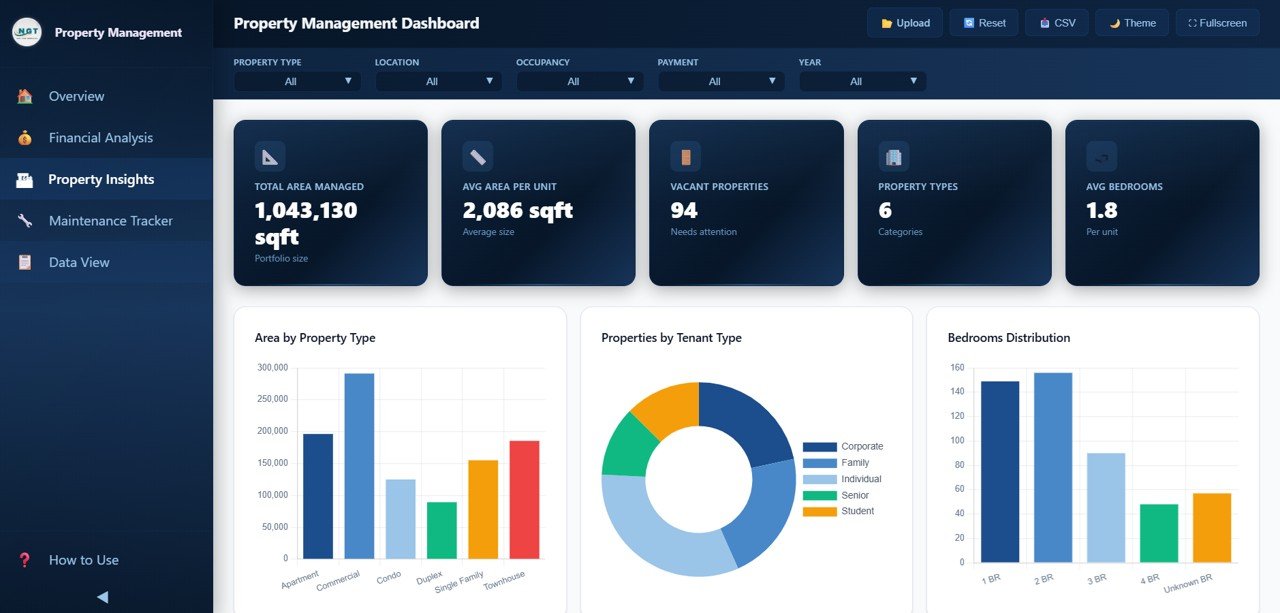
🏠 Property Insights – Analyze Area by Property Type, Properties by Tenant Type, Bedrooms Distribution, Occupancy by Location, and Lease Status Distribution to understand the composition and utilization of your portfolio.
🔧 Maintenance Tracker – Monitor Maintenance Cost by Type, Maintenance Status Distribution, Priority Distribution, Maintenance Cost by Building, and Monthly Maintenance Trend to control expenses and optimize property upkeep schedules.
📋 Data Explorer with Search and Export – The Data View page provides a comprehensive data table with search, sort, pagination, and CSV export functionality — giving you full control over your raw property data.
🖥️ Browser-Based — No Software Needed – This dashboard runs entirely inside your web browser. No need to install Excel, Power BI, or any other software. Just open the HTML file and you are ready to go.
If you are also looking for a similar dashboard in Excel, check out the Rental Property Investment Dashboard in Excel. For a Power BI version, explore the Rental Property Investment Dashboard in Power BI.
📦 What’s Inside the Property Management Dashboard in HTML
This dashboard template contains 5 interactive pages packed with powerful analytics for comprehensive property management:
📌 Overview Page – High-level KPI cards showing Total Properties, Total Rent Revenue, Occupancy Rate, Avg Monthly Rent, Total Maintenance Cost, and Avg Tenant Satisfaction. Charts include Rent Revenue by Property Type, Properties by Location, Occupancy by Property Type, Payment Status Distribution, and Monthly Rent Trend. Multiple slicers are available to quickly filter and analyze your data.
Property Management Dashboard in HTML
📌 Financial Analysis – Deep-dive into financial performance with charts for Collected vs Rent by Location, Payment Status by Property Type, Rent Revenue by Building, and Monthly Revenue Trend by Year. Quickly identify collection gaps and revenue opportunities across your property portfolio.
Financial Analysis
📌 Property Insights – Analyzes your portfolio with charts for Area by Property Type, Properties by Tenant Type, Bedrooms Distribution, Occupancy by Location, and Lease Status Distribution. Understand which property configurations and locations are performing best.
Property Insights
📌 Maintenance Tracker – Evaluates maintenance operations with charts showing Maintenance Cost by Type, Maintenance Status Distribution, Priority Distribution, Maintenance Cost by Building, and Monthly Maintenance Trend. Make data-backed decisions on property maintenance and vendor management.

Maintenance Tracker
📌 Data View – A detailed data table page where you can see all property records with search, sort, and pagination features. You can also export the filtered data to CSV for further analysis.

Data View Tab
⚙️ How to Use the Property Management Dashboard in HTML
1️⃣ Download and Extract – Download the ZIP file after purchase and extract it on your computer.
2️⃣ Open in Browser – Open index.html in any modern browser like Chrome, Firefox, Edge, or Safari.
3️⃣ Navigate the Dashboard – Explore all 5 tabs — Overview, Financial Analysis, Property Insights, Maintenance Tracker, and Data View — for complete property management analytics.
4️⃣ Replace Sample Data – Replace the sample data with your own property management data to get real-time insights.
5️⃣ Use Filters – Apply slicers and filters to narrow down analysis by property type, location, building, and more.
6️⃣ Export Data – Use the Data View tab to export filtered data to CSV for presentations or further analysis.
👥 Who Can Benefit from This Property Management Dashboard in HTML
📌 Property Managers – Monitor rent collection, occupancy, and maintenance across your entire portfolio in one place.
📌 Landlords – Track rent revenue, tenant satisfaction, lease status, and property performance effortlessly.
📌 Real Estate Investors – Analyze financial performance, payment status, and maintenance costs to maximize ROI.
📌 Facilities Operations Teams – Monitor maintenance costs, priority distribution, and status to optimize property upkeep.
📌 Property Management Companies – Get a centralized view of all managed properties with financial and operational analytics.
📌 Real Estate Analysts – Generate presentation-ready dashboards for stakeholders with interactive property analytics.
❓ Frequently Asked Questions
What KPIs does the Property Management Dashboard in HTML track?
The Property Management Dashboard in HTML tracks 6 key performance indicators including Total Properties, Total Rent Revenue, Occupancy Rate, Avg Monthly Rent, Total Maintenance Cost, and Avg Tenant Satisfaction. It also provides detailed analysis across rent collection, payment status, occupancy, lease distribution, and maintenance metrics across 5 interactive dashboard pages.
Do I need any software to use this HTML dashboard?
No. This dashboard runs entirely in your web browser. Simply unzip the downloaded file and open index.html in Chrome, Firefox, Edge, or Safari. No installation, plugins, or licenses are required.
How many dashboard pages are included in this template?
This template includes 5 fully interactive dashboard pages: Overview, Financial Analysis, Property Insights, Maintenance Tracker, and Data View. Each page focuses on a different aspect of property management operations.
Can I customize the data in this HTML dashboard?
Yes. Replace the sample data with your own property management records to get personalized insights. The dashboard automatically updates all charts, KPIs, and filters based on the data you provide.
What is the best HTML dashboard template for property management?
The Property Management Dashboard in HTML from NextGenTemplates is one of the best options available. It includes 5 interactive pages covering rent revenue, financial analysis, property insights, maintenance tracking, and a data explorer — all in a professionally designed, browser-based template that requires no software installation.
Is this dashboard available in other platforms like Excel or Power BI?
Yes. We offer property management dashboards in multiple platforms. Check out the Rental Property Investment Dashboard in Excel and the Rental Property Investment Dashboard in Power BI for alternative options.
🔗 Explore Related Templates
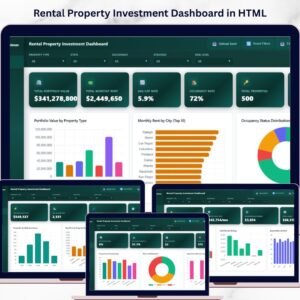
🔹 Rental Property Investment Dashboard in HTML – Track rental income, portfolio value, ROI, risk, and financing in a browser-based dashboard.
🔹 Real Estate Agent Dashboard in Excel – Track agent performance, commissions, market analysis, and property insights in Excel.
🔹 Rental Property Investment Dashboard in Google Sheets – Cloud-based rental property analytics with 6 interactive pages.
📖 Click here to read the Detailed Blog Post<
Watch the step-by-step video tutorial:
/h3>


Reviews
There are no reviews yet.