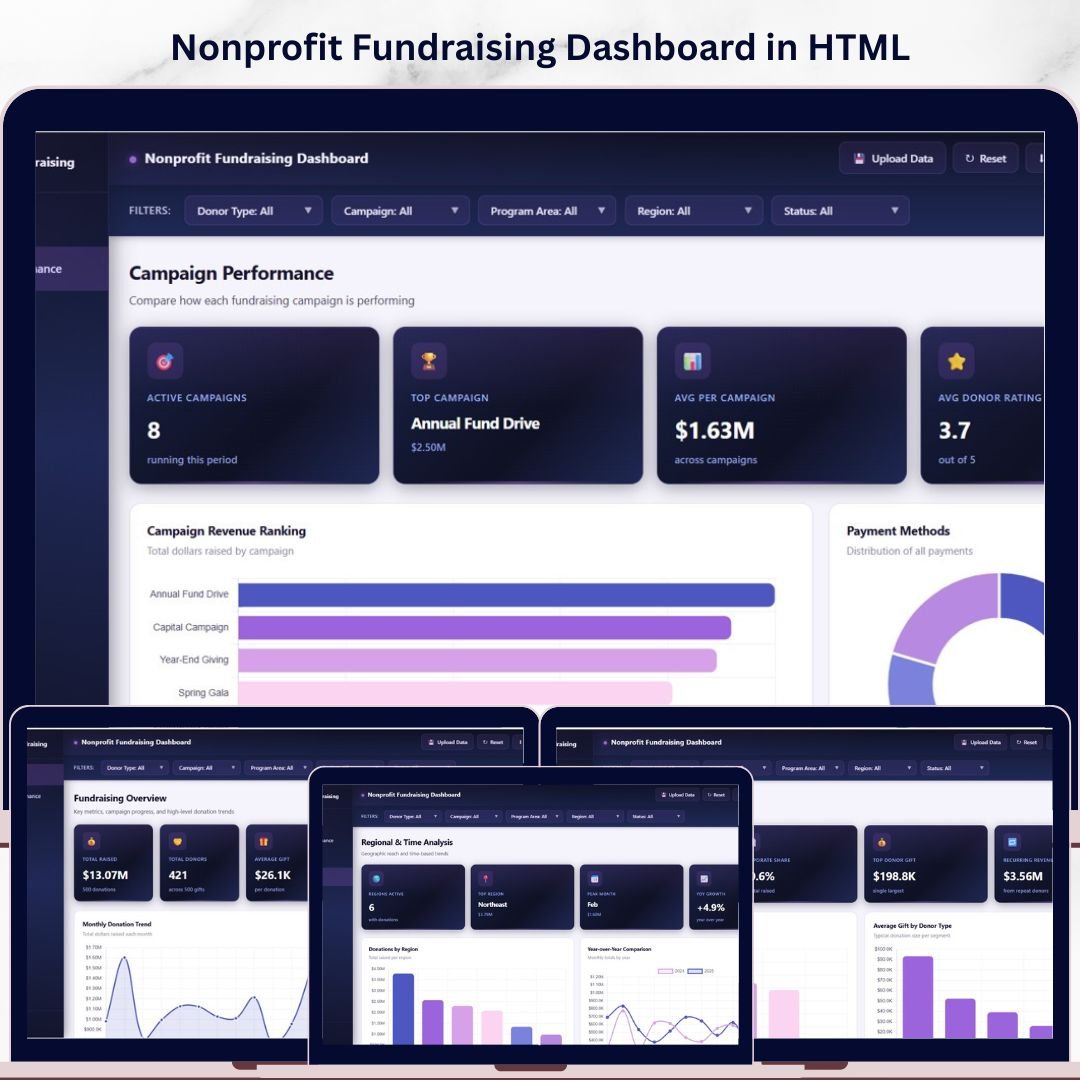
Nonprofit Fundraising Dashboard in HTML is a powerful, browser-based analytics solution designed for nonprofit managers, fundraising directors, development officers, grant coordinators, and charity analysts who need to monitor donation volumes, donor behavior, campaign effectiveness, and regional fundraising performance from a single interactive interface. This premium HTML dashboard template transforms raw fundraising data into meaningful visual insights that drive smarter, faster decisions across every level of your nonprofit organization.Nonprofit Fundraising Dashboard in HTML
Whether you manage a small community foundation or a large multi-program nonprofit, this dashboard delivers a SaaS-quality analytics experience right in your browser. No software installation is needed — just open the HTML file, upload your Excel data, and start exploring fundraising metrics across five dedicated analysis pages instantly. The Nonprofit Fundraising Dashboard in HTML includes 5 interactive pages, 6 KPI summary cards, 15+ dynamic charts, and built-in slicer filters for focused analysis.
🔑 Key Features of Nonprofit Fundraising Dashboard in HTML
This Nonprofit Fundraising Dashboard in HTML comes packed with features designed for real-world fundraising analytics. The dashboard offers multi-page interactive analytics with a modern sidebar navigation that lets you switch seamlessly between Overview, Campaign Performance, Donor Insights, Regional & Time Analysis, and Data View pages.
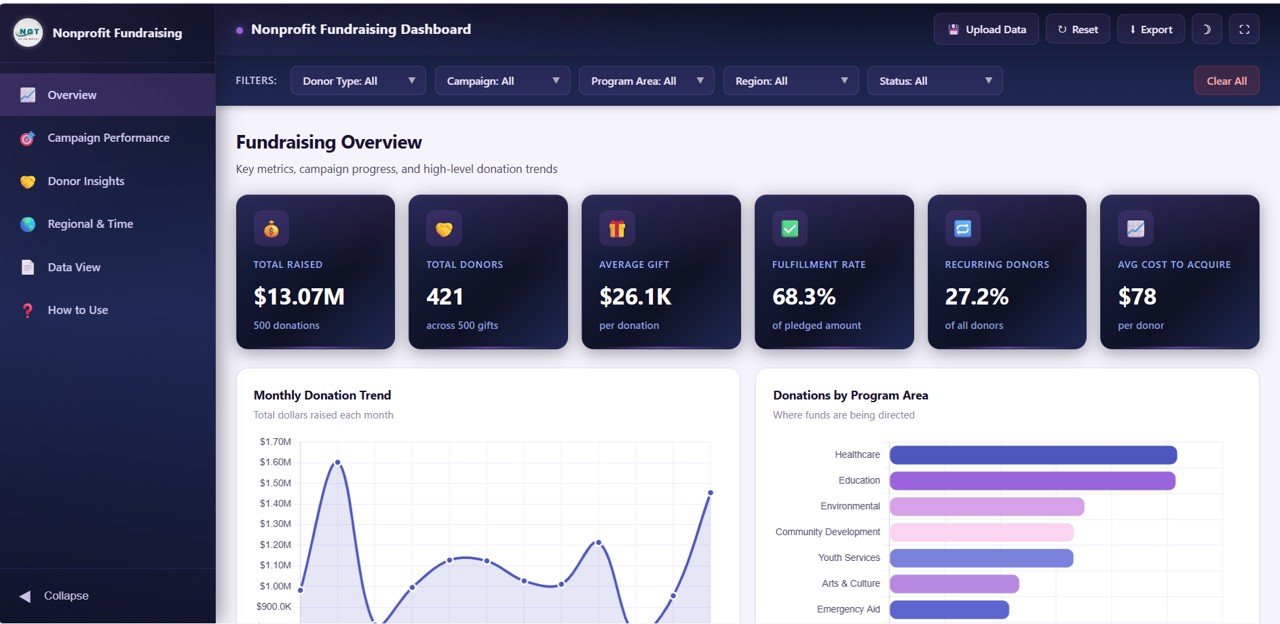
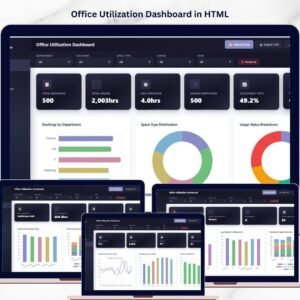
At the top of the Overview page, six dynamic KPI cards display Total Raised, Total Donors, Average Gift, Fulfillment Rate, Recurring Donors, and Average Cost to Acquire — giving you an instant operational snapshot of your entire fundraising operation. Interactive chart visualizations including bar charts, line trends, donut charts, and grouped comparisons update dynamically based on your filter selections. A built-in light and dark theme toggle ensures comfortable viewing in any environment. The Excel file upload feature lets you replace demo data with your own fundraising data instantly, while the CSV export function on the Data View page enables you to download filtered data for external reporting.
Explore similar analytics tools in our Nonprofit Fundraising Dashboard in Excel for pivot table-based analysis, or browse our full collection of HTML Dashboard Templates for other business domains.
📦 What’s Inside the Nonprofit Fundraising Dashboard in HTML
1. Overview Page
The Overview page serves as your fundraising command center. Six high-level KPI cards display Total Raised, Total Donors, Average Gift, Fulfillment Rate, Recurring Donors, and Average Cost to Acquire. Below the cards, five interactive charts provide quick visual insights: Monthly Donation Trend reveals seasonal patterns and growth trajectories. Donations by Program Area breaks down fundraising across different programs. Status Breakdown visualizes donation fulfillment categories. Donations by Channel shows which fundraising channels drive the most revenue. Donor Type Mix displays the distribution between individual, corporate, foundation, and other donor categories. Multiple slicers let you filter the entire dashboard instantly.Nonprofit Fundraising Dashboard in HTML
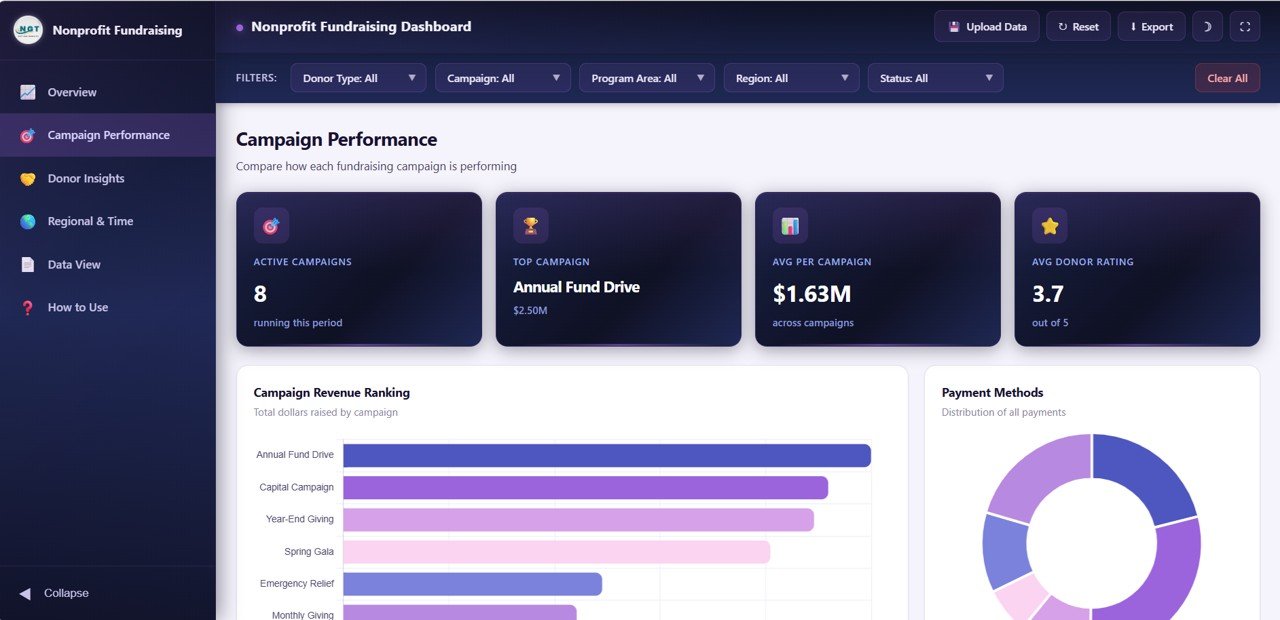
2. Campaign Performance
The Campaign Performance page dives deep into how your fundraising campaigns are performing. Raised by Campaign reveals which campaigns are generating the most revenue. Share by Payment Method shows the distribution across credit card, bank transfer, check, and online payment channels. Raised by Channel compares direct mail, online, events, and other fundraising channels. Donors by Rating segments your donor base by engagement and giving level, helping you identify high-value supporters who deserve special attention.Nonprofit Fundraising Dashboard in HTML
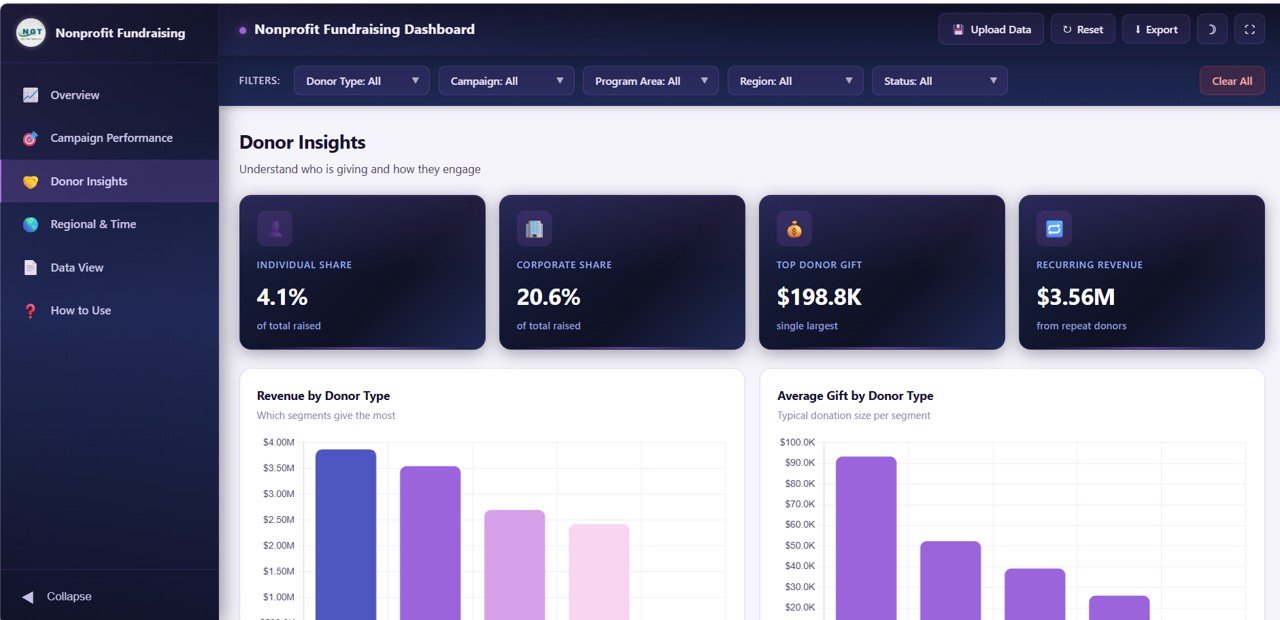
3. Donor Insights
The Donor Insights page helps you understand your donor base in detail. Raised by Donor Type shows how much each donor category contributes to total fundraising. Average Gift by Donor Type compares giving levels across individual, corporate, and foundation donors. Raised by Top Donor highlights your most generous supporters. Raised by Recurring Status separates one-time donations from recurring giving, helping you understand the stability of your revenue stream.
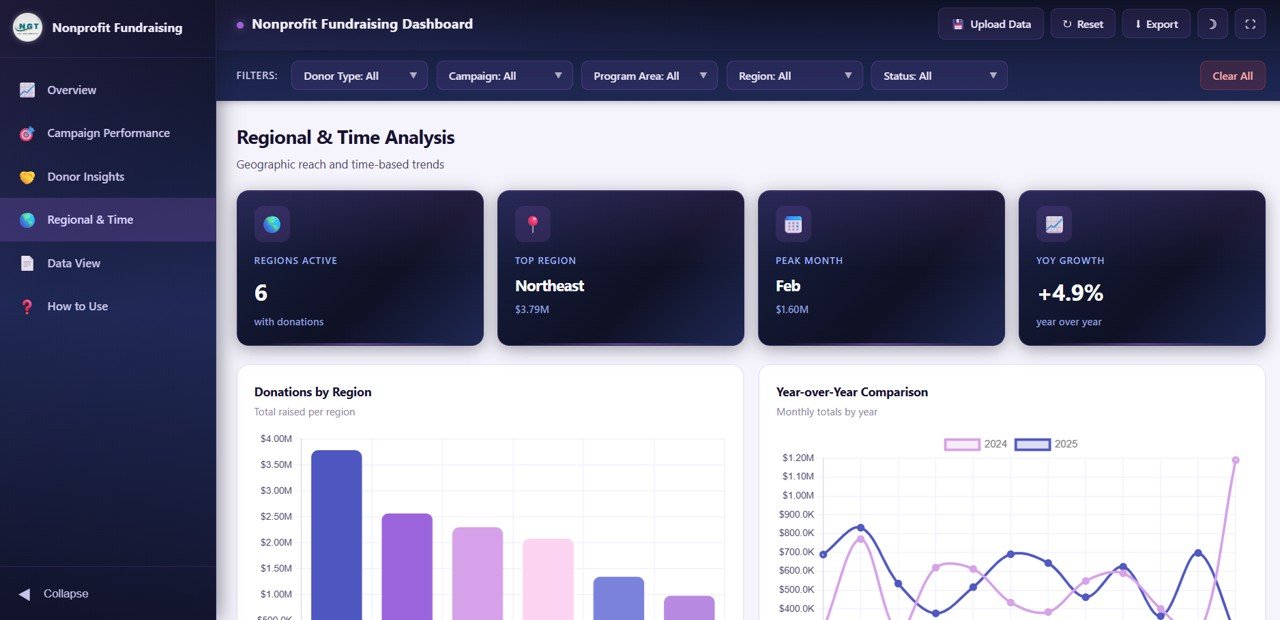
4. Regional and Time Analysis
The Regional and Time Analysis page provides geographic and temporal insights into your fundraising. Raised by Region reveals which geographic areas generate the most donations. Raised by Month and Year shows fundraising trends over time. Raised by Quarter provides quarterly aggregation for board-level reporting. Fulfillment Rate by Region identifies areas where donation fulfillment may need improvement.Nonprofit Fundraising Dashboard in HTML
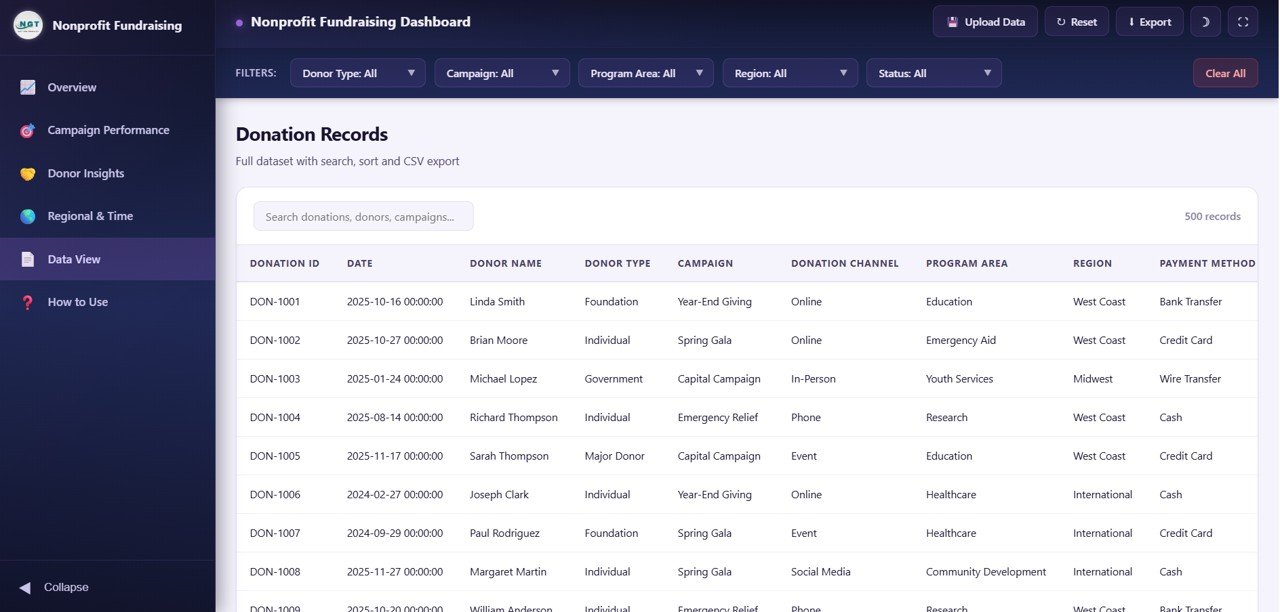
5. Data View
The Data View page is a detailed data table that displays all donation records. This page features search functionality, column sorting, and pagination for navigating through large datasets efficiently. You can also export the filtered data to CSV format for use in external reports, grant applications, or further analysis in tools like Google Sheets or Excel.Nonprofit Fundraising Dashboard in HTML
⚙️ How to Use the Nonprofit Fundraising Dashboard in HTML
1️⃣ Download and unzip the template file to your computer
2️⃣ Open the index.html file in any modern browser (Chrome, Edge, Firefox, Safari)
3️⃣ Explore the demo data across all 5 dashboard pages
4️⃣ Upload your own fundraising data using the Excel upload feature
5️⃣ Use slicer filters to drill into specific programs, channels, regions, or donor types
6️⃣ Export filtered data from the Data View page to CSV for reporting
👥 Who Can Benefit from This Nonprofit Fundraising Dashboard in HTML
🔹 Nonprofit Executive Directors monitoring overall fundraising health
🔹 Development Officers tracking campaign performance and donor engagement
🔹 Grant Coordinators preparing fundraising reports for board meetings
🔹 Fundraising Analysts identifying top-performing campaigns and channels
🔹 Charity Managers comparing regional fundraising trends
🔹 Volunteer Coordinators understanding donor acquisition costs
❓ Frequently Asked Questions
What KPIs does the Nonprofit Fundraising Dashboard in HTML track?
The Nonprofit Fundraising Dashboard in HTML tracks 6 key performance indicators: Total Raised, Total Donors, Average Gift, Fulfillment Rate, Recurring Donors, and Average Cost to Acquire. Across all 5 pages, it visualizes 15+ metrics covering campaigns, donor types, channels, regions, and time trends.
Do I need any special software to use this HTML dashboard?
No. This dashboard is built with pure HTML, CSS, and JavaScript. Simply open the index.html file in any modern web browser. No Excel, Power BI, or any other software installation is required.
Can I customize the dashboard with my own fundraising data?
Yes. The template includes a data file where all sample records are stored. Replace it with your own fundraising data and the entire dashboard — all charts, KPIs, filters, and tables — updates automatically.
What is the best dashboard template for tracking nonprofit fundraising?
The Nonprofit Fundraising Dashboard in HTML by NextGenTemplates is one of the best options available. It includes 5 dedicated pages covering an Overview with 6 KPI cards, Campaign Performance, Donor Insights, Regional & Time Analysis, and a Data View with CSV export — all running in your browser with zero installation.
Can I export data from the dashboard for grant reporting?
Yes, the Data View page includes a CSV export feature that lets you download filtered donation records. You can use this exported data in Excel, Google Sheets, or any reporting tool for grant applications and board presentations.
Is this dashboard suitable for tracking recurring donations?
Absolutely. The dashboard displays Recurring Donors as a dedicated KPI card on the Overview page and provides a Raised by Recurring Status analysis on the Donor Insights page, making it excellent for nonprofits focused on building sustainable recurring giving programs.
🔗 Explore Related Templates
🔹 Nonprofit Fundraising Dashboard in Excel — Track fundraising with pivot tables and automated Excel formulas
🔹 Hospital Patient Flow Dashboard in HTML — Monitor patient flow and healthcare operations in your browser
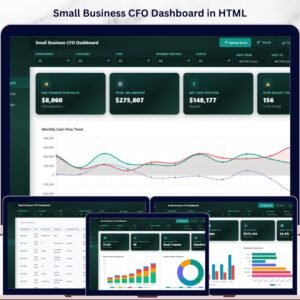
🔹 Small Business CFO Dashboard in HTML — Financial analytics dashboard for small business finance management
📖 Click here to read the Detailed Blog Post
Watch the step-by-step video tutorial:


Reviews
There are no reviews yet.