Managing leather processing operations without clear performance tracking is like running a factory without visibility. Every stage — soaking, liming, tanning, finishing, quality inspection, and dispatch — directly impacts product quality, operational cost, and delivery timelines. Therefore, businesses need a smart and structured way to monitor performance continuously.
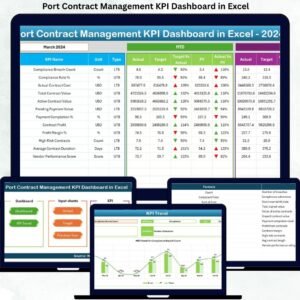
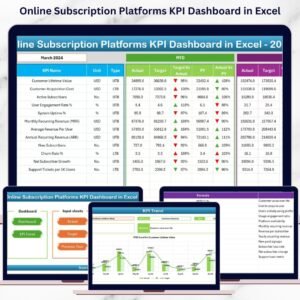
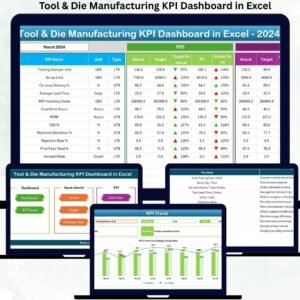
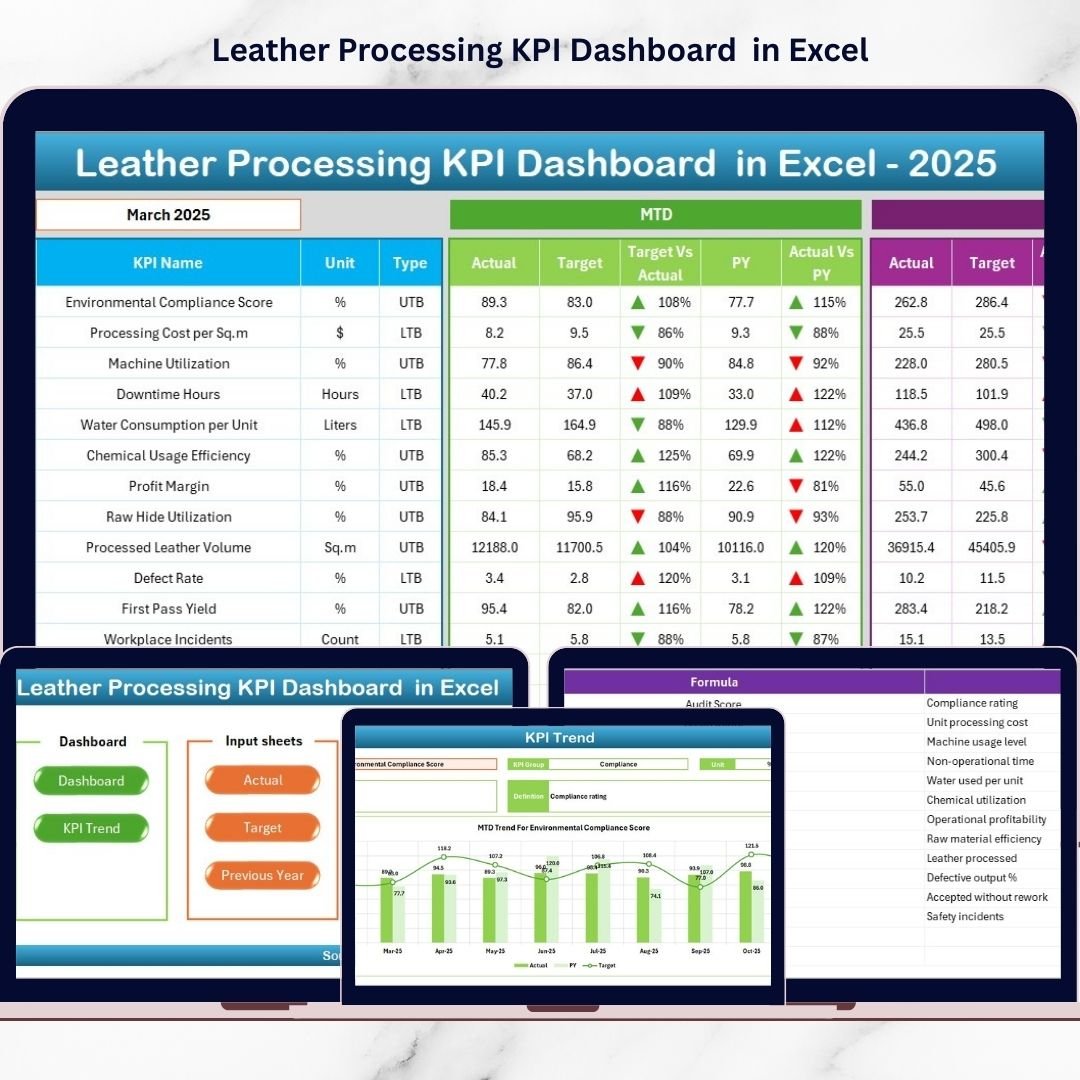
The Leather Processing KPI Dashboard in Excel is a powerful, ready-to-use performance management solution designed specifically for leather manufacturing industries. Instead of handling scattered spreadsheets or delayed reports, this dashboard transforms operational data into clear visual insights that help managers make faster and smarter decisions.
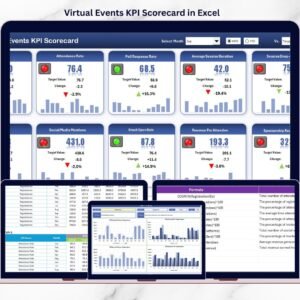
Built entirely in Microsoft Excel, this dashboard combines automation, structured KPI tracking, and interactive analytics into one easy-to-use system. With dynamic dropdowns, automated calculations, and visual indicators, you can instantly monitor performance trends, compare targets, and identify improvement opportunities.
Whether you manage production efficiency, quality control, or plant performance, this dashboard provides a centralized view of all critical KPIs — helping your organization move toward data-driven operations.
🚀 Key Features of Leather Processing KPI Dashboard in Excel
✅ Interactive KPI dashboard with automatic updates
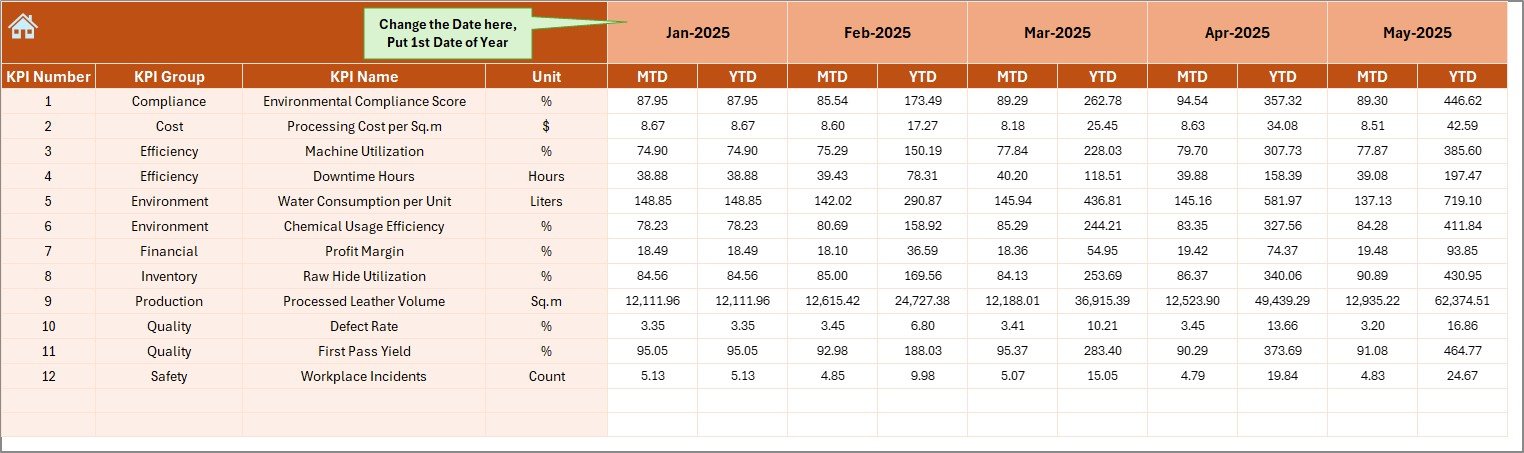
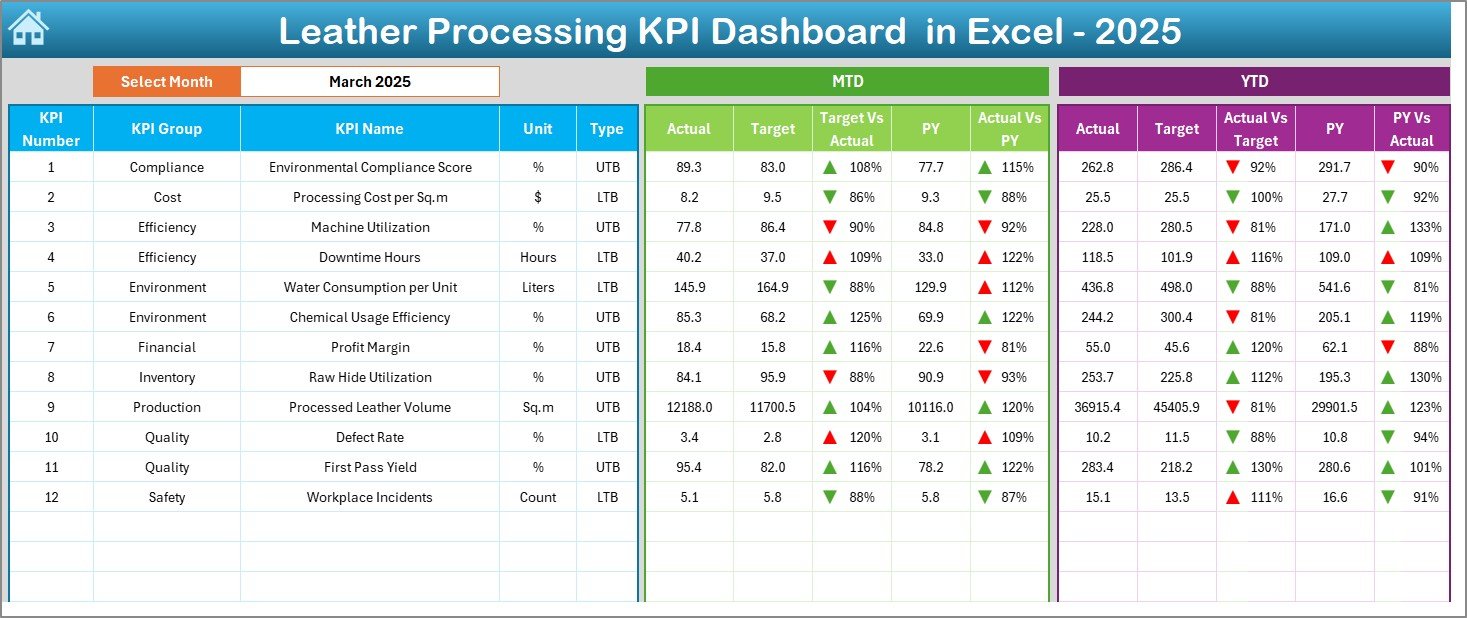
✅ MTD and YTD performance tracking in one screen
✅ Target vs Actual comparison with visual indicators
✅ Previous year performance benchmarking
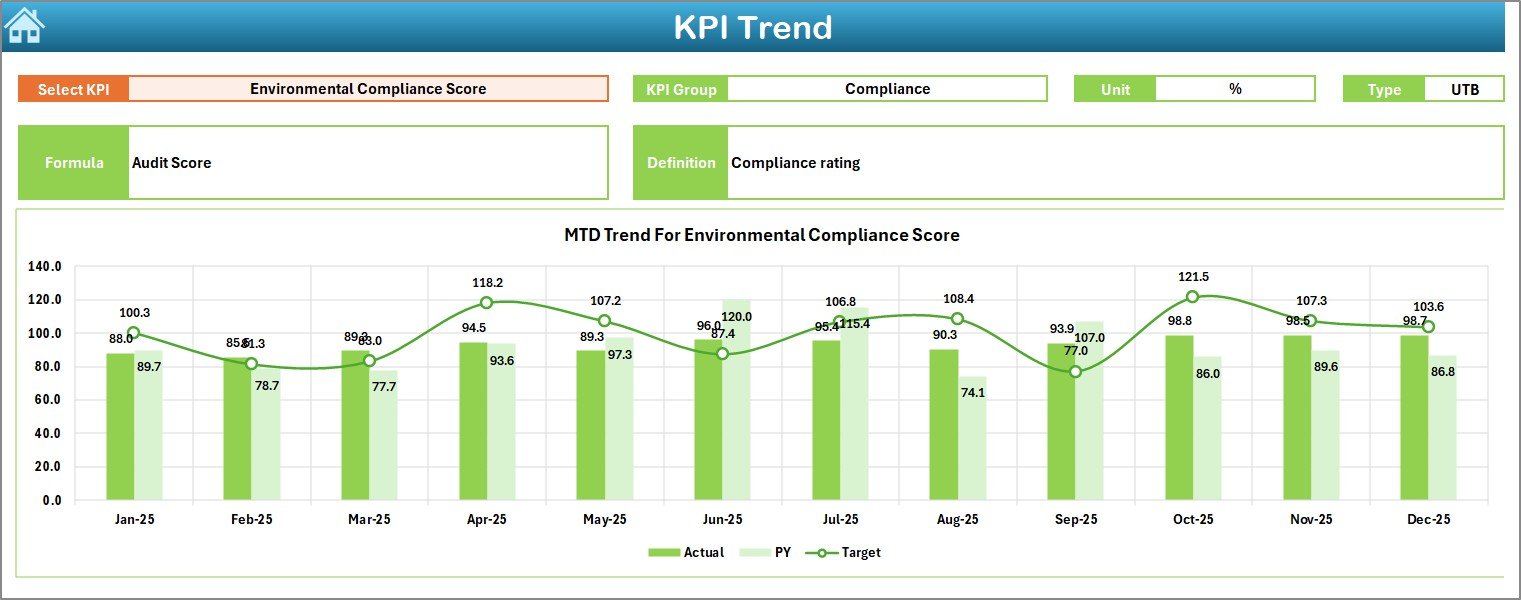
✅ Dynamic KPI trend analysis charts
✅ Easy month selection using dropdown controls
✅ Structured data entry sheets for accuracy
✅ Conditional formatting arrows for instant insights
✅ Beginner-friendly navigation with summary page
✅ Fully customizable KPI structure
📦 What’s Inside the Leather Processing KPI Dashboard in Excel
This ready-to-use workbook includes multiple structured worksheets designed for complete performance management:
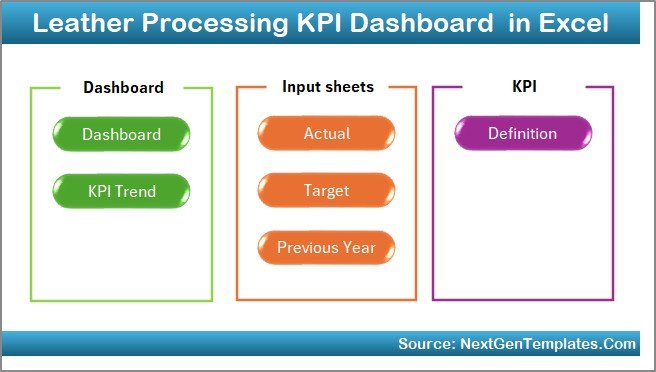
📊 Summary Sheet – Quick navigation hub for smooth workflow
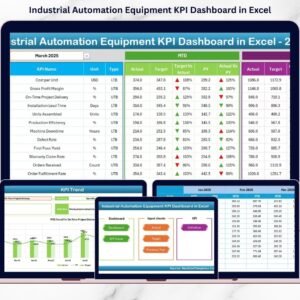
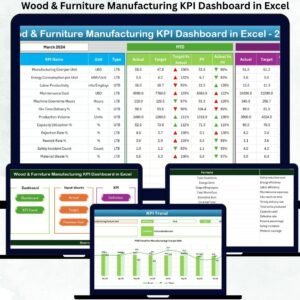
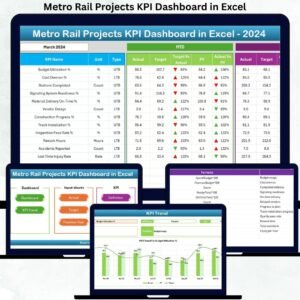
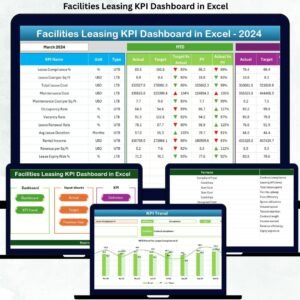
📈 Dashboard Sheet – Main performance overview with KPI comparisons
📉 Trend Sheet – Deep KPI analysis with MTD & YTD trend charts
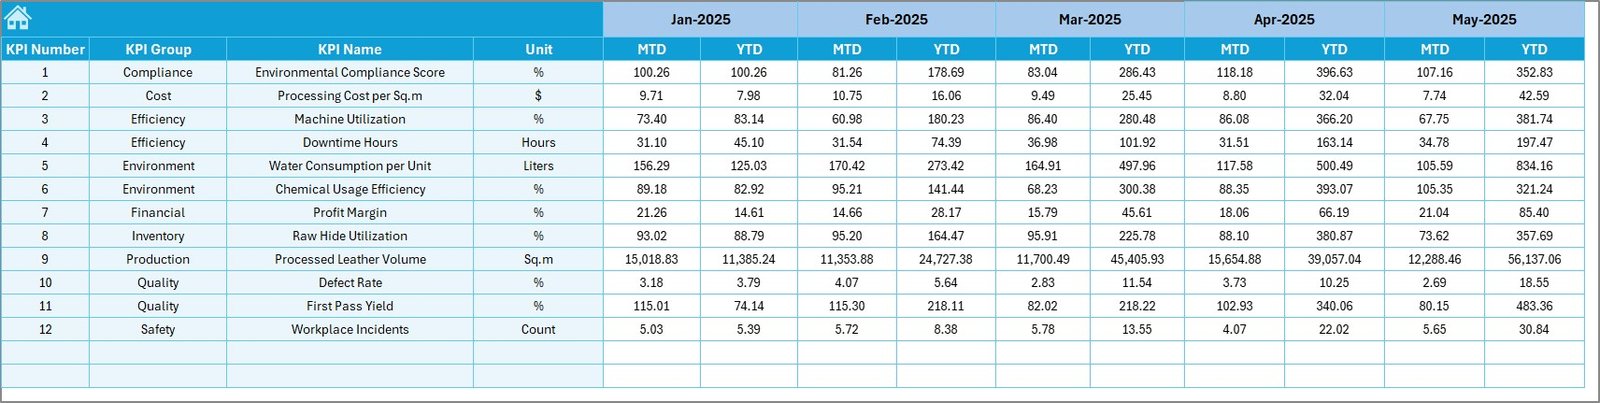
✍ Actual Numbers Input Sheet – Simple monthly data entry system
🎯 Target Sheet – Centralized KPI goal management
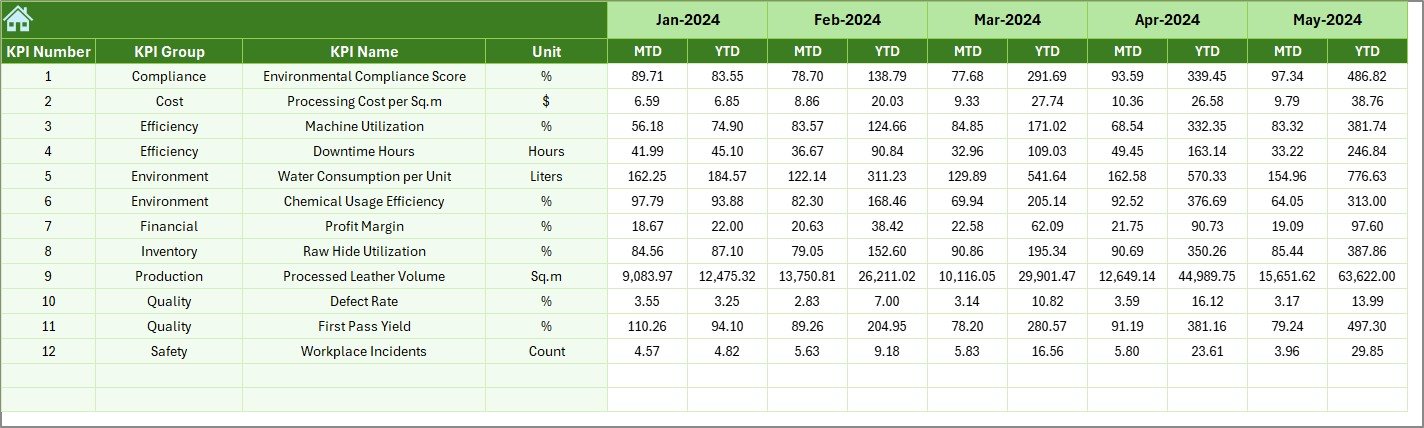
📅 Previous Year Data Sheet – Historical benchmarking analysis
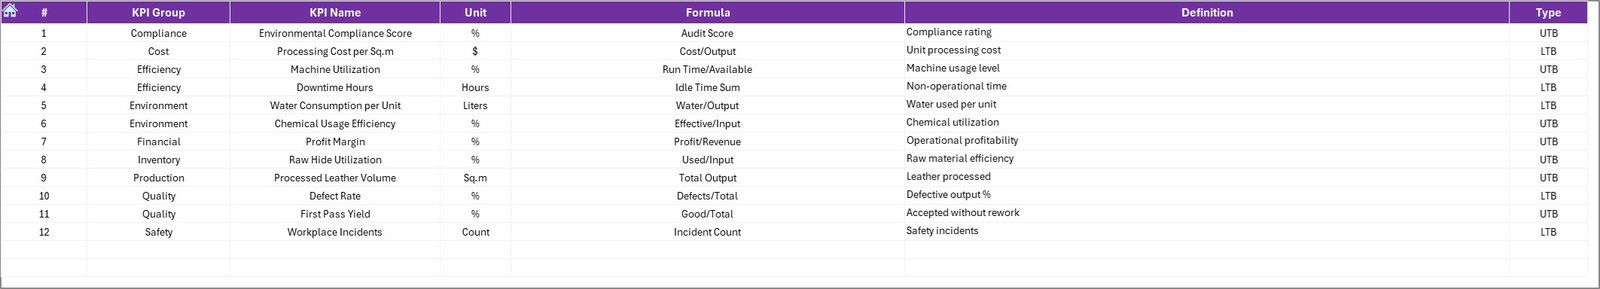
📘 KPI Definition Sheet – Standardized KPI formulas and definitions
Each sheet works together automatically, eliminating manual calculations and reporting complexity.
⚙️ How to Use the Leather Processing KPI Dashboard in Excel
Using the dashboard is simple and requires only basic Excel knowledge:
1️⃣ Define KPIs and performance metrics in the KPI Definition sheet
2️⃣ Enter monthly targets in the Target sheet
3️⃣ Add previous year performance data for comparison
4️⃣ Input actual operational numbers monthly
5️⃣ Select the reporting month from the dashboard dropdown
6️⃣ Instantly analyze performance insights and trends
Once data is entered, charts and indicators update automatically — saving hours of manual analysis.
👥 Who Can Benefit from This Leather Processing KPI Dashboard
This dashboard is ideal for professionals across leather manufacturing operations:
👨🏭 Production Managers – Monitor efficiency and throughput
🔍 Quality Control Teams – Track defect rates and reprocessing trends
🏭 Plant Managers – Analyze operational performance instantly
📊 Operations Analysts – Generate insights quickly
💼 Business Owners – Evaluate productivity and profitability drivers
📦 Supply Chain Teams – Improve delivery performance tracking
From small leather units to large processing plants, this dashboard enables structured performance monitoring without expensive software investments.
By implementing KPI tracking consistently, organizations gain visibility into operations, reduce wastage, improve quality standards, and strengthen decision-making processes. Instead of reacting to problems late, managers can proactively identify risks and take corrective actions early.
The Leather Processing KPI Dashboard in Excel is not just a reporting tool — it is a strategic performance system that helps leather manufacturers build efficiency, accountability, and continuous improvement.
Click here to read the Detailed blog post
Watch the step-by-step video tutorial: