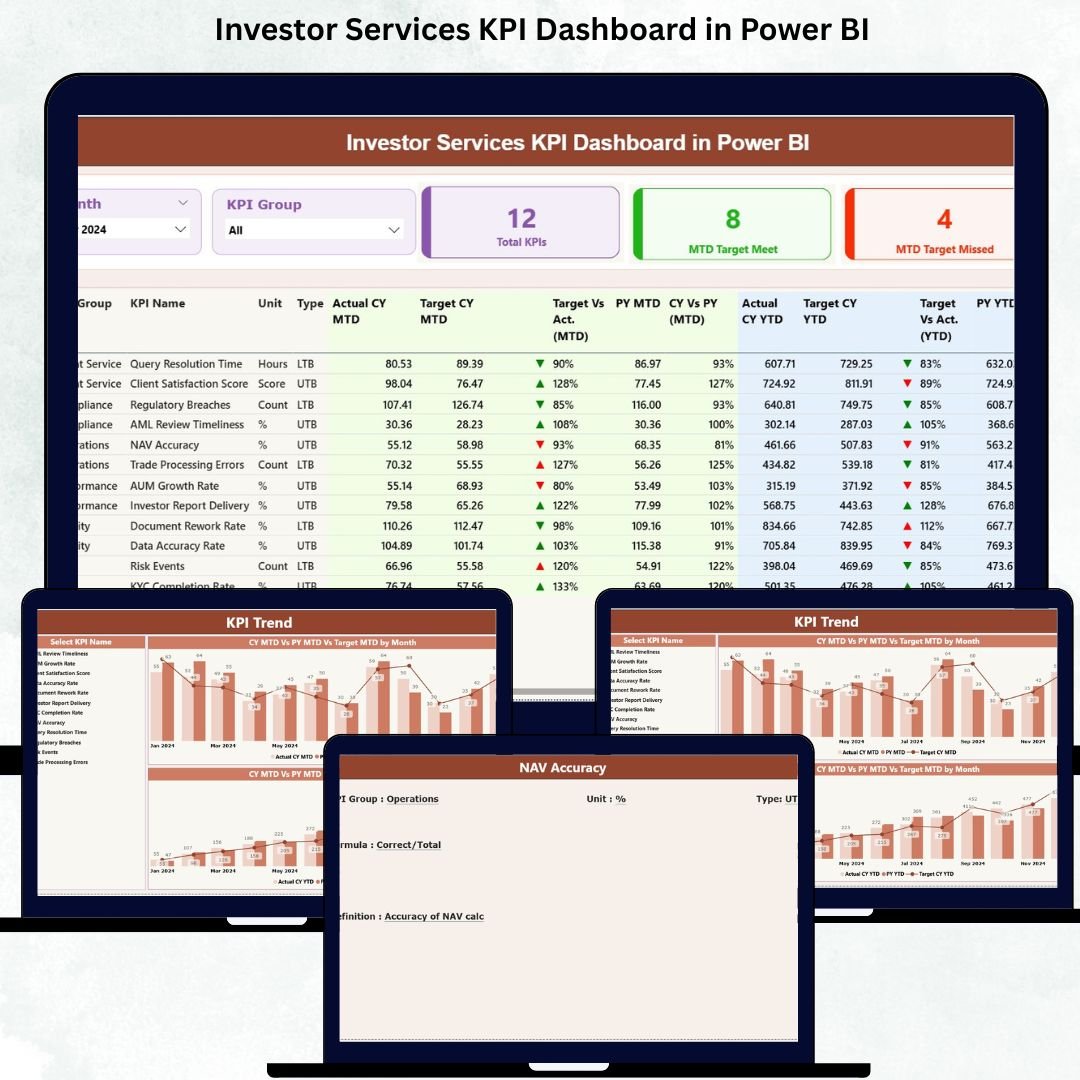
The Investor Services KPI Dashboard in Power BI is the ultimate performance-tracking solution designed for teams that handle investor onboarding, communication, reporting, compliance reviews, and service-level commitments. In a fast-paced environment where accuracy and responsiveness matter the most, this dashboard gives you one centralized system to track KPIs, identify bottlenecks, and make smarter decisions instantly.
This ready-to-use dashboard converts your monthly and yearly performance data into clear visuals, trend charts, KPI cards, and comparison metrics. Built on Power BI with an Excel data source, it brings automation, transparency, and continuity to investor operations. Whether you manage investor relations, service operations, reporting teams, or compliance workflows—this dashboard helps you stay ahead with real-time insights and simple navigation.
With slicers, drill-through features, KPI definitions, and visual trend analysis, the dashboard ensures your entire team stays aligned, accountable, and performance-driven. Let’s explore everything included in this powerful template.
✨ Key Features of the Investor Services KPI Dashboard in Power BI
This dashboard is packed with smart features that help investor services teams track and improve performance easily.
-
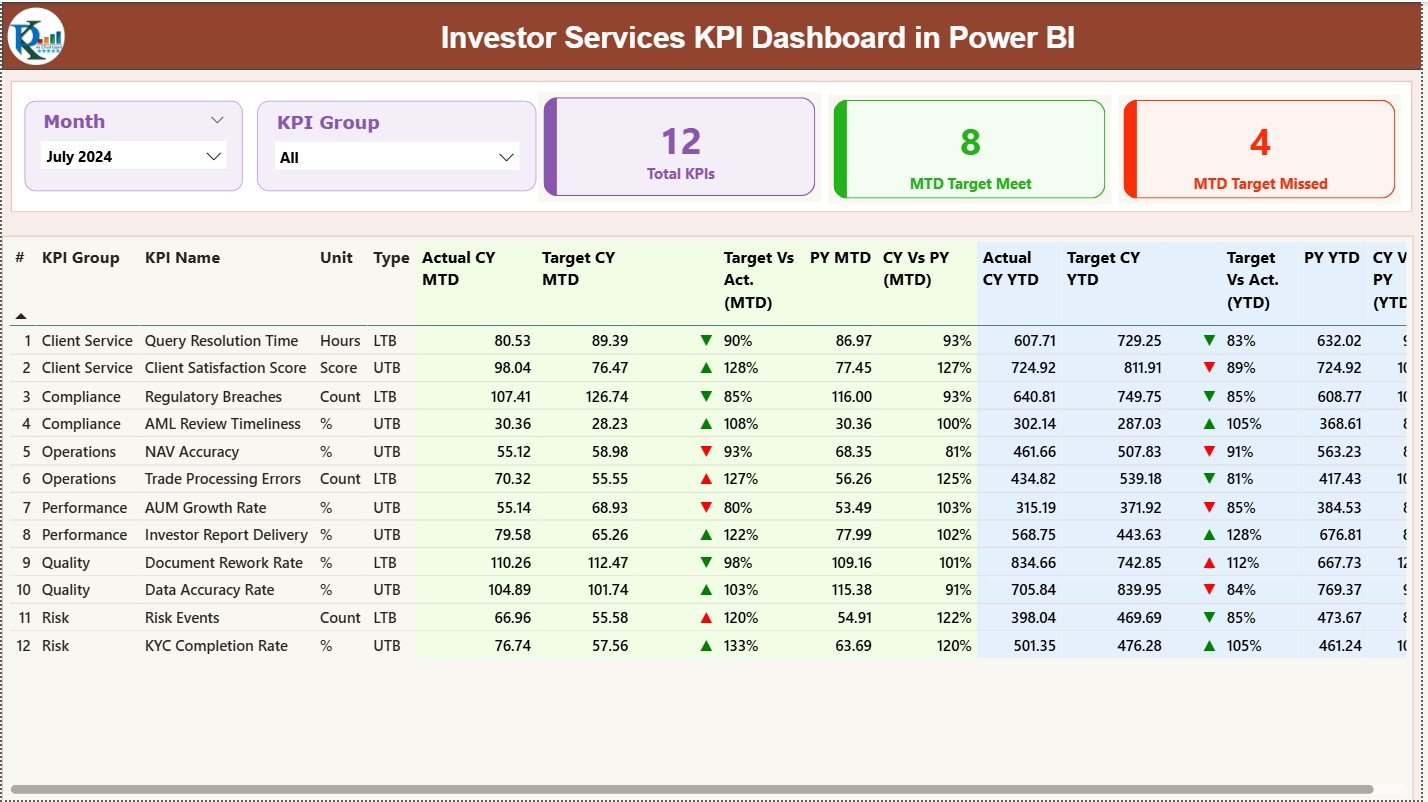
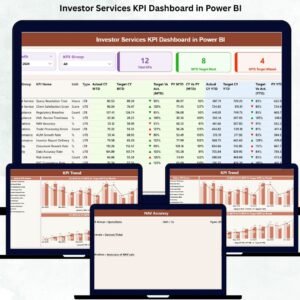
📊 Summary Page: Review all KPIs with Month and KPI Group slicers. Instantly view Total KPIs, MTD Target Meet, and MTD Target Missed counts.
-
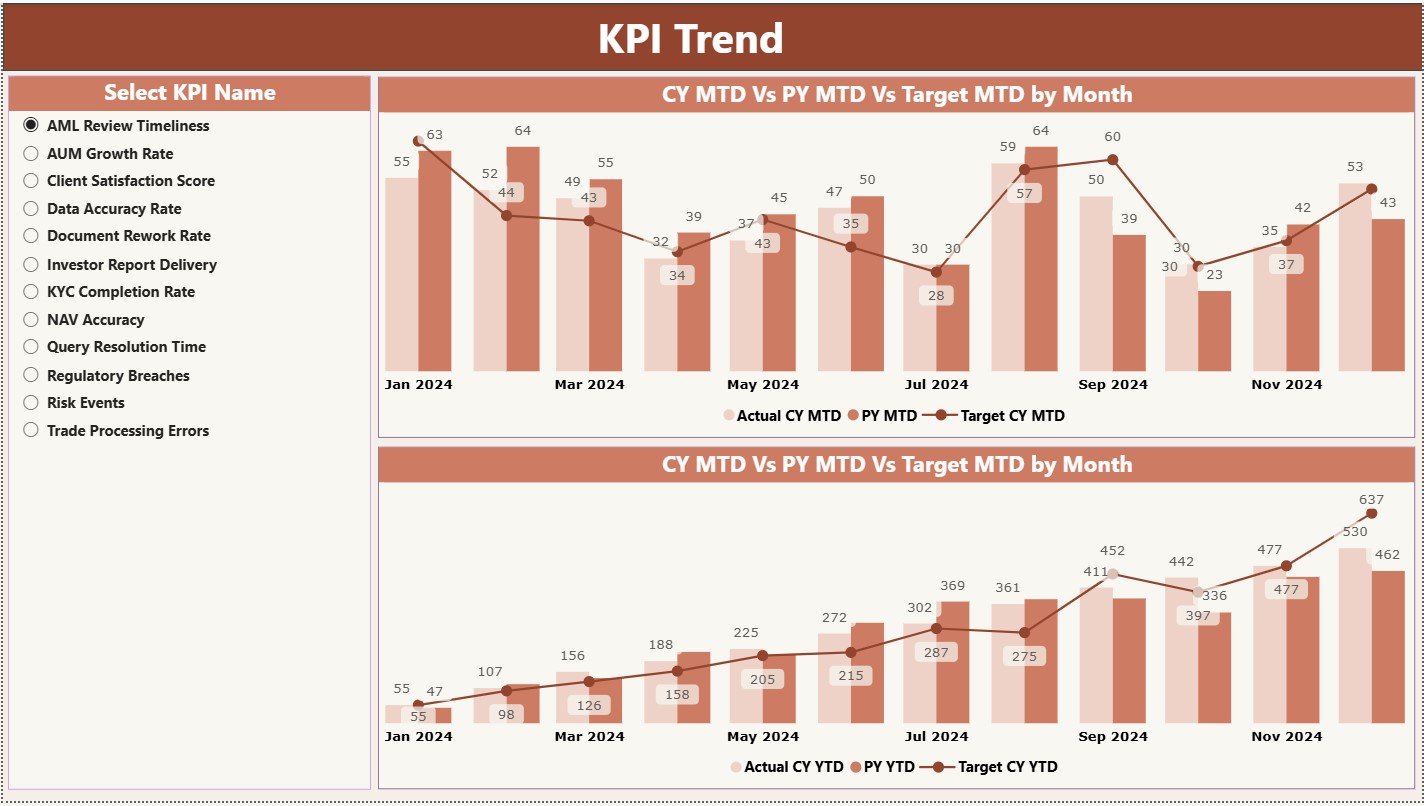
📈 Trend Page: Deep dive into KPI performance with MTD and YTD trend charts showing Current Year Actual, Previous Year Actual, and Target values.
-
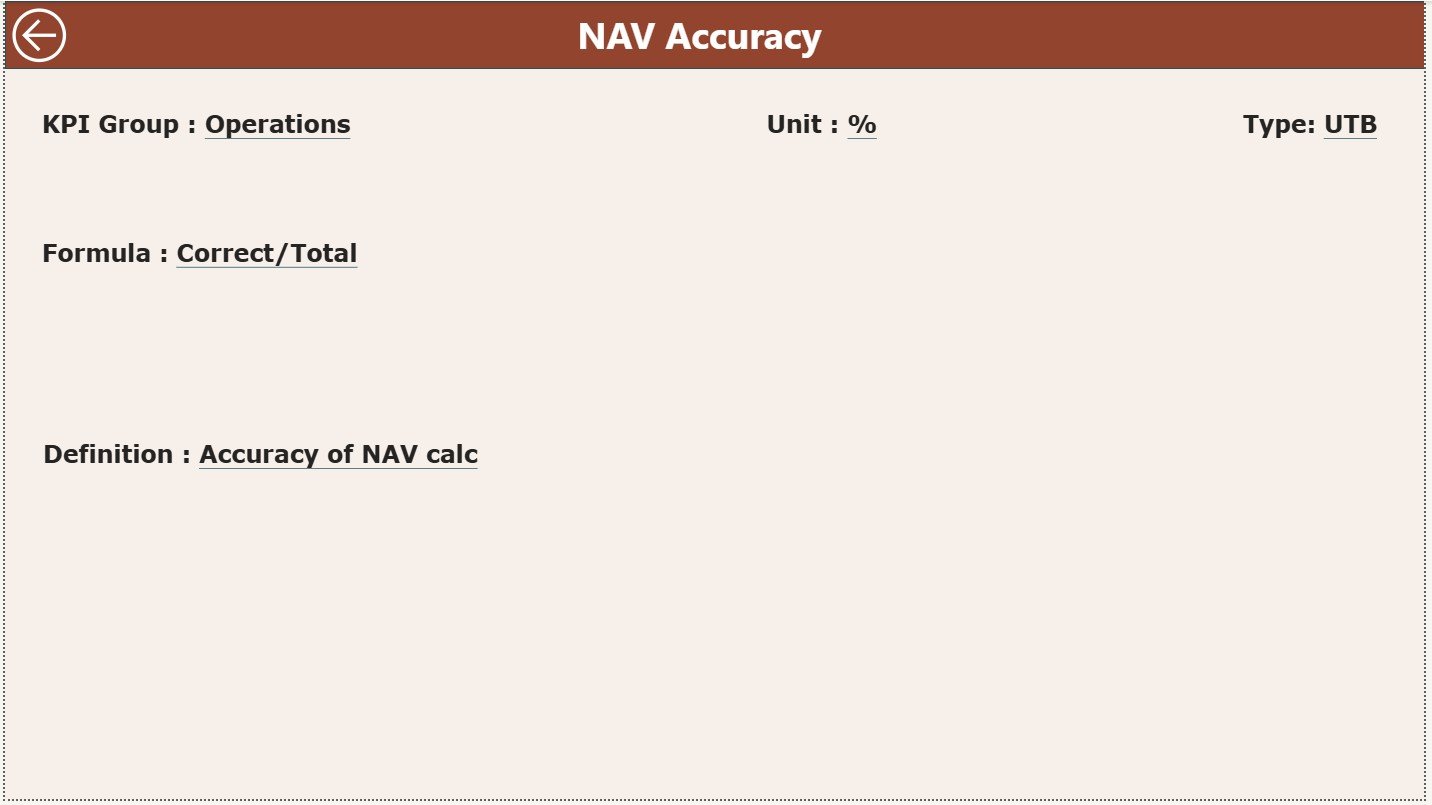
📖 KPI Definition Page: Understand every KPI with clear definitions, formulas, units, and types (UTB/LTB). This acts as a reference library for your team.
-
🟢🔴 Visual Indicators: Green ▲ and red ▼ icons make KPI performance status instantly visible.
-
📂 Structured Excel Data Source: Includes Actuals, Targets, and KPI Definition sheets for seamless monthly updates.
📦 What’s Inside the Investor Services KPI Dashboard in Power BI
Inside this template, you get everything needed for automated investor services performance tracking:
-
Power BI Dashboard File (.pixy) with 3 interactive pages
-
Excel Data File (.xlsx) containing:
-
Input Actual sheet
-
Input Target sheet
-
KPI Definition sheet
-
-
Pre-designed visuals for MTD/YTD actuals, targets, and PY comparisons
-
Automated slicers for Month and KPI Group
-
Drill-through functionality for KPI details
-
Clean layout with easy-to-read charts and tables
Everything is structured so you can plug in your data and start using the dashboard immediately.
🛠️ How to Use the Investor Services KPI Dashboard in Power BI
Using this dashboard is simple and efficient:
-
Update the Excel File with your monthly actuals and target numbers.
-
Load the Excel File into Power BI (included in the setup).
-
Use the Summary Page to review KPI performance for the selected month.
-
Switch KPI Groups like onboarding, reporting, compliance, or investor support to filter data instantly.
-
Open the Trend Page to understand performance patterns and improvement areas.
-
Drill Through to KPI Definitions to understand formulas, units, or measurement types.
-
Refresh Power BI whenever new data is added.
This workflow ensures you always have updated insights without manual reporting.
👥 Who Can Benefit from This Investor Services KPI Dashboard in Power BI
This dashboard is perfect for organizations that want accuracy, transparency, and high-quality investor service. Ideal users include:
-
Investor Relations Teams
-
Customer/Investor Service Departments
-
Asset Management Companies
-
Compliance & Reporting Teams
-
Fund Administrators
-
Operations Managers
-
Performance Analytics Teams
Whether you’re tracking response times, SLA adherence, compliance checks, or reporting accuracy, this dashboard is designed to support every aspect of investor servicing.
### Click here to read the Detailed blog post
Visit our YouTube channel to learn step-by-step video tutorials


Reviews
There are no reviews yet.